Feature Selection and Categorization to Design Reliable Fault Detection
Systems
H. Senoussi 1,a, B. Chebel-Morello 2, M. Denaï 3 and N. Zerhouni 4
1University of Sciences and Technology, Mohamed Boudiaf, Oran, Algeria
senoussih@yahoo.fr
2,4Automatic Control and Micro-Mechatronic Systems Department of the FEMTO-ST Institute, Besancon, France
Brigitte.Morello@ens2m.fr N. Zerhouni @ens2m.fr 3
Teesside University, Middlesbrough, England M.Denai@tees.ac.uk
A
BSTRACTIn this work, we will develop a fault detection system which is identified as a classification task. The classes are the nominal or malfunctioning state. To develop a decision system it is important to select among the data collected by the supervision system, only those carrying relevant information related to the decision task. There are two objectives presented in this paper, the first one is to use data mining techniques to improve fault detection tasks. For this purpose, feature selection algorithms are applied before a classifier to select which measures are needed for a fault detection system. The second objective is to use STRASS (STrong Relevant Algorithm of Subset Selection), which gives a useful feature categorization: strong relevant features, weak relevant and/or redundant ones. This feature categorization permits to design reliable fault detection system. The algorithm is tested on real benchmarks in medical diagnosis and fault detection. Our results indicate that a small number of measures can accomplish and perform the classification task and shown our algorithm ability to detect the correlated features. Furthermore, the proposed feature selection and categorization permits to design reliable and efficient fault detection system.
1. INTRODUCTION
We work in conditional maintenance when the supervision system surveys the fault appearance. In a real supervision system, digital data collection devices and data storage technology allow organizations to store up huge data. The large amounts of data, has created a massive request for new
tools to transform data into task oriented knowledge (The knowledge data discovery, and data mining area). Our work concentrates on real-world problems and fault detection system, where the learner has to handle problems dealing with datasets containing large amounts of irrelevant information [9],[13],[14]. Initial features are often selected subjectively based on human experience. However, when large amount of data are being monitored, expert judgement may be subject to errors and biases. It is therefore desirable to use fully automated feature selection algorithm to overcome these shortcomings.
Over-instrumentation: monitoring too many metrics of a system poses significant problems, as a large number of threshold estimation, quantification, aggregation, situation identification and diagnostic rules exclude reliable manual design and maintenance, especially in evolving applications. On the other hand monitoring too many metrics also causes unnecessary performance overhead on the monitored systems, and data collection nodes especially in case of historic data collection.
Under-instrumentation: the improper reduction of the set of monitored metrics, on the other hand can significantly compromise the capabilities of supervision, manifesting in large reaction times to workload changes, significantly reduced availability due to late error detection and diagnosis. The selection of a compact, but sufficiently characteristic set of control variables is one of the core problems both for design and run-time complexity [43]. Dimension reduction methods are usually divided into two groups: feature extraction and feature selection approaches. Feature extraction aims at applying a projection of the multidimensional problem space into a space of fewer dimensions thus resulting in aggregate measures that did not exist in the measured environment while feature selection is
a The author has performed this work in Automatic Control and Micro-Mechatronic Systems Department of the FEMTO-ST Institute as part of a joint-guardianship thesis's with B. Chebel-Morello and N. Zerhouni.
finding a subset of the measured variables or a subset of the transformed variables via feature extraction.
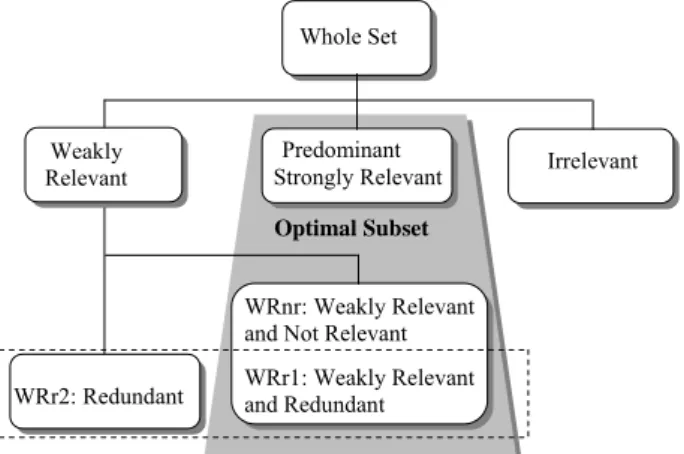
Many descriptive features may affect the precision of a classifier and some can even parasitize the processing of data. However, it should be noted that features do not have the same importance/role in the development of the classifier. Therefore it is very useful to be able to identify, within the whole training set, the appropriate features’ types to discriminate between the fault detection concepts being considered . Yu et al [25] counted four (4) different features types namely irrelevant ones, strongly relevant, weakly relevant and redundant ones. An entire feature set can be conceptually divided into four (4) basic disjoint parts: irrelevant features (I), redundant features (part of weakly relevant features (WRr1 and WRr2)), weakly relevant but non-redundant features (WRnr), and strongly relevant features (predominant). Fig. 2 illustrates this hierarchy. The optimal subset essentially contains all predominant features, WRnr and WRr1 or WRr2. WRr1 is a subset of weakly relevant features having theirs redundant or equivalent features in WRr2.
Figure 1. Hierarchy of feature‘s relevance and redundancy First of all, we have to reduce the number of sensors/metrics considered in order to avoid over instrumentation and to simplify the classification problem. The filter algorithm STRASS [22] is initially used to select relevant information, construct a robust fault detection model and speed up training time. Moreover the proposed feature selection algorithm is based on two criteria of relevance which provide a useful features’ categorization (Fig. 1): the strongly, weakly relevant features and the redundant ones. This features’ categorisation is based on criteria developed in [22], [35]. In our precedent study [22], we define two complementary criteria, one Myopic and the other Contextual, to take into account partially redundant feature and privilege the quality detection of relevant subset feature. The proposed criteria attempt to explicitly address feature interactions by finding some low-order interactions 2-way
(one feature and the class) and high order interactions k-way (k features and the class) interactions. Those criteria are associated with a greedy algorithm which is noted STRASS (STrong Relevant Algorithm of Subset Selection). STRASS proves its efficiency and effectiveness comparing with five representative algorithms on artificial benchmarks well known for their features interactions. The other paper’s contribution is in the exploitation of redundant features to improve fault detection reliability by reducing false alarm and/or missed alarm. Reliability requires the minimization of undetectability and false alarm probability due to sensor readings, which is not only related with sensor readings but also affected by fault propagation. In engineering practice, sensors may often be faulty, meaning that they may fail to give adequate readings or the sensor may give an alarm for a normal operation state, known as a false alarm. We should therefore allow for some redundancy in sensors in case of failures.A robust strategy to identify faulty sensor readings and to discriminate among sensor failure and system failure has been developed.
The rest of the paper is organized as follows: Section 2 overviews the state of art of feature selection techniques for fault detection systems. The study highlights the importance of the pre-processing phase such as feature extraction and selection to improve the classifier. Section 3 introduces the features’ categorization technique, the proposed criteria and STRASS features selection algorithm that take into account the type of features in a rather finer way than other methods. It is worth noting that the authors’ contribution is not in the filtering algorithm, but rather in the features categorization that has been derived from it to build a reliable fault detection system. In section 4 is devoted to the proposed methodology using feature categorization to design reliable fault detection systems. In Section 5 the proposed algorithm is evaluated and compared with two well-known feature selection algorithms CFS (Correlation Based Feature Selection) [10] and FCBF (Fast Correlation Based Feature Selection) [25] and a feature extraction algorithm the Principal Component Analysis (PCA). CFS and FCBF are considered to be among the best methods for their ability to treat different feature types and consequently provide a finer feature selection based on a minimal subset. Conclusions and recommendation for future work are summarized in Section 6.
2. ASURVEY OF RELATED WORK ON FEATURE
SELECTION
Fault detection methods are generally based on either signal processing or physical models. Data-driven techniques for fault detection and diagnosis have also been extensively used. The following is a brief overview of some recently published papers on feature selection techniques for fault detection.
Whole Set
Weakly Relevant
Predominant
Strongly Relevant Irrelevant
WRr2: Redundant
WRnr: Weakly Relevant and Not Relevant WRr1: Weakly Relevant and Redundant
Optimal Subset
Paljak et al (2009) [31] considered the selection of a compact, but sufficiently characteristic set of control variables which can provide, in a simple way, good parameter estimators for predictive control. Their approach also provides the identification of the operational domain hence facilitating context-aware adaptive control, diagnostic and repair in large Infrastructure Monitoring. They used mRMR (minimum Redundancy Maximum Relevance) feature selection algorithm combined with linear approximation for selecting the few and most significant quantitative aspects of a system for the purpose of supervisory instrumentation. Yang et al (2008) [37] presented a survey on fault diagnosis using Support Vector Machine (SVM) classifiers combined with other methods. For the detection of faults in roller bearing, Jack et al (2002) used Genetic Algorithms to select an optimal feature subset for two SVM and artificial neural network based classifiers. Casimira et al (2006) [6] reviewed various pattern recognition methods for the diagnosis of faults in induction motors’ stator and rotor. A set of 31 features were initially extracted by a time frequency analysis of stator currents and voltages and combined with others features. The most relevant features were selected using a sequential backward algorithm. The experimental results demonstrated the effectiveness of the proposed method to improve the k-nearest neighbours classification rate in condition monitoring. The work by Sugumara et al (2007) [38] focussed particularly on fault conditions in the roller bearing of a rotary machine. They used vibration signals from a piezoelectric transducer in different functional mode (good bearing, bearing with inner race fault, bearing with outer race fault, and inner and outer race fault). First, a set of 11 features were extracted by time frequency analysis. Among these, the 4 best features were selected from a given set of samples using the popular C4.5 decision tree algorithm. Second, Proximal Support Vector Machine (PSVM), was used to efficiently classify the faults using statistical features. Torkolan et al (2004) [23] constructed a driver’s assistance system. This system uses feature selection to identify which sensors are needed for the classification of 12 manoeuvres (changing left, crossing shoulder, on road...). Sensor data like accelerator, brake, speed, etc. were collected from a driving simulator and a total of 138 features were extracted from this data set. The authors used Naïve Bayes and Random Forest classifiers. They combined CFS feature selection algorithm and Random Forest with various measures to calculate new features and evaluate which among the derived features were relevant to this problem in addition to selecting the best sensors. The results indicated that to some extent new sensor hardware can be exchanged with a software version by computing new variables based on existing ones. Feature selection in this case allows controlled collection of data using a desired number and type of sensors.
Among existing feature selection methods applied to fault detection system, earlier methods often evaluate variables without considering feature-feature correlation and interaction. They rank feature according to their individual relevance or discriminative power to the targeted classes and select top-ranked features. These methods are computationally efficient due to linear time complexity in terms of dimensionality. However, (1) they cannot give the feature categorization that we have cited and (2) they cannot remove partially redundant features.
3. FEATURE CATEGORISATION:CONCEPT AND CRITERIA OF RELEVANCE AND REDUNDANCY
3.1. Feature Categorisation Definition 1: Irrelevant
A feature is useful if it is correlated with or predictive of the class; otherwise it is irrelevant [10].
Definition 2: Weakly relevant
A feature xi is weakly relevant to a sample N of instances and distribution D if it is possible to remove a subset of the features so that xi becomes strongly relevant (Blum and Langley [4]).
Definition 3: Strongly relevant
A feature xk is strongly relevant to sample N if there exist examples A and B in N that differ only in their assignment to xk and have different labels (or have different distributions of labels if they appear an N multiple of times). Similarly, xk is strongly relevant to target c and distribution D if there exist examples A and B having non-zero probability over D that differ only in their assignment to xk and satisfy c(A) ≠ c(B) ) (Blum and Langley definition’s [4]).
Definition 4: Redundant
A feature is said to be redundant if several features taken together play the same role as the underlying feature (they discriminate the population studied by the considered feature).
3.2. Criteria of Relevance and Redundancy
Two criteria have been introduced to categorise a whole set of features (Senoussi et al [22]). These criteria were elaborated from the discriminatory power in a pair-wise data representation approach. The categorized features types depend on: predominant (strongly relevant), weakly relevant and redundant ones. These criteria are briefly described below.
3.2.1. Data representation
Giving the input data tabulated as samples. A signature is a vector of r features x called pattern vector denoted by , 1, … , . The functional states are
represented by M classes , 1, … , in an r-dimensional space. Making a decision consists in assigning an incoming input vector to the appropriate class. This decision consists in recognizing the functional state of the system. Let’s associate to a feature xk the function relative to each pairs of instances , , .
, ⟼
, 1 , 1, … ,
0 otherwise 1 The function relative to each pair of instances and their
corresponding labels is obtained in the way. , ⟼
, 1 , 1, … ,
0 otherwise 2 3.2.2. Weak relevance measure
The weakly relevance of a set of feature is defined by the number of all pairs of objects who have at least one discriminating variable and different labels or different distributions of labels.
Proposition 1: The discriminating capacity measure of a feature set DC (L,):
On Ω Ω ⟼ DC , Ω ∑ ∑ ∏ ∙ 3 Given a subset of m features L = (x1… xm); the subset of
feature group relevance is the number of pairs that are discriminate at least with one feature for each class.
3.2.3. Strong relevance to the sample/distribution To measure the exclusiveness of a feature, the equivalent of a "relevance gain" is defined as the measure related to a feature compared to a subset of features and is termed the Discriminating Capacity Gain (DCG).
First we define the relevance of a feature xk compared to a relevant pre-selected features subset L= (x1… xm) on pairs of instances , .
The strong relevance (SR) of feature xk on the data pair , is given by:
On , ⟼ , , , ∙ ∙ ∏ 4 Proposition 2: Discriminating capacity gain: DCG
The aggregation of the Strong Relevance (SR) expression on the whole pairs will define the DCG as:
On Ω Ω ⟼ DCG , , Ω ∑ ∑ ∙ ∙ ∏ (5)
The DCG of a feature xk for a set of objects compared to a set of L features is equal to the number of object couples discriminated by only xk and no other features.
3.2.4. Redundant feature
Let S be the current set of features if
DC , Ω DC , Ω 0 (6) Then xl is a redundant or irrelevant feature compared to the feature subset S on .
3.3. STRASS Algorithm
The criteria are associated with an algorithm related to the greedy type algorithms and noted STRASS (Appendix A). STRASS detects the strongly relevant features, the partially redundant features, selects a minimum feature subset and ranks the features’ relevance. The algorithm breaks up into three stages depending on its initialisation:
(1) Selection of strongly relevant features or predominant features which are impossible to exclude because they are the only ones which allow the discrimination of classes.
(2) Selection of the remaining features or weakly relevant features which have the largest discriminating capacity and when combined with a subset of features, the resulting overall discriminating power is increased. The features having equivalent discriminating capacity are retained as weakly relevant and redundant and are denoted by WRr1 and WRr2.
(3) Suppression of redundant features. At this stage, backward elimination is employed to detect the features that become redundant compared to the subset of the selected features when adding a new feature. STRASS, presented in our previous study [22], has proved to be more efficient when compared to five (5) representative algorithms on artificial benchmarks well known for their features interactions and satisfactory performance for the selection of a minimal set of relevant features and handling the k-way features interaction [11]. Reference list entries should be alphabetized by the last name of the first author of each work.
Figure. 2 The proposed fault detection system 4. FEATURES CATEGORIZATION TO CONSTRUCT A
RELIABLE FAULT DETECTION SYSTEM
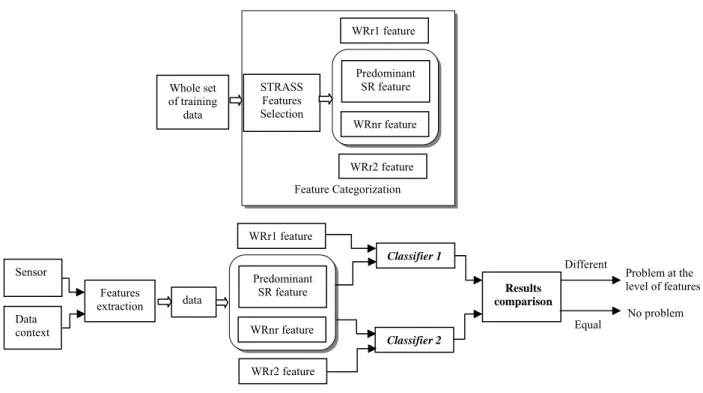
Reliability requires the minimization of undetectability and false alarm probability due to sensor readings or fault propagation. In this study the feature categorization will be used to design reliable fault detection system. Due to their natural discriminating characteristics the selected features can be practical to develop a measure of confidence for the fault detection system show in Fig. 2.
With reference to Fig. 2:
1. Firstly, a fault detection classifier is built using all predominant features (SR), weakly relevant but non-redundant features (WRnr) and weakly relevant features (WRr1).
2. Secondly, redundant features can be used with the predominant and the WRnr ones to build another classifier.
3. In the case of similar results, the second classifier confirms the result obtained with the first one. When the results obtained are different, it is an indication that there is a problem in the acquisition platform (a sensor is defiling) or in the data collection (a parameter is erroneous). The identification of the features is determined by a close examination of the redundant feature, or acquisition of another data.
We should therefore allow for some redundancy in sensors for the predominant measure in case of failures, and the examination of the redundant feature to relay the information. Therefore, missed alarms and false alarms can be detected.
5. EXPERIMENTS AND RESULTS
Our algorithm was implemented in MATLAB 7.5 environment. For the filtering algorithms and classifiers existing tools in WEKA machine learning platform [24] have been used. The experiments were run using WEKA with its default values.
5.1. Feature Selection and Categorization Results The proposed algorithm has been evaluated on datasets from the UCI Machine Learning Repository [39]. Their characteristics are shown in Table 1.
Datasets Instances Features Classes
Heart 270 14 2
Lung cancer 32 57 2
Hepatitis 20 20 2 Machine 12829 22 22
RFM 3519 72 22
Table 1. Summary of dataset STRASS Features Selection Whole set of training data Predominant SR feature WRnr feature WRr1 feature Feature Categorization WRr2 feature Sensor Data context Features extraction data Predominant SR feature WRnr feature WRr2 feature WRr1 feature Classifier 1 Classifier 2 No problem Problem at the level of features Results comparison Different Equal
For the fault detection task Machine, RFM datasets (Appendix B) have been used. This data was originally taken at Texas Instruments as part of the SEMATECH J-88 project. For more information about this data set, please see [2][3].
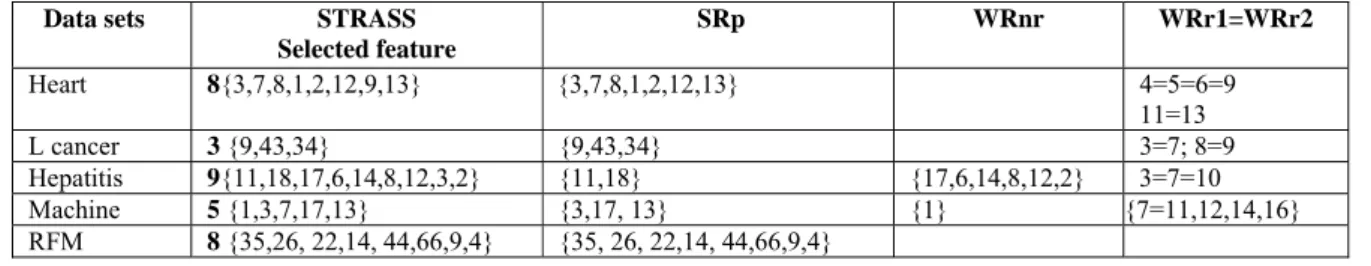
Most existing feature selection algorithms are adapted for discretized (qualitative) data. Therefore for data sets with continuous features, the authors propose to use the MDL (Multi-interval discretization of continuous attributes) discretization algorithm proposed by Fayyad et al [8] also implemented in WEKA environment [24]. Table 2 presents the number of features selected by each features selection algorithm. The proposed algorithm has substantially reduced the number of features necessary to construct a classifier (18% in average in feature space). Table 3 gives STRASS selected features and their categorization. Heart and
Hepatitis have dominant features and redundant ones, thus make it possible to construct a second classifier to detect the same diagnosis and compare the results. For lung cancer and RFM datasets, the selected features are all predominant.
Datasets ALL STRASS CFS FCBF ACP
Heart 13 8 6 5 12 Lcancer 56 3 8 6 25 Hepatitis 19 9 9 6 16 Machine 21 5 10 8 17 RFM 71 8 18 11 12 Average 36 6.6 10.2 7.2 16.4
Table 2. Number of features selected by each features selection algorithm
Data sets STRASS
Selected feature SRp WRnr WRr1=WRr2 Heart 8{3,7,8,1,2,12,9,13} {3,7,8,1,2,12,13} 4=5=6=9 11=13 L cancer 3 {9,43,34} {9,43,34} 3=7; 8=9 Hepatitis 9{11,18,17,6,14,8,12,3,2} {11,18} {17,6,14,8,12,2} 3=7=10 Machine 5 {1,3,7,17,13} {3,17, 13} {1} {7=11,12,14,16} RFM 8 {35,26, 22,14, 44,66,9,4} {35, 26, 22,14, 44,66,9,4}
Table 3. STRASS feature categorization 5.2 Detection Results
For the classification task, three different classifiers have been used decision tree (C4.5), K-nearest-neighbor (IBk), Support Vector Machines (SVM) and multilayer perceptron (MLP). In our experiments, k is set as 1. The classification results are obtained with 10-fold cross-validation. These results are compared with two Correlation-Based Feature Selection algorithms: CFS1 [10] and FCBF2 [25] and the Principal Component Analysis (PCA). TABLES 4-6 show results in both accuracy and kappa obtained with a two tailed test. The symbols “+” and “-” respectively identify significant improvement if an algorithm wins over or loses to the learning algorithm with the whole dataset.
Datasets C4.5 C4.5+ STRASS C4.5+ CFS C4.5+ FCBF C4.5+ ACP heart 83.7 85.18+ 83.3- 84.4 + 81.67- L cancer 78.12 84.35 + 78.21 85.5+ 57.92- hepatitis 81.3 81.3 81.91+ 80.6 - 79.75- machine 94.58 94.72+ 94.81+ 94.70+ 93.22- RFM 94.38 95.34+ 94.07- 94.13- 86.79- Average 86.41 88.17+ 86.4 87.86+ 79.87- Win/Loss 4+/0- 2+/2- 3+/2- 5-/0+
1 CFS with best first search
2 FCBF with the relevance threshold SU set to 0.
Datasets IBk IBk+
STRASS IBk+ CFS IBk+ FCBF IBk+ ACP Heart 83.2 82.5 - 82.5- 81.9 - 80.74- L cancer 75 78.5 + 71.3- 71.8- 65.42- Hepatitis 83.8 85.8+ 77.38- 84.5+ 83.96+ Machine 95.80 95.97+ 93.3- 94.95- 95.3- RFM 94.65 96.06+ 95.84+ 94.67 93.91- Average 86.49 87.76+ 84.06- 85.56- 83.86- Win/Loss 4+/1- 1+/4- 1+/3- 1+/4-
Table 5. IBk Classifier precision with and without filtering
Datasets SVM SVM+ STRASS SVM+ CFS SVM+ FCBF SVM+ ACP heart 84 84.3+ 84.44+ 85.18+ 84.26+ L cancer 65.62 81.25+ 81.25+ 87.5+ 70.00+ Hepatitis 86.45 87.74+ 85.16- 85.80- 83.25- Machine 88.98 61.12- 73.40- 72.60- 78.12- RFM 90.12 94.32+ 89.78- 88.92- 87.45- Average 83.03 81.74- 82.8- 84+ 80.61- Win/Loss 4+/1- 2+/3- 2+/3- 2+/3-
Table 6. SVM Classifier precision with and without filtering
Table 4. C4.5 Classifier precision with and without filtering
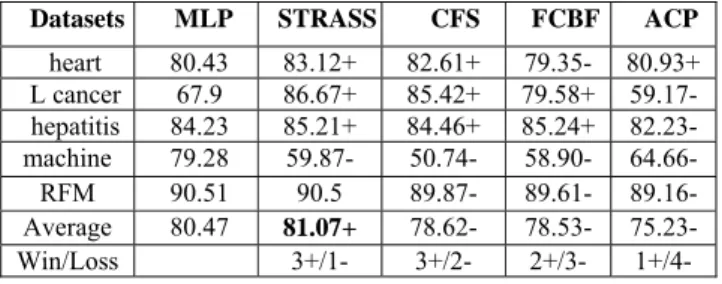
heart 80.43 83.12+ 82.61+ 79.35- 80.93+ L cancer 67.9 86.67+ 85.42+ 79.58+ 59.17- hepatitis 84.23 85.21+ 84.46+ 85.24+ 82.23- machine 79.28 59.87- 50.74- 58.90- 64.66- RFM 90.51 90.5 89.87- 89.61- 89.16- Average 80.47 81.07+ 78.62- 78.53- 75.23- Win/Loss 3+/1- 3+/2- 2+/3- 1+/4-
Table 7. MLP Classifier precision with and without filtering
From these results it can be concluded that STRASS leads to a better performance than CFS, FCBF and ACP classifiers. The combination of C4.5 and STRASS produced the best results. For both classifiers, the reduction of features by STRASS gives results comparable or even superior when using all features: average accuracy 88.17% (STRASS) vs. 86.41% (Full Set) for C4.5, 87.76% (STRASS) vs. 86.49% (Full Set) for IBk and 81.07% (STRASS) vs. 80.47% (Full Set) for MLP. The application on Machine and RFM process demonstrates that this method is very effective for feature selection and classification. 6. CONCLUSION AND FUTURE WORK
In this paper we proposed to use STRASS, a contextual-based feature selection algorithm for fault detection to categorize measures and to determine the interaction between features. This enabled us to detect the redundancy among measures. STRASS was initially evaluated in datasets related to medical diagnosis. The proposed feature selection algorithm was then applied to two well known fault detection benchmarks. STRASS has demonstrated its efficiency and effectiveness in reducing the dimensionality of datasets while maintaining or improving the performances of learning algorithms. The application of this feature categorization on Machine and RFM datasets has demonstrated that this method is very effective for fault detection.
STRASS is based on two criteria of relevance that permit to obtain a useful feature categorization. In fact the algorithm detects the strongly relevant features, the weakly relevant and their corresponding partially redundant feature and selects a minimum feature subset. Moreover the proposed criterion in this study provides a useful ranking incorporating the context of others features and detects the equivalent measures (partially redundant features). Future work will focus on exploiting this features categorization to construct a reliable fault detection system by adding redundant measures for the predominant ones and use the redundant information from the redundant measures to construct an equivalent classifier to relay the information (in the case of same result for both classifier) or to point out a problem in the acquisition platform or in the data collection (in the case classifiers give different results).
Irrelevant Features, Proc. of the Ninth National Conference on Artificial Intelligence, pp. 547-552. (1991).
2. Barry, M. Wise and B. Neal. PARAFAC2 Part III. Application to Fault Detection and Diagnosis in Semiconductor Etch. Gallagher Eigenvector Research, Inc. Manson, WA USA. (1999).
3. Barna, G.G. Procedures for Implementing Sensor-Based Fault Detection and Classification (FDC) for Advanced Process Control (APC), SEMATECH Technical Transfer Document # 97013235A-XFR (1997).
4. A. L. Blum and P. Langley. Selection of relevant features and examples in machine learning, Artificial Intelligence 97(1-2), 1997. pp. 245-271.
5. Casillas, O. Cordón, M.J. del Jesus, F. Herrera. Genetic Feature Selection in a Fuzzy Rule-Based Classification System Learning Process. Information Sciences 136:1-4 135-157 (2001)
6. Casimira, R., E. Boutleuxa, G. Clercb, A. Yahouib. The use of features selection and nearest neighbors rule for faults diagnostic in induction motors. Engineering Applications of Artificial Intelligence 19 169–177 (2006).
7. Dash, M., H. Liu, Hiroshi Motoda. Consistency Based Feature Selection. PAKDD: 98-109 (2000).
8. Fayyad, U. M., K. B. Irani (1993). Multi-Interval Discretization of Continuous-Valued Attributes for Classification Learning. IJCAI: 1022-1029.
9. Guyon, I. and A. Elisseeff, An introduction to variable and feature selection, The Journal of Machine Learning Research, 3:1157-1182 (2003).
10. Hall, M. Correlation-based feature selection of discrete and numeric class machine learning. In Proceedings of the International Conference on Machine Learning, pages 359-366, San Francisco, CA. Morgan Kaufmann Publishers. (2000).
11. Jakulin, A., Ivan Bratko, Testing the significance of attribute interactions, Proceedings of the twenty-first international conference on Machine learning, p.52, July 04-08, Banff, Alberta, Canada. (2004).
12. John, G. H., R. Kohavi, and K. Pfleger. Irrelevant Features and the Subset Selection Problem. Proceedings of the Eleventh International Conference on Machine Learning . New Brunswick, NJ: Morgan Kaufmann, pp. 121-129. (1994).
13. Kohavi, R and G. H. John. Wrappers for feature subset selection. AIJ issue on relevance. (1995).
14. Kira, K. and L. Rendell. The feature selection problem: Traditional methods and a new algorithm. Proceedings
of the Tenth National Conference on Artificial Intelligence (pp. 129{134). Menlo Park: AAAI Press/The MIT Press. (1992).
15. Kira, K., L. A. RENDELL (1992), A Practical Approach to Feature Selection, in Proc. of the Ninth International Workshop, ML, , pp. 249-255.
16. Kononenko, I., S.E. Hong. Attribute selection for modelling, Future Generation Computer Systems, 13, pp 181 – 195. (1997).
17. Langley, P. Selection of relevant features in machine learning, Proc of the AAAI, Fall Symposium on relevance, New Orleans pp 399 – 406. (1994)
18. Lanzi, P.L. Fast Feature Selection With Genetic Algorithms: A Filter Approach. IEEE International Conference on Evolutionary Computation. Indianapolis. Indianapolis 537-540. (1997).
19. Li, W., D. Li, J. Ni. Diagnosis of tapping process using spindle motor current. International Journal of Machine Tools & Manufacture 43 73–79 (2003). 20. Liu, H. et L. Yu. Toward Integrating Feature Selection
Algorithms for Classification and Clustering, IEEE Trans on Knowledge and Data Engineering, VOL. 17, NO. 4. (2005).
21. Pudil, P., J. Navovicova, , J. Kittler, Floating search methods in feature selection. Pattern Recognition Letters 15, 1119–1125. (1994).
22. Senoussi, H. and Chebel-Morello. A New Contextual Based Feature Selection. IEEE International Joint Conference on Neural Networks, IJCNN 2008 and WCCI 2008 (IEEE World Congress on Computational Intelligence).Hong Kong June 1-6. (2008).
23. Torkola, K., S. Venkatesan. and H. Liu. Sensor Selection for Maneuver Classification. IEEE Intelligent TranspOltation Systems Conference Washington, D.C., USA, October 36. (2004)
24. Witten, I. H. and E. Frank, Data Mining—Practical Machine Learning Tools and Techniques with JAVA Implementations", Morgan Kaufmann, San Francisco, CA. (2000).
25. Yu, L.and H. Liu, Efficient Feature Selection via Analysis of Relevance and Redundancy. Journal of Machine Learning Research 5 1205–1224. (2004). 26. Zhao, Z. and H. Liu, Searching for Interacting Features,
IJCAI2007. (2007).
27. Zio, E., P. Baraldi, D. Roverso. An extended classifiability index for feature selection in nuclear transients. Annals of Nuclear Energy. 32 1632–1649. (2005).
28. Sylvain Verron, Teodor Tiplica, Abdessamad Kobi. Fault detection and identification with a new feature selection based on mutual information. Journal of Process Control 18 (2008) 479–490.
29. J. Downs, E. Vogel, Plant-wide industrial process control problem, Computers and Chemical Engineering 17 (3) 245–255. (1993).
30. N. Ricker, Decentralized control of the tennessee eastman challenge process, Journal of Process Control 6 (4) 205–221. (1996).
31. Paljak, I. Kocsis, Z. Egel, D. Toth, and A. Pataricza, Sensor Selection for IT Infrastructure Monitoring, in Third International ICST Conference on Autonomic Computing and Communication Systems, 2009. 32. H. Peng, F. Long, Chris Ding, Feature Selection Based
on Mutual Information: Criteria of Max-Dependency, Max-Relevance, and Min-Redundancy, IEEE Transactions on Pattern Analysis and Machine Intelligence, vol. 27, no. 8, pp 1226-1238, Aug., 2005.
33. Tyan C.,Wang,P.,Bahler,D. An application on intelligent control using neural network and fuzzy logic Neurocomputing 12(4): 345-363 (1996).
34. Widodo A,Yang, B application of nonlinear feature extraction and support vector machines for fault diagnosis of induction motors, Expert system with application, volume 33(1), pp 241-25. (2007).
35. Chebel Morello B., Michaut D, Baptiste P.(2001) A knowledge discovery process for a flexible manufacturing system. Proc. of the 8th IEEE, ETFA'2001, vol 1, pp.652-659, octobre, Antibes, Juan les Pins.
36. Riverol,C.,Carosi, C.. integration of fault diagnosis based on case based reasoning in brewing Sens.&Instrumen. Food Qual2:15-20 Springer.
37. Yang, B and Widodo, A. support Vector Machine for Machine Fault Diagnosis, journal of system design and dynamics vol 2 n°1 pp 12-23 (2008).
38. Sugumaran, V., Muralidharan, V. Ramachandran K.I. Feature selection using Decision Tree and classification through Proximal Support Vector Machine for fault diagnostics of roller bearing. Mechanical Systems and Signal Processing 21 930–942 (2007).
39. UCI Knowledge Discovery in Databases Archive: www.ics.uci.edu/~mlearn/MLRepository.html.
40. L. Chiang, M. Kotanchek, A. Kordon, Fault diagnosis based on fisher discriminant analysis and support vector machines, Computers and Chemical Engineering 28 (8) (2004) 1389–1401.
41. T. Jockenhövel, L. T. Biegler, and A. Wächter, Tennessee Eastman Plant-wide Industrial Process Challenge Problem. Complete Model. Computers and Chemical Engineering., 27, 1513-1531, 2003.
42. Mostafa Noruzi Nashalji, Mahdi Aliyari Shoorehdeli, Mohammad Teshnehlab. Fault Detection of the Tennessee Eastman Process Using Improved PCA and
Neural Classifier. International Journal of Electrical & Computer Sciences IJECS Vol: 9 No: 9. 2009.
43. G. Paljak, I. Kocsis, Z. Egel, D. Toth, and A. Pataricza, Sensor Selection for IT Infrastructure Monitoring, AUTONOMICS 2009, LNICST 23, pp. 130–143, 2010.
Appendix A: Algorithm STRASS
E The whole set of data pairs Ω Ω. , … A set of features to be treated S = Ø Selected features
SRp= Ø Strongly relevant predominant features DCTot = DC (L)
DCmax = 0
WRnr= Ø Weakly relevant and not redundant features WrR1= Ø Weakly relevant and redundant features WRr2= Ø Weakly relevant and redundant features
Table A1 STRASS algorithm pseudo-code 1. Selection of predominant features
for each feature xk of L do scan the examples space E
if DCG (xk, L-xk) ≠ 0 S=S+xk ; L=L-xk; SRp = S;
E = E - {discriminated pairs} 2. Selection of weak relevant features
while DC (S)<DCtot do for each feature xk of L do
scan the examples space E if DC (xk+S)>DCmax DCmax = DC ( {xk}+S) xkmax = xk ; S = S+{xk_max}; L=L-{xk_max } WRnr = WRnr + {xk_max} if DC (xk + S) = DCmax WRr1 = WRr1+{xk_max}
WRr2 = WRr2+{xk} // detection of redundant features E = E - {discriminated pairs}
3. Detection of the partially redundant features for each feature xk of S do
if DC (xk, S - {xk})=0
S = S-{xk}; // suppression of the redundant features WRr2 = WRr2 + {xk}; // detection of redundant features return S, SRp, WRnr, WRr1, WRr2
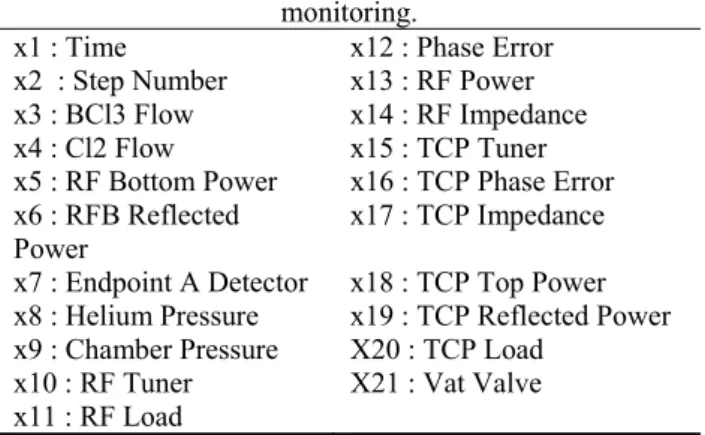
and diagnosis in semiconductor etch [2]. The data comes from the metal etch step in semiconductor processing, specifically the Al-stack etch process. Data was collected on the commercially available Lam 9600 plasma etch tool [3]. The metal etcher was equipped with the machine state sensors, built into the processing tool; it collects machine data during wafer processing. The machine data consists of measured and controlled variables sampled at 1 second intervals during the etch. These are engineering variables, such as gas flow rates, chamber pressure and RF power. These variables are listed in Table B1. The RFM sensors measure the voltage, current and phase relationships at the fundamental frequency of 13.56 MHz and the next four harmonics at four locations in the RF control system. The resulting 70 values are sampled every 3 seconds.
Table B1 Machine state variables used for process monitoring.
x1 : Time x12 : Phase Error x2 : Step Number x13 : RF Power x3 : BCl3 Flow x14 : RF Impedance x4 : Cl2 Flow x15 : TCP Tuner x5 : RF Bottom Power x16 : TCP Phase Error x6 : RFB Reflected
Power
x17 : TCP Impedance x7 : Endpoint A Detector x18 : TCP Top Power x8 : Helium Pressure x19 : TCP Reflected Power x9 : Chamber Pressure X20 : TCP Load
x10 : RF Tuner X21 : Vat Valve x11 : RF Load
Hafida Senoussi received the State Engineering of Electronic degree and the Master these from the University of Sciences and Technology of Oran (Algeria), in 1997 and 2001 respectively. She has been a Lecturer and an Associate Researcher at the Automatic Control and Systems laboratory of Electrotechnic Department, University of Sciences and Technology, Mohamed Boudiaf, Oran (Algeria) from 2002 to 2006. During June-July 2004, she has been a visiting scientist at Automatic Control and Micro -Mechatronic Systems Department of the FEMTO-ST Institute, Besançon (France). At 2006, she obtained a bursary to follow her PHD at the Automatic Control and Micro-Mechatronic Systems Department of the FEMTO-ST Institute, Besançon (France). Since 2009, she is a Lecturer at the University of Sciences and Technology of Oran (Algeria). Her research interests are data selection and decision support system, knowledge data discovery in detection faults system, signal processing.
Engineer Diploma in Electrical Engineering in 1979 from de University of Science and Technology of Algiers and Ecole Nationale Polytechnique d’Alger (Algeria) and his PhD in Automatic Engineering from the University of Lille (France) in 1983. Since 1983, she worked as Associate professor at the Department of Electrical Engineering and at the department of computer Engineering in Institute of technology of Calais University of Lille (France), and came to the university of Besancon (France) and is a researcher at the Automatic Control and Micro-Mechatronic Systems Department of the FEMTO-ST Institute. His current research interests are experience feedback from maintenance process in the enterprise especially focused in three complementary methods: Knowledge capitalization for industrial equipment diagnosis and repair; Knowledge data discovery in detection faults system; Case based reasoning in a decision support system. She is involved in many research and development of industrial projects.
Mouloud Denaï received his Bachelor in Electrical Engineering in 1982 from de University of Science and Technology of Algiers and Ecole Nationale Polytechnique d’Alger (Algeria) and his PhD in Control Engineering from the University of Sheffield (UK) in 1988. He has been with the University of Science and the Technology of Oran (Algeria) from 1988-2004. He worked as Research Associate at the Dept of Automatic Control and Systems Engineering, University of Sheffield (UK) from 2004-2009. Since 2010 he is Senior Lecturer at the Teesside University, UK. His research interests include hybrid (physically-based, data-driven and qualitative) modeling, optimisation and control of life science systems, decision support systems for diagnosis and therapy planning in critical care medicine, data modeling and knowledge elicitation (using neuro-fuzzy, probabilistic reasoning, evolutionary techniques) for medical decision-making. His other research interests include intelligent control design for efficiency optimisation in the field of renewable energies systems, investigation of power electronics interface for renewable energy systems, fault detection and isolation in electric power networks and drives.
Noureddine Zerhouni is a Professor at ENSMM, Besançon, France. He received his MEng from Algiers University, Algeria, and his PhD from Grenoble National Polytechnical Institute (INPG), France. He is also a Researcher at the Automatic Control and Micro-Mechatronic Systems Department of the FEMTO-ST Institute, Besancon (France). His research interests are Petri net applications and AI methods for diagnostic, prognostic and scheduling approaches. He is involved in many research and development projects on prognostic and e-maintenance.