HAL Id: hal-02927123
https://hal.archives-ouvertes.fr/hal-02927123
Submitted on 2 Sep 2020
HAL is a multi-disciplinary open access
archive for the deposit and dissemination of
sci-entific research documents, whether they are
pub-lished or not. The documents may come from
teaching and research institutions in France or
abroad, or from public or private research centers.
L’archive ouverte pluridisciplinaire HAL, est
destinée au dépôt et à la diffusion de documents
scientifiques de niveau recherche, publiés ou non,
émanant des établissements d’enseignement et de
recherche français ou étrangers, des laboratoires
publics ou privés.
Distributed under a Creative Commons Attribution| 4.0 International License
with Low-Pass NGD Function
Blaise Ravelo, Wenceslas Rahajandraibe, Yajian Gan, Fayu Wan, Nour
Murad, Alexandre Douyère
To cite this version:
Blaise Ravelo, Wenceslas Rahajandraibe, Yajian Gan, Fayu Wan, Nour Murad, et al.. Reconstruction
Technique of Distorted Sensor Signals with Low-Pass NGD Function. IEEE Access, IEEE, 2020, 8,
�10.1109/ACCESS.2020.2994630�. �hal-02927123�
Reconstruction Technique of Distorted Sensor
Signals With Low-Pass NGD Function
BLAISE RAVELO1, (Member, IEEE), WENCESLAS RAHAJANDRAIBE 2, (Member, IEEE), YAJIAN GAN2, FAYU WAN 1, (Member, IEEE),
NOUR MOHAMMAD MURAD 3, (Member, IEEE), AND ALEXANDRE DOUYÈRE3, (Member, IEEE)
1Nanjing University of Information Science and Technology (NUIST), Nanjing 210044, China 2IM2NP UMR7334, Aix-Marseille University, CNRS, University of Toulon, 13007 Marseille, France 3LE2P Laboratory, Institut Universitaire de Technologie, University of La Reunion, Saint Denis 97715, France Corresponding author: Wenceslas Rahajandraibe ([email protected])
This work was supported in part by the NSFC under Grant 61971230 and Grant 61601233, in part by the Jiangsu Distinguished Professor Program and Six Major Talents Summit of Jiangsu Province under Grant 2019-DZXX-022, in part by the Postgraduate Research and Practice Innovation Program of Jiangsu Province under Grant SJKY19_0974, and in part by the Priority Academic Program Development of Jiangsu Higher Education Institutions (PAPD) fund.
ABSTRACT This paper develops a new reconstruction technique of undesirable signal distortion generated by sensor electronic circuits. The introduced reconstruction technique is originally realized with unfamiliar low-pass negative group delay (NGD) function. The feasibility condition of the proposed reconstruction technique in function of the sensor signal spectrum bandwidth under consideration is elaborated. The reconstruction technique principle is theoretically introduced by means of identification of low-pass NGD function parameters and the appropriated circuit topology. The unfamiliar low-pass NGD function analysis and synthesis equations are established. As an example, for the feasibility study, an RC-network based low-pass active cell is considered to implement the low-pass NGD function. A design method of NGD circuit in function of the sensor distortion transfer function is described in different successive steps. The developed NGD reconstruction technique is validated by different proofs of concept. First, transient simulations are carried out with Gaussian and sinc analytical signals. Then, experimental feasibility study is also performed with arbitrary waveform signal. As expected, the NGD reconstruction technique efficiency is confirmed with improvement of distorted signal integrity parameters and cross correlation better than 97%.
INDEX TERMS Signal processing engineering, low-pass NGD function, sensor signal integrity, circuit modelling, signal distortion, reconstruction technique.
I. INTRODUCTION
In twenty first century, behind the industrial and medical engineering revolutions, new generation of smart sensors is deployed [1]–[5]. These new generation sensors enable to realize outstanding functions based on the detection of dif-ferent types of physical parameters. For example, advanced measurement techniques must be developed to characterize this new generation of smart sensors [6], [7]. The measure-ment techniques are usually expensive and they may require a significant amount time of experimental setup preparation. Therefore, alternative methods are needed to guarantee the
The associate editor coordinating the review of this manuscript and approving it for publication was Wei Wang .
authentication of sensored data [8]. Development of signal processing methods [1], [2] can be one of efficient solutions enabling to improve the signal fidelity [9].
More generally, to assess the sensor performance, the estimation of sensor signal distortions become a key point for designers with confirmation of signal fidelity preserva-tion [10]–[14]. Moreover, the distorpreserva-tion effect can manifest at different stages of sensor readout circuits [13], [14]. The fundamental limits of analog to digital compression circuits are reported in [13]. Therefore, improvement methods were proposed to filter [15], to cancel out [16], to suppress [17] or, at least, to minimize the sensor signal distortions [18], [19]. Some of distortion effect analyses and suppressions are using more complicated software approaches with algorithmic [20]
FIGURE 1. (a) NGD system black box and (b) typical transient response of NGD system [28]–[32].
and deep learning functions [21], [22]. Advanced design with deep learning-based health electronic wearable sensors is introduced in [22]. Despite the progress of these techniques of distortion cancellation, more efficient and simpler meth-ods allowing to avoid the circuit modelling [23], [24] based method can be developed.
To solve the issues related to the sensor signal integrity (SI), an original technique of degraded signal reconstruc-tion by using low-pass negative group delay (NGD) funcreconstruc-tion can be a potential future candidate. The feasibility of NGD function-based reconstruction technique of distorted signal can be experimented with different types of equivalent cir-cuit model-based degradations as introduced in [25]–[27]. The feasibility of the distorted signal NGD reconstruction technique is initiated in the present paper. The proposed technique was initially dedicated to RF and microwave signal integrity [25]–[27]. Before the detailed elaboration of this innovative technique, it is worth to review briefly the state of the art on the NGD function.
Since 1990s, the NGD function was theoretically and experimented with electronic circuits [28], [29]. This NGD phenomenon can be explained [28]–[32] with its time domain signature noticed by output signal leading and trailing edges propagating in time advance compared to its own input, as illustrated in Figs. 1. By considering an NGD system denoted N (s) (with s the Laplace variable) presented in Fig. 1(a), the input and output signals (denoted vinand vout) can behave as shown in Fig. 1(b) [28]–[32].
Despite this counterintuitive aspect, the NGD phenomenon does not contradict the causality principle [28], [29]. The intrinsic limitation of the time-advance in function of NGD circuit parameters is pointed out in [33]. An analogy between the linear filter and NGD function was empha-sized [34]. A canonical form of low-pass NGD function was stated [35]. The feasibility of low-pass NGD func-tion in multiscale time range was demonstrated [36]. The NGD function can be intended to correct the degradation affecting the sensor signals by improving the time param-eters as noticed in [37]. In other words, the distorted sen-sor signals can be reconstructed by exploiting the NGD functions.
In order to answer to constantly asked open questions from electronic, embedded system, industrial sensor and commu-nication system design engineers about the usefulness and applications of low-pass NGD function for the sensor circuit design, the present paper develops an easy to understand and potentially useful application of low-pass NGD function for arbitrary signal distortion correction technique. To illustrate the feasibility of this innovative idea, the present paper is organized in four main sections describes as follows:
• Section II describes a theoretical part which points out
the following technical originalities about a particular low-pass NGD applications:
◦ The general principle of the developed reconstruc-tion technique in funcreconstruc-tion of the arbitrary waveform signal generated.
◦ The synoptic representation of sensed signal susceptible to be victim of undesirable signal distortion.
◦ The specifications of sensor distortion response as a two-port block system.
◦ The description of the operating signal bandwidth which allows to choose the low-pass NGD function suitable to the sensor under consideration.
◦ And the pedagogical definition of equivalent model of the distortion as a transfer function (TF) model will be introduced.
• Section III is focused on the application of low-pass (LP)
NGD circuit for realizing the outstanding distortion cor-rection. The NGD application theory is developed by the identification of appropriated low-pass NGD TF. Doing this, analytical equations dedicated to the determination of the NGD function parameters are formulated.
• Section IV is focused on the introduced sensed sig-nal reconstruction technique validation. First, simula-tions illustrating the feasibility of the signal distortion reconstruction with deterministic signals are performed. Then, more practical proof-of-concept (POC) based on mechanical motion sensored arbitrary waveform signal will be discussed based realistic experimentations.
• Section V is the final conclusion.
II. ANALYTICAL DESCRIPTION OF THE DISTORTED SIGNAL RECONSTRUCTION TECHNIQUE
The present section introduces the general principle of the developed reconstruction technique of distortion signal. Functional diagram of the equivalent system representing the generated signal will be defined. Then, the basic mechanism of the reconstruction principle will be introduced under con-sideration of the equivalent TFs.
A. FUNCTIONAL DIAGRAM OF THE RECONSTRUCTION PRINCIPLE
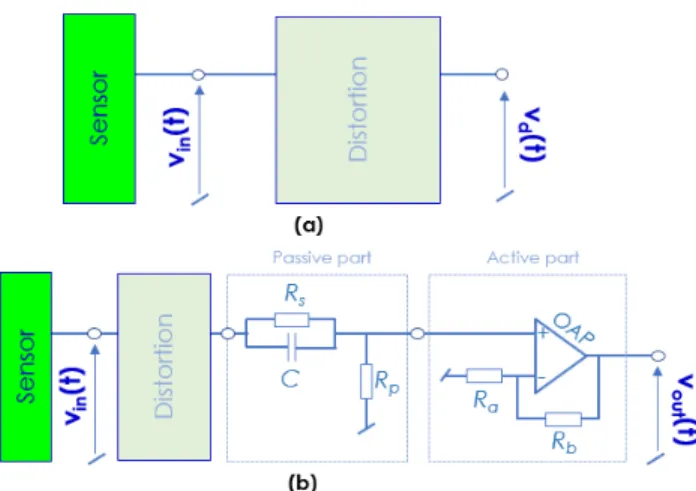
Figs. 2 illustrate the synoptic of the equivalent diagram of generated sensored signal and also the global implementation of reconstruction technique developed in the present paper.
FIGURE 2. (a) Classical and (b) reconstructed sensor signal monitoring synoptic diagram.
FIGURE 3. (a) Classical and (b) reconstructed sensor signal monitoring synoptic diagram.
This general diagram is essentially composed of the signal generator including also the monitoring block. The readout circuit is considered in order to avoid the plot mismatching between the raw signal delivered from the sensor and the monitoring. In Fig. 2(a), the input signal is generated from the sensor which integrates the readout circuit. To realize the reconstruction effect, the solution is depicted in Fig. 2(b). The NGD low-pass function must be inserted between the readout circuit and the monitoring.
B. FEASIBILITY PRINCIPLE OF THE NGD BASED RECONSTRUCTION TECHNIQUE
Figs. 3 highlight the chains of different blocks of the circuit constituting the improved sensor. Then, the behaviors of arbitrary waveform distorted and reconstructed signals are plotted graphically as the main goal of the proposed NGD signal restitution technique.
Similar to all signal processing techniques, the feasibility of the developed one depends on certain golden rules. Among these rules, we must define the following hypothetical speci-fications:
• vinthe initial input signal delivered by the sensor, must
be defined as a base band signal with maximal ampli-tude Vmax and limited frequency band with maximal frequency:
f ≤ fmax (1)
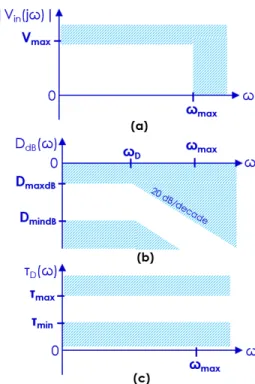
FIGURE 4. Specifications: (a) input signal amplitude, (b) distortion magnitude and (c) group delay.
• vd the degraded signal due to the sensor connector and
interface imperfection is literally uncorrelated compared to the main input signal:
Vd(s) 6= Vin(s) (2) • And vout the clear integrity improvement of
recon-structed signal thanks to the use of low-pass NGD func-tion after the introducfunc-tion of the technique is analytically formulated by:
Vout(s) ≈ Vin(s). (3)
C. CONSIDERED SYSTEM MODEL OF THE UNDESIRABLE DISTORTION
The analytical investigation of the undesirable distortion can be efficiently realized with a suitable analytical modelling. The present subsection is focused on the analytical character-ization of the distortion.
1) TF MODELLING OF DISTORTION
Along the paper, let us denote the angular frequency complex variable s = jω. Then, the magnitude of the input signal can be denoted by |Vin(jω)| with maximum angular fre-quencyωmax. The spectrum specification can be represented
as shown in Fig. 4(a). The transfer function (TF) model of the undesirable distortion effect is defined in function of input signal Vinand sensored signals Vdassigned under distortion by:
D(s) = Vd(s)
Vin(s)
The associated magnitude is given by:
DdB(ω) = 20 log |D(jω)| . (5)
2) SPECIFICATION PARAMETERS OF DISTORTION
The specifications of the distortion effect can be formulated by the TF magnitude. The model of this TF magnitude can be represented as indicated in Fig. 4(b) under the parameters:
• minimal value, DmindB, • maximal value, DmaxdB,
• and cut-off angular frequency,ωD.
In other words, the distortion effect corresponds to typ-ical passive system responses. The considered TF group delay (GD) is defined by the following expression:
τD(ω) = − ∂ϕD(ω)
∂ω (6)
with the phase angle is written as:
ϕD(ω) = arg [D(jω)] . (7) The distortion circuit model delay specification is illustrated as indicated in Fig. 4(c) with minimal value,τminand maximal value,τmax.
III. IDENTIFICATION OF THE ADEQUATE TRANSFER FUNCTION (TF) DEDICATED TO RECONSTRUCT THE DISTORTED SENSOR SIGNAL
Before the elaboration of the reconstruction technique, it is important to identify the adequate electronic circuit capable to cancel out the distortion. Based on the TF system approach, the present section is dedicated to the analytical investigation and specification of the reconstruction technique.
A. TF OF THE UNDESIRABLE DISTORTION SYSTEM In practical cases, the undesirable signal distortions maybe due to undesirable effect as connectors or sensor-readout circuit interfaces. Doing this, it would be more pragmatic to proceed with TF equivalent model.
1) TF MODEL OF DISTORTION
For the better understanding of the proposed technique, we suppose that the distortion represented as signal integrity problem can be formulated by the first order TF:
D(s) = D0 1 +τds
(8) with D0and 0< τmin≤τd ≤τmaxare positive real variable
parameters. The different frequency responses of this TF can be analyzed in order to characterize the distortion.
2) RESPONSE OF DISTORTION TF MAGNITUDE
Based on the transmittance D(jω), we can define the magni-tude, D(ω) = |D(jω)| associated to the distortion TF. This magnitude induced from equation (8) can be expressed as:
D(ω) = p D0 1 + (τdω)2
. (9)
It is noteworthy that at very low frequenciesω ≈ 0, this magnitude becomes:
D(ω ≈ 0) = D0. (10)
3) RESPONSE OF DISTORTION TF PHASE
As defined in equation (7), we can define the transmission phase denoted,ϕD(ω) = arg [D(jω)] associated to the distor-tion TF. By considering the distordistor-tion analytical model given previously in equation (8), the phase response can be written as:
ϕD(ω) = arctan(τdω). (11) This phase response serves to determine a less familiar response denoted group delay (GD) as defined in the follow-ing paragraph.
4) RESPONSES OF DISTORTION TF GROUP DELAY (GD) Mostly, the frequency domain characterization of sensors are based only on the magnitude and phase responses as introduced in equations (10) and (11). However, the sensor design engineers are less familiar to the GD responses. For this reason, the present study will elaborate this parameter in order to perform the distortion effect correction. Knowing the phase response of equation (11), we can derive from this last equation that the GD expressed in equation (6) becomes:
τD(ω) = τ d
1 +τd2ω2. (12)
B. ANALYTICAL DETERMINATION OF THE RECONSTRUCTOR SYSTEM IN FUNCTION OF THE DISTORTION RESPONSE
The present subsection is focused on the determination of the appropriated TF allowing the reconstruction. Doing this, analytical description is introduced in the following two para-graphs.
1) NGD ANALYTICAL MECHANISM OF THE RECONSTRUCTOR TF DETERMINATION
By considering the functional diagram of Fig. 3(a), we can formulate the NGD system TF by:
N(s) = Vout(s)
Vd(s)
. (13)
In other words, the total TF derived from equation (3) is analytically formulated by:
Vout(s) Vin(s) ≈1 ⇔ Vout(s) Vd(s) × Vd(s) Vin(s) ≈1. (14) It means that the proposed signal reconstruction principle can be reformulated by:
N(s) × D(s) ≈ 1. (15) This linear TF is unconditionally unstable. Therefore, more rigorous analysis is needed to synthesize a realistic solution.
C. CANONICAL FORM OF THE RECONSTRUCTOR SYSTEM TF
The TF of the system necessary for the reconstruction can be linear system given by:
N(s) ≈ N0 1 + m P 1 aksk 1 + m P 1 bksk (16)
with N0, ak and bk are real coefficients of numerator and denominator polynomials with degree m. Substituting (8) and (16) into (15), we have:
N(s)D(s) ≈ 1 ⇒ N0 m P 0 aksk m P 0 bksk × D0 1 +τds ≈1. (17)
The McLaurin first order limited expansion of TF given in equation (16) implies: N(s)D(s) ≈ N0D0 h 1 +ζ1s +ζ2s2+. . . i (18) with: ( ζ1= a1− b1−τd ζ2=(b1− a1)(b1+τd) +τd2+ a2− b2 (19) The mathematical identification allowing to satisfy equality equation (17) enables to specify one of N (s) TF solution coefficients: N0= 1 D0 a1− b1≈τd b1≈ a2− b2 τd . (20)
The topological implementation of the associated NGD cir-cuit theory will be explored in the next section.
IV. TOPOLOGICAL DESCRIPTION OF THE DISTORTED SENSORED SIGNAL RECONSTRUCTION BY USING LOW-PASS NGD FUNCTION
The present section expressed the NGD analysis of the adopted circuit topology allowing to realize the sensor signal reconstruction.
A. TOPOLOGICAL DESCRIPTION
After the circuit introduction, the NGD analysis of the active topology chosen to implement the TF N (s) will be investi-gated in the following paragraph.
1) CIRCUIT CONFIGURATION
Fig. 5 represents the reconstruction circuit considered in the present study. It is composed of cascaded linear passive and active parts. The passive part is L-shape cell with RsC-parallel
network mounted in series and a shunt Rpresistor. The active
FIGURE 5. Diagram of (a) distorted and (a) reconstructed sensor with NGD circuit topology.
cell is simply a non-inverting amplifier with an ideal opera-tional amplifier (OAP) associated to two ground connected resistor Raand a feedback resistor Rb.
2) SUGGESTED LOW-PASS NGD FUNCTION
By hypothesis, we suppose that the operational amplifier constituting the LP NGD topology of Fig. 5(b) is ideal defined with infinite gain. According to circuit theory, we can demon-strate that the TF of this NGD topology can be expressed as:
N(s) =N0(1 + a1s) 1 + b1s (21) with: N0 = Rp(Ra+ Rb) Ra(Rs+ Rp) (22) a1 = RsC (23) b1 = RsRpC Rs+ Rp . (24)
B. FREQUENCY RESPONSES OF THE ADEQUATE NGD FUNCTION
The frequency responses of the TF expressed previously will be analyzed in the next paragraphs. The analysis concerns the magnitude, phase and GD.
1) RESPONSE OF THE NGD TF MAGNITUDE
Let us denote N (ω) = |N(jω)|, the magnitude associated to the TF given in (21). This magnitude can be expressed as:
N(ω) N0 = s 1 + (a1ω)2 1 + (b1ω)2. (25) At very low frequenciesω ≈ 0, this magnitude is simplified as:
2) PHASE RESPONSE OF THE CONSIDERED NGD SYSTEM TF The transmission phase associated to the TF given in (21) is defined by:
ϕN(ω) = arg [N(jω)] = ϕa(ω) − ϕb(ω) (27) where:
ϕa(ω) = arctan(a1ω) (28)
ϕb(ω) = arctan(b1ω). (29)
3) GD RESPONSE OF THE CONSIDERED NGD SYSTEM TF To realize our innovative distortion effect correction, we con-sider innovatively the GD parameters in the operation band-width of the sensored signal. Knowing the phase response given in equation (27), the GD of the considered NGD system TF is defined by:
τN(ω) = −∂ϕN (ω)
∂ω . (30)
For the sake of analytical simplification, this GD can be rewritten explicitly: τN(ω) = τb(ω) − τa(ω) (31) where: τa(ω) = ∂ϕa (ω) ∂ω = a1 1 + a21ω2 (32) τb(ω) = ∂ϕb (ω) ∂ω = b1 1 + b21ω2. (33) C. NGD ANALYSIS
The NGD analysis consists in identifying the frequency band where the following NGD condition is satisfied:
τN(ω) < 0. (34) To preserve the SI, the NGD analysis must be associated to the TF magnitude at the NGD particular frequencies. 1) ANALYSIS AT VERY LOW FREQUENCIES
It can be demonstrated that at very low frequencies, the GD expressed in equation (30) becomes:
τN(ω ≈ 0) = b1− a1. (35)
Substituting the N(s) TF coefficients expressed in equa-tion (23) and equation (24) into equation (34), we have the relation:
τN(ω ≈ 0) = −R2sC Rs+ Rp
. (36)
We can underline that this GD is always negative with any RC parameters of the topology introduced in Fig. 5. It explains that the proposed topology behaves as a low-pass NGD function.
2) NGD CUT-OFF FREQUENCY
By definition, the NGD cut-off frequenciesωcare constituted by the roots of the equation:
τ(ω) = 0. (37)
For the case of low-pass NGD function, the NGD bandwidth is also the NGD cut-off frequency:
1ω = ωc= 1 RsC s Rs+ Rp Rp . (38)
D. DESIGN EQUATION OF THE NGD PARAMETERS IN FUNCTION OF THE DISTORTION SYSTEM
The design equation of the NGD circuit can be deduced from equation system (20). The synthesis equations are established knowing the degradation TF parameters D0 andτd > 0. As matter of fact, by fixing Rsand Rp, we can take:
C = τd(Rs+ Rp) R2 s (39) Rpτd2 Rs ≈0 ⇒ Rs Rp. (40) As the passive part output can be attenuated, the corrected signal amplification can be matched with:
(
Ra= Rp
Rb= Rs.
(41)
E. DESIGN PEDAGOGY OF LOW-PASS NGD CIRCUIT IN FUNCTION OF THE SENSOR DISTORTION SPECIFICATIONS To summarize the introduced NGD correction method, the non-specialist sensor design engineers can follow pedagogi-cally these successive steps:
• Step 1: The definitions of sensor signal amplitude vmax
and bandwidth from 0 to its maximal frequency fmax. • Step 2: The identification of the sensor distortion as
linear time invariant (LTI) TF as the present case of study, D(s), expressed in (8). If it acts as a first order system, the parameter,τd, must be determined.
• Step 3: The identification of low-pass NGD TF defined
in (21) can be realized in this step. Behind the transfer function, we can suggest to use the low-pass NGD topol-ogy shown in Fig. 5(b) by calculating its appropriated RC parameters via equations (39-41).
• Step 4: The simulation of ideal circuit by using the
sensor generating the distorted signal and the NGD parameters calculated in the previous step.
• Step 5: It would be important to characterized the NGD
circuit in both the frequency and time domain in order to verify the frequency mismatch with respect to the sensed signal bandwidth fmaxwhich is identified in Step 1. • Step 6: The choice of realistic components constituting
the low-pass NGD corrector. Slight optimization can be performed in this step because of probable parasitic effects affecting the arbitrary waveform signal generated by the sensor.
FIGURE 6. Design of POC including the distortion RdCd-circuit connected with the NGD circuit.
• Step 7: After a test board verification with the realistic
components chosen in the previous step, the low-pass NGD PCB can be fabricated in this step.
• Step 8: To completely validate the distorted signal
cor-rection, a final test with the NGD prototyped in the previous step can be realized.
To confirm the effectiveness of the developed theory, com-parison between the established model, simulation and exper-imental investigations will be discussed in the next section.
V. PROTOTYPING, SIMULATION AND EXPERIMENTAL VALIDATIONS
To verify the feasibility of the reconstruction technique of distortion signals, the present section introduces the valida-tion results with proofs of concept (POC). The simulavalida-tion results explored in this paper are generated in in the environ-ment of electronic and RF circuit simulator commercial tool ADS R from Keysight Technologies R. The PCB prototype was designed and fabricated. Then, comparisons between the simulated and experimented results will be examined in the next subsections.
A. SIMULATION INVESTIGATION
NGD Frequency and time domain simulations have been per-formed to demonstrate the feasibility of the proposed NGD reconstruction technique. Different types of test signal will be considered for the transient analysis.
1) DESCRIPTION OF THE POC ON THE DISORTED SIGNAL RECONSTRUCTION
The schematic of the POC circuit design is displayed in Fig. 6. The input signal (‘‘In’’) is analytically generated from user defined voltage source. The distorted signal (‘‘D’’) is the response of RdCd circuit. The distorted model RdCd-circuit
is connected to the NGD one.
This electrical connection is realized through a matching follower circuit implemented with an operational amplifier defined by its gain and bandwidth. The general output of the overall circuit represents the reconstructed (‘‘Rec.’’) signal.
The adopted parameters of the overall circuit constituting component values are given in Table 1. The comparisons between calculated and simulated results will be examined in the next subsection.
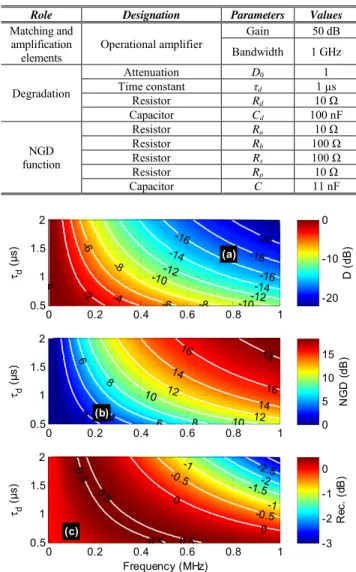
TABLE 1.Parameters of NGD circuit proof of concept with RC-parasitic network.
FIGURE 7. Cartographies of (a) distorted (‘‘D’’), (b) NGD and (c) reconstructed (‘‘Rec.’’) calculated TF magnitudes versusτd and
frequency.
2) PARAMETRIC FREQUENCY ANALYSES VERSUS DISTORTION PARAMETERS
The present parametric frequency analysis is performed from 0 Hz to 1 MHz with 401 frequency samplings. The distortion circuit model TF, NGD and reconstructed models are calculated with the Matlab program via equations (8), (21) and both multiplied, respectively.
Parametric analyses with respect to the distortion variation of parameterτd from 0.5µs to 2.5 µs were realized via the calculated TF. The NGD circuit parameters were determined from synthesis formulas established in equations (39), (40) and (41).
Obviously, the attenuation is stronger with more significant value ofτd at higher frequencies. The range of magnitude dynamics of distorted TF attenuation and the reconstructed TF one can be compared from Fig. 7(a) and Fig. 7(c).
The calculated numerical results of TF magnitudes are represented by the cartographies of Figs. 7. Emphatically, the
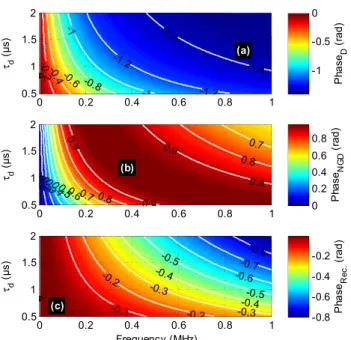
FIGURE 8. Cartographies of (a) distorted (‘‘D’’), (b) NGD and
(c) reconstructed (‘‘Rec.’’) calculated TF phases versusτdand frequency.
strong attenuation up to 20 dB in the considered frequency band is reduced to only 3 dB thanks to the NGD circuit TF shown in Fig. 7(b). The associated TF phase cartographies are displayed in Figs. 8. The reconstruction effect in the frequency domain is less rigorous to interpret from this TF phase.
However, we can understand from the cartographies of distorted, NGD and reconstructed TF GDs depicted in Figs. 9, the effectiveness of the NGD reconstruction. It can be pointed out that the GD fluctuation is stronger at low frequencies with higher value of parameterτd. Fig. 9(b) highlights the behavior of LP NGD responses corresponding to very low frequency GD defined by GDNGD(0) and NGD cut-off frequency fn plot-ted in Figs. 10. Moreover, the GD variation by comparison of Fig. 9(a) and Fig. 9(c) is decreased of about ten times smaller thanks to the NGD GD cartography shown in Fig. 9(b). 3) COMPARISONS BETWEEN THE CALCULATED AND SIMULATION FREQUENCY DOMAIN RESULTS
To confirm in more concrete way, the relevance of our distortion cancellation technique, comparisons between the frequency domain investigations denoted Matlab calculated (referenced by subscript ‘‘c’’) and simulated (referenced by subscript ‘‘s’’) responses of our POC circuits have been per-formed. Doing this, TF magnitude, phase and GD of circuit shown in Fig. 6 are analyzed. The present comparative study was carried out in the same frequency band as in the previ-ous subsection from 0 to 1 MHz. This choice of frequency band is justified for applications as many cases of acoustic sensors [38], [39].
As results of this POC numerical analysis, we have the magnitude, phase and GD responses displayed in Figs. 11. The calculated and simulated results plotted in solid and
dot-FIGURE 9. Cartographies of (a) distorted (‘‘D’’), (b) NGD and (c) reconstructed (‘‘Rec.’’) calculated TF GDs versusτdand frequency.
FIGURE 10. (a) GD value and (b) NGD cut-off frequency corresponding to the NGD TF GD cartography shown in Fig. 7.
ted curves, respectively are in excellent agreement. As shown in Fig. 11(a), the reconstructed system magnitude repre-sented by ‘‘Rec.’’ response is closed to unity compared to the undesirable distorted (‘‘D’’) one. Thanks to the determined and appropriated LP NGD responses represented by curves ‘‘NGD’’, the GD response of ‘‘Rec’’ curve is very close to the distortion system which can rise up to 1 s at very low frequency. To highlight more explicitly the effectiveness of distorted signal reconstruction, time-domain analysis will be discussed in the next subsection.
4) TIME DOMAIN RESULTS
The time domain analyses presented in this paragraph is based on the consideration of transient signals generated from analytical equations. The graphical time window is delimited
FIGURE 11. Comparison of simulated and calculated TF (a) magnitudes, (b) phases and (c) GDs of the reconstructed circuit POC shown in Fig. 6.
FIGURE 12. Cartographies of (a) distorted (‘‘D’’), (b) NGD and (c) reconstructed (‘‘Rec.’’) calculated TF GDs versusτd and frequency.
arbitrarily and chosen as equal to 10µs as the cases of many sensor signals such as audio and acoustic sensor applications. The sampling time was lower than 10 ns.
In mirror to the previous frequency domain analyses, an overview on the degraded and reconstructed signals with
FIGURE 13. Comparison of cross correlations between the distorted (‘‘black solid line’’) vs reconstructed (‘‘red dashed line’’) and sensored signals.
different values of parameterτd has been realized. Accord-ingly, pulse signals with delimited bandwidth constitutes a most convenient transient signal to demonstrate the LP NGD signature. The deterministic Gaussian pulse considered in Fig. 12(a) is defined by the following equation:
vin(t) = Vmaxexp " −(t −τ0)2 τ2 1 # (42) with amplitude Vmax = 1 V and parameters (τ0 = 3.3 µs,
τ1=1µs). Fig. 12(b) and Fig. 12(c) highlight the
compara-tive mapping of distorted (‘‘D’’) and reconstructed (‘‘Rec.’’) signal transient responses. comparison.
As shown in Fig. 12(b), the Gaussian pulse signal is com-pletely distorted because of the degradation especially for higher values ofτd. Thanks to the NGD function, a promis-ing reconstruction of the distorted signal is realized in the cartography of Fig. 12(c). To quantify the effectiveness of the sensored signal reconstruction, the cross correlations (‘‘x corr.’’) between (vin, vDeg.) and (vin, vRec.) are plotted in Fig. 13. It is clear that the cross correlation varying between around 0.5 to 0.9 of the distorted Gaussian signals is widely improved to about 0.95.
To be imaginable for sensor signals, the NGD recon-struction technique is applied to different waveform signals. For this reason, the comparisons of time domain responses of Gaussian, sinc and arbitrary waveform pulse signals of Figs. 14 have been generated. Once again, the calculated (subscripted ‘‘c’’ solid curves) and simulated (subscripted ‘‘s’’ dotted curves) transient responses are in excellent agreement.
It is noteworthy that notable improvement of signal integrity can be underlined for these three cases of study of transient pulse signals. The effectiveness of the recon-struction is quantified by the cross correlations indicated in Table 2. Despite this virtual validation, one may wonder about the feasibility of the NGD reconstruction technique in more practical case of realistic sensor environment. The following subsection is focused on a practical sensoring case of study. B. EXPERIMENTAL VALIDATION OF THE DEVELOPED NGD BASED SENSORED SIGNAL DISTORTED RECONSTRUCTION TECHNIQUE
For further validation of the previous simulations, experimen-tal proof-of-concept of the distorted sensor signal technique
FIGURE 14. Comparison of simulated and calculated transient responses form the NGD reconstructed circuit shown in Fig. 6: (a) Gaussian, (b) sinc and (b) arbitrary waveform pulse signals.
TABLE 2. Cross correlation between the distorted/input and reconstructed/input signals of Fig. 14.
using low-pass NGD function was carried out. The next subsections describe the obtained results.
1) EXPERIMENTAL SETUP DESCRIPTION
Fig. 15(a) illustrate the considered experimental setup. The sensor is represented by a circular potentiometer allowing to convert a real-time motion of an angular rotation valueθ(t) into transient variable voltage vin(t).
It should be underlined that the overall test circuit was implemented on a breadboard with discrete components. The overall circuit size was of about 5 cm × 10 cm. The connections between the test circuit board and the measure-ment equipemeasure-ment’s have been carried out with classical BNC cables.
As illustrated in Fig. 15(b), the potentiometer is mounted in a voltage divider including series resistive network consti-tuted by R0and R as a readout conditioning circuit. Table 3
summarizes the specifications and values of components
TABLE 3.Parameters of NGD circuit proof of concept with RC-parasitic network.
used during the tests. Before the exploration of transient results, it is important to analyze briefly the frequency domain responses.
2) FREQUENCY DOMAIN ANALYSES
The present frequency domain analysis is performed from 0 Hz to 10 Hz with 401 frequency samplings. The choice of the proposed frequency range is targeted to the mechanical sensor application cases as the accelerometers described in [40], [41].
The comparisons between the calculated (solid curves) and simulated (dotted curves) frequency domain results are presented in Figs. 16.
This degradation is corrected with the NGD function an almost perfectly flat corrected magnitude of degraded and NGD TF combined. The magnitude of degradation TF is decreasing until −17 dB at 10 Hz as illustrated in Fig. 16(a). Once more, it can be seen that the reconstructed NGD sen-sor response magnitude is widely flattened around 0 dB compared to the distorted circuit response. In addition, the associated GD response is also improved to be near zero thanks to NGD response with minimal frequency value equal to −0.2 seconds. The NGD cut-off frequency is of about 2.39 Hz. In addition to the magnitude improvement, a con-siderable reduction of GD is also realized as shown in Fig. 16(c).
3) TIME-DOMAIN EXPERIMENTAL RESULTS
The present time domain analysis is carried out by consid-ering the experimental results from raw data of voltages,
vin(t), vDeg.(t) and vRec.(t). Figs. 17 show the comparisons of distorted and reconstructed signals with the reference signal corresponding to the time dependent value of rotating angle, θ(t). We emphasize that the time range of the plot window displayed for this time-domain analysis was chosen according to the data size which can be recorded with the oscilloscope available in our laboratory.
Two cases of input signals are tested with the NGD reconstruction techniques. An interesting signal integrity improvement can be pointed out from Figs. 17 with these
FIGURE 15. Illustration of (a) experimental setup and (b) sensor conditioning circuit.
FIGURE 16. Comparison of simulated and calculated (a) magnitudes, (b) phases and (c) GDs.
TABLE 4. Cross correlation between the distorted/input and reconstructed/input signals of Figs. 17.
cases of arbitrary waveform sensored signals. The test case result shown in Fig. 17(a) (resp. 17(b)) was generated
FIGURE 17. Comparison of distorted and reconstructed measured transient signals form the experimental setup shown in Fig. 15 with: (a) 2 s and (b) 5 s time durations.
with 2 seconds (resp. 5 seconds) time duration. Thanks to the LP NGD function shown in Figs. 16, a very good reconstruc-tion of the distorted signal is substantially generated.
Table 4 quantifies the cross correlations of distorted and reconstructed signals compared to the reference one. These results confirm the feasibility of the NGD reconstruction technique in more practical context of sensor application.
4) PROS AND CONS OF THE DEVELOPED RECONSTRUCTION OF DISTORTED SIGNALS
The same as all engineering technique the NGD correction method developed in this study presents certain advantages and drawbacks.
It can be emphasized the main benefits can be drawn from the overall study and especially in Figs. 17. Accordingly, the developed reconstruction technique using LP NGD function is in real-time, simultaneously capable:
• To recovery the signal shape,
• To cancel out the rise and fall time,
• To enhance the distortion attenuation,
• To avoid the under and over shoots,
• And also to reduce the sensor signal delays.
However, the weaknesses of the NGD correction technique are:
• The dependence between the NGD circuit topology and
the bandwidth of sensored signal,
• The frequency bandwidth limitations of R, C and
oper-ational amplifier components,
• The nonlinearity of the NGD circuit if the sensored
signal present a significant amplitude out of the range of operational amplifier voltage supply,
• And the signal delay, limited to some seconds, which depends on the NGD circuit and also depends on R and C component ranges of value.
Behind the present feasibility study, further investigation must be conducted in the future for different sensors as in the biomedical engineering and also in different context of industrial applications.
VI. CONCLUSION
An innovative reconstruction technique of signal distortion effect integrated in the sensors is developed. The developed signal recovery technique is based on the use of LP NGD function.
The basic principle of sensor signal reconstruction is intro-duced. The feasibility of the technique is highlighted with a distortion circuit model TF. The analyses of the distorted sensor outputs, NGD and reconstructed systems are devel-oped from frequency domain analysis of magnitude and GD. The synthesis equations of the appropriated NGD circuit are formulated in function of the degradation parameters.
The established reconstruction technique is validated with arbitrary signals. Parametric investigations in both frequency and time domain show the response of the reconstructed sen-sor signals. Moreover, an example of rotating motion sensing signal reconstruction shows the feasibility of the NGD recon-struction technique. Of course, the proposed reconrecon-struction technique can be transposed to high-, medium and low-speed sensors knowing the feasibility of NGD circuits designability as reported in [36].
It is noteworthy that the developed NGD correction method weakness can be formulated as:
• The frequency limit of the proposed sensor distortion
correction method depends on the bandwidth limitations of NGD circuit constituting R, C and operational com-ponents.
• The limitation of signal delay susceptible to be corrected
depends on the ranges of values of R and C components available for the NGD circuit prototyping.
To overcome the drawbacks of the proposed correction technique, innovative technology of electronic components susceptible to operate with:
• Wider range of values of R and C in order to be able to
operate with signal delay higher than some seconds,
• Broadband operational amplifier capable to operate in
wider frequency range,
• And operational amplifier with wide dynamic of
linear-ity has to be considered.
In the future, the integration of the proposed NGD recon-struction in miniature sensors operating in critical environ-ment will be developed.
REFERENCES
[1] D. C. Swanson, ‘‘Signal processing for intelligent sensor systems with MATLAB,’’ in Signal Processing and Communications, 2nd ed. London, U.K.: CRC Press, Jul. 2011.
[2] G. Brooker, Sensors and Signals, Doppler Measurement, Australian Centre for Field Robotics, Sydney, NSW, Australia: Univ. Sydney, 2006. [3] M. Chu, T. Nguyen, V. Pandey, Y. Zhou, H. N. Pham, R. Bar-Yoseph,
S. Radom-Aizik, R. Jain, D. M. Cooper, and M. Khine, ‘‘Respiration rate and volume measurements using wearable strain sensors,’’ Digit. Med., vol. 2, no. 8, pp. 1–9, Feb. 2019.
[4] G. C. Pope and R. J. Halter, ‘‘Design and implementation of an ultra-low resource electrodermal activity sensor for wearable applications,’’ Sensors, vol. 19, no. 11, p. 2450, 2019.
[5] H. Zhang and Y. Li, ‘‘A low-power dynamic-range relaxed analog front end for wearable heart rate and blood oximetry sensor,’’ IEEE Sensors J., vol. 19, no. 19, pp. 8387–8392, Oct. 2019.
[6] R. Mukherjee, S. Ghosh, B. Gupta, and T. Chakravarty, ‘‘A literature review on current and proposed technologies of noninvasive blood pressure mea-surement,’’ Telemedicine e-Health, vol. 24, no. 3, pp. 185–193, Mar. 2018. [7] M. Forouzanfar, S. Ahmad, I. Batkin, H. R. Dajani, V. Z. Groza, and M. Bolic, ‘‘Model-based mean arterial pressure estimation using simulta-neous electrocardiogram and oscillometric blood pressure measurements,’’ IEEE Trans. Instrum. Meas., vol. 64, no. 9, pp. 2443–2452, Sep. 2015. [8] S. Qiu, G. Xu, H. Ahmad, and L. Wang, ‘‘A robust mutual authentication
scheme based on elliptic curve cryptography for telecare medical informa-tion systems,’’ IEEE Access, vol. 6, pp. 7452–7463, 2018.
[9] H. Mao, L. Ye, and L.-G. Wang, ‘‘High fidelity of electric pulses in normal and anomalous cascaded electronic circuit systems,’’ Results Phys., vol. 13, Jun. 2019, Art. no. 102348.
[10] C. W. Lin and S. C. Luo, ‘‘Estimating total-harmonic-distortion of analog signal in time-domain,’’ in Proc. IEEE 18th Int. Mixed-Signal, Sensors, Syst. Test Workshop, May 2012, pp. 97–100.
[11] M. Gastpar and M. Vetterli, ‘‘Power, spatio-temporal bandwidth, and dis-tortion in large sensor networks,’’ IEEE J. Sel. Areas Commun., vol. 23, no. 4, pp. 745–754, Apr. 2005.
[12] J. Rozman and A. Pletersek, ‘‘Linear optical encoder system with sinu-soidal signal distortion below -60 dB,’’ IEEE Trans. Instrum. Meas., vol. 59, no. 6, pp. 1544–1549, Jun. 2010.
[13] A. Kipnis, Y. C. Eldar, and A. J. Goldsmith, ‘‘Fundamental distortion limits of analog-to-digital compression,’’ IEEE Trans. Inf. Theory, vol. 64, no. 9, pp. 6013–6033, Sep. 2018.
[14] M. Leinonen, M. Codreanu, and M. Juntti, ‘‘Distributed distortion-rate optimized compressed sensing in wireless sensor networks,’’ IEEE Trans. Commun., vol. 66, no. 4, pp. 1609–1623, Apr. 2018.
[15] S. Suranthiran and S. Jayasuriya, ‘‘Filtering of signals distorted by sensor nonlinearity,’’ IFAC Proc. Volumes, vol. 35, no. 2, pp. 505–510, Dec. 2002.
[16] S. Gupta, G. C. Valley, and B. Jalali, ‘‘Distortion cancellation in time-stretch Analog-to-Digital converter,’’ J. Lightw. Technol., vol. 25, no. 12, pp. 3716–3721, Dec. 2007.
[17] G. Szwoch, ‘‘Suppression of distortions in signals received from Doppler sensor for vehicle speed measurement,’’ in Proc. Signal Process., Algo-rithms, Archit., Arrangements, Appl. (SPA), Sep. 2018, pp. 16–21. [18] S. Knorn, S. Dey, A. Ahlen, and D. E. Quevedo, ‘‘Distortion minimization
in multi-sensor estimation using energy harvesting and energy sharing,’’ IEEE Trans. Signal Process., vol. 63, no. 11, pp. 2848–2863, Jun. 2015. [19] Y. Xiao, Z. Xiong, D. Niyato, and Z. Han, ‘‘Distortion minimization
via adaptive digital and analog transmission for energy harvesting-based wireless sensor networks,’’ in Proc. IEEE Global Conf. Signal Inf. Process. (GlobalSIP), Dec. 2015, pp. 518–521.
[20] L. Liokumovich, A. Medvedev, K. Muravyov, P. Skliarov, and N. Ushakov, ‘‘Signal detection algorithms for interferometric sensors with harmonic phase modulation: Distortion analysis and suppression,’’ Appl. Opt., vol. 56, no. 28, p. 7960, Oct. 2017.
[21] B. Shickel, P. J. Tighe, A. Bihorac, and P. Rashidi, ‘‘Deep EHR: A sur-vey of recent advances in deep learning techniques for electronic health record (EHR) analysis,’’ IEEE J. Biomed. Health Informat., vol. 22, no. 5, pp. 1589–1604, Sep. 2018.
[22] D. Ravi, C. Wong, B. Lo, and G.-Z. Yang, ‘‘A deep learning approach to on-node sensor data analytics for mobile or wearable devices,’’ IEEE J. Biomed. Health Informat., vol. 21, no. 1, pp. 56–64, Jan. 2017. [23] G. Guidoboni, L. Sala, M. Enayati, R. Sacco, M. Szopos, J. M. Keller,
M. Popescu, L. Despins, V. H. Huxley, and M. Skubic, ‘‘Cardiovascular function and ballistocardiogram: A relationship interpreted via mathemat-ical modeling,’’ IEEE Trans. Biomed. Eng., vol. 66, no. 10, pp. 2906–2917, Oct. 2019.
[24] Y. Nishida, K. Sasaki, K. Yamamoto, D. Muramatsu, and F. Koshiji, ‘‘Equivalent circuit model viewed from receiver side in human body communication,’’ IEEE Trans. Biomed. Circuits Syst., vol. 13, no. 4, pp. 746–755, Aug. 2019.
[25] K.-P. Ahn, R. Ishikawa, and K. Honjo, ‘‘Group delay equalized UWB InGaP/GaAs HBT MMIC amplifier using negative group delay circuits,’’ IEEE Trans. Microw. Theory Techn., vol. 57, no. 9, pp. 2139–2147, Sep. 2009.
[26] B. Ravelo, ‘‘Recovery of microwave-digital signal integrity with NGD circuits,’’ Photon. Optoelectron., vol. 2, no. 1, pp. 8–16, Jan. 2013. [27] B. Ravelo, ‘‘Neutralization of LC- and RC-disturbances with left-handed
and NGD effects,’’ Adv. Electromagn., vol. 2, no. 1, p. 73, 2013. [28] M. W. Mitchell and R. Y. Chiao, ‘‘Causality and negative group delays in
a simple bandpass amplifier,’’ Amer. J. Phys., vol. 66, no. 1, pp. 14–19, Jan. 1998.
[29] M. W. Mitchell and R. Y. Chiao, ‘‘Negative group delay and ‘fronts’ in a causal system: An experiment with very low frequency bandpass amplifiers,’’ Phys. Lett. A, vol. 230, nos. 3–4, pp. 133–138, Jun. 1997. [30] T. Nakanishi, K. Sugiyama, and M. Kitano, ‘‘Demonstration of negative
group delays in a simple electronic circuit,’’ Amer. J. Phys., vol. 70, no. 11, pp. 1117–1121, Nov. 2002.
[31] M. Kitano, T. Nakanishi, and K. Sugiyama, ‘‘Negative group delay and superluminal propagation: An electronic circuit approach,’’ IEEE J. Sel. Topics Quantum Electron., vol. 9, no. 1, pp. 43–51, Jan. 2003.
[32] J. N. Munday and R. H. Henderson, ‘‘Superluminal time advance of a complex audio signal,’’ Appl. Phys. Lett., vol. 85, no. 3, pp. 503–505, Jul. 2004.
[33] M. Kandic and G. E. Bridges, ‘‘Asymptotic limits of negative group delay in active resonator-based distributed circuits,’’ IEEE Trans. Circuits Syst. I, Reg. Papers, vol. 58, no. 8, pp. 1727–1735, Aug. 2011.
[34] B. Ravelo, ‘‘Similitude between the NGD function and filter gain behaviours,’’ Int. J. Circuit Theory Appl., vol. 42, no. 10, pp. 1016–1032, Oct. 2014.
[35] B. Ravelo, ‘‘First-order low-pass negative group delay passive topology,’’ Electron. Lett., vol. 52, no. 2, pp. 124–126, Jan. 2016.
[36] F. Wan, X. Miao, B. Ravelo, Q. Yuan, J. Cheng, Q. Ji, and J. Ge, ‘‘Design of multi-scale negative group delay circuit for sensors signal time-delay cancellation,’’ IEEE Sensors J., vol. 19, no. 19, pp. 8951–8962, Oct. 2019. [37] B. Ravelo, F. Wan, and J. Ge, ‘‘Anticipating actuator arbitrary action with a low-pass negative group delay function,’’ IEEE Trans. Ind. Electron., early access, Jan. 23, 2020, doi:10.1109/TIE.2020.2967730.
[38] E. S. J. Nebhen, W. Rahajandraibe, C. Dufaza, S. Meillere, E. Kussener, H. Barthelemy, J. Czarny, and A. Walther, ‘‘Low-noise smart sensor based on silicon nanowire for MEMS resistive microphone,’’ in Proc. IEEE Sensors, Nov. 2013, pp. 1–4.
[39] S. Boll, ‘‘Suppression of acoustic noise in speech using spectral subtrac-tion,’’ IEEE Trans. Acoust., Speech, Signal Process., vol. ASSP-27, no. 2, pp. 113–120, Apr. 1979.
[40] Ph. Robert, V. Nguyen, S. Hentz, L. Duraffourg, G. Jourdan, J. Arcamone and S. Harrisson, ‘‘M&NEMS: A new approach for ultra-low cost 3D inertial sensor,’’ in Proc. Sensors, Christchurch, New Zealand, Oct. 2009, pp. 963–966.
[41] O. Leman, E. M. Boujamaa, W. Rahajandraibe, E. Kussener, S. Meillere, H. Barthelemy, G. Jourdan, and P. Rey, ‘‘An inertial smart-sensor based on silicon nanowires for wireless sportive activity monitoring,’’ in Proc. IEEE Sensors, Oct. 2011, pp. 1429–1432.
BLAISE RAVELO (Member, IEEE) was the Research Director of nine Ph.D. students (seven defended), postdocs, research engineers, and mas-ter inmas-ternships. He is currently a University Full Professor with NUIST, Nanjing, China. He is also a Pioneer of the Negative Group Delay (NGD) concept about t< 0 signal traveling physical space. This extraordinary concept is potentially useful for anticipating and prediction all kind of infor-mation. With US, Chinese, Indian, European, and African partners, he is actively involved and contributes on several interna-tional research projects (ANR, FUI, FP7, INTERREG, H2020, Euripides2, Eurostars. . . ). He is also a Lecturer of circuit and system theory, STEM (science, technology, engineering, and maths) and applied physics. His research interests are on multiphysics and electronics engineering. He has coauthored more than 250 scientific research articles in new technologies published in international conference and journals. He is regularly invited to review articles submitted for publication to international journals the IEEE TRANSACTIONS ONMICROWAVETHEORY ANDTECHNIQUES, the IEEE TRANSACTIONS ON CIRCUITS AND SYSTEMS, the IEEE TRANSACTIONS ON ELECTROMAGNETIC
COMPATIBILITY, the IEEE TRANSACTIONS ON INDUSTRIAL ELECTRONICS, IEEE
ACCESS, IET CDS, IET MAP . . . ) and books (Wiley, Intech Science. . . ). Dr.
Ravelo is a member of IET Electronics Letters and the Editorial Board as a Circuit and System Subject Editor. He has been a member of the Scien-tific Technical Committee of Advanced Electromagnetic Symposium (AES) since 2013. His Google scholar H-index in 2020 is 20. He is a member of research groups: IEEE, URSI, GDR Ondes, and Radio Society.
WENCESLAS RAHAJANDRAIBE (Member,
IEEE) received the B.Sc. and M.Sc. degrees from the University of Nice Sophia Antipolis, France, and the Ph.D. degree from Montpellier II Uni-versity, in 2002. He has been a Lecturer with the Microelectronics Department, IM2NP Labo-ratory, since 2004. He has been the Head of the Integrated Circuit Design Group (20 researchers) since 2013. He has been responsible for the CNFM Marseille (National Coordination of Microelec-tronics Formation) since 2007. He is regularly involved to participate and to lead National and International Research Projects (FP7 KIC-InnoEnergy, ANR). He was the scientific responsible of projects titled CAPUCINE (Multi-functions sensor based on Silicon-nanowire, CEA-LETI, CNRS, MOVEA) and MADNEMS (MEMS based microphone, CEA-LETI, AMU, INSA-Lyon Neurelec) both funded by the ANR. He was a Work Pack-age Leader In-Charge of electronics system integration on the European Project titled Innovative Sensor for Material Ageing and Radiation Testing (I_SAMRT) funded by the KIC-Innoenergy in FP7 Program. He directed and co-supervised 18 Ph.D. and 15 master students. He is currently a Full Professor with the University of Aix-Marseille. He has authored or coauthored of eight patents and more than 110 articles published in refereed journals and conferences. His research interests involve AMS and RF circuit design from transistor to architectural level. His present research activity is focused on ultralow power circuit design for smart sensor interface and embedded electronic in bioelectronic and e-health applications, wireless systems, design technique and architecture for multi-standard transceiver. He is an Expert for the ANR and the French Agency for Research.
YAJIAN GAN received the B.Sc. and M.Sc. degrees from the Polytechnic School, Aix-Marseille University, France, in 2015 and 2017, respectively, where she is currently pursuing the Ph.D. degree. Her research activity is focused on the design of integrated circuit for smart sensor interface, particularly for biomedical and e-health applications, sensor design and improvement, data analysis, signal processing, and instrument automation.
FAYU WAN (Member, IEEE) received the Ph.D. degree in electronic engineering from the Uni-versity of Rouen, Rouen, France, in 2011. From 2011 to 2013, he was a Postdoctoral Fellow with the Electromagnetic Compatibility Labora-tory, Missouri University of Science and Tech-nology, Rolla. He is currently a Full Professor with the Nanjing University of Information Sci-ence and Technology, Nanjing, China. His current research interests include negative group delay cir-cuits, electrostatic discharge, electromagnetic compatibility, and advanced RF measurement.
NOUR MOHAMMAD MURAD (Member,
IEEE) was born in Saint Denis of La Réunion, France, in 1974. He received the Ph.D. degree in communication and electronics from the Ecole Nationale Supérieure des Télé Communications (Telecom Paris), in 2001. From 1998 to 2001, he served as an Engineer Research and Devel-opment with Alcatel CIT. During this period, he prepared his doctoral thesis with Télécom Paris in parallel. From 2001 to 2003, he worked as a Teacher and Research with the University of La Reunion, where he had co-responsibility on the Coupling Between Energy and Telecommunication Project. From 2004 to 2007, he was an Assistant Professor Researcher with the 3IL Engineering School and a Researcher with the XLIM/OSA (Limoges University). Since September 2007, he has been an Assistant Professor Researcher with the University of Reunion. In 2018, he obtained his Accreditation to Direct Research (HdR) in Numerical Communications and Networks. He became an Associate Professor in 2019 and was responsi-ble of a team research on Energy Optimization for Sensor Networks (five researchers). He directed and co-supervised five Ph.D. and four master students. He was the scientific co responsible of projects titled ORIANA ANR, FEDER CARERC. . . . Its research relates to the numerical com-munication and RF, signal and information theory with a specific accent on wireless communications, spread spectral techniques, synchronization, MIMO systems, techniques diversity, wireless energy transportation, antenna network, and wireless sensor network.
ALEXANDRE DOUYÈRE (Member, IEEE)
received the Ph.D. degree in electronics and microwaves engineering from the University of La Reunion, Reunion Island, France, in 2008. From 2009, he was an Assistant Professor with the Physics Department, University of La Reunion, where he is currently the Director. He was the scientific responsible of research projects titled XPRIM, FEDER CARERC2. . . . His research interest includes wireless power transfer (WPT) and energy harvesting, nonlinear devices, innovative RF measurements, and low-power microwave and millimeter wave conversion circuits. He is a member of the Organizing Committee for the IEEE RADIO Conference and has been a member of IEEE SIGHT Project named ACTION since 2016.