UNIVERSITÉ DU QUÉBEC
MÉMOIRE PRÉSENTÉ À
L'UNIVERSITÉ DU QUÉBEC À TROIS-RIVIÈRES
COMME EXIGENCE PARTIELLE DE LA MAÎTRISE EN SCIENCES
DE L'ÉNERGIE ET DES MATÉRIAUX
PAR
SALMA SLEIMAN
STUDY THE MICROSTURCTURE AND HYDROGENATION
PROPERTIES OF TilVo.9Crl.l ALLOY WITH ADDITION OF Zr
Université du Québec à Trois-Rivières
Service de la bibliothèque
Avertissement
L’auteur de ce mémoire ou de cette thèse a autorisé l’Université du Québec
à Trois-Rivières à diffuser, à des fins non lucratives, une copie de son
mémoire ou de sa thèse.
Cette diffusion n’entraîne pas une renonciation de la part de l’auteur à ses
droits de propriété intellectuelle, incluant le droit d’auteur, sur ce mémoire
ou cette thèse. Notamment, la reproduction ou la publication de la totalité
ou d’une partie importante de ce mémoire ou de cette thèse requiert son
autorisation.
Université du Québec à Trois-Rivières
Service de la bibliothèque
Avertissement
L'auteur de ce mémoire ou de cette thèse a autorisé l'Université du Québec à Trois-Rivières à diffuser, à des fins non lucratives, une copie de son mémoire ou de sa thèse. Cette diffusion n'entraîne pas une renonciation de la part de l'auteur à ses droits de propriété intellectuelle, incluant le droit d'auteur, sur ce mémoire ou cette thèse. Notamment, la reproduction ou la publication de la totalité ou d'une partie importante de ce mémoire ou de cette thèse requiert son autorisation.
UNIVERSITÉ DU QUÉBEC À TROIS-RIVIÈRES
Ce mémoire a été dirigé par:
Professeur Jacques Huot Université du Québec à Trois-Rivières
Directeur de recherche
Jury d'évaluation du mémoire:
Professeur Jacques Huot Université du Québec à Trois-Rivières
Professeur Jacques Goyette Université du Québec à Trois-Rivières
Résumé
Pour cette thèse de master, j'ai étudié l'effet de l'ajout de zirconium sur la microstructure et les propriétés de stockage de l'hydrogène de l'alliage TiIVo.9Crl.1. J'ai étudié l'effet de différentes concentrations d'additif sur la microstructure, la composition de phase et la cinétique de la première hydrogénation. Les alliages Ti 1 VO.9Crl.1
+
x wt % Zr (x=
0, 2, 4, 8 et 12) ont été synthétisés par fusion à arc électrique. La capacité d'absorption de l'hydrogène a été mesurée en utilisant un appareil de titrage d'hydrogène. La microstructure des alliages a été étudiée à l'aide d'un microscope électronique à balayage. La structure cristalline a été obtenue à partir de la diffraction des rayons X. Il a été trouvé que l'addition de Zr améliorait grandement la première cinétique d'hydrogénation. La composition optimale a été déterminée comme étant 4% en poids de Zr, ce qui a produit une cinétique rapide et une grande capacité de stockage d'hydrogène. Lorsque la quantité de Zr augmente (x> 4), l'abondance des phases secondaires augmente et cela se répercute défavorablement sur la capacité de stockage de l'hydrogène. En outre, l'effet de l'exposition à l'air a été testé pour l'échantillon avec 12% en poids de Zr. L'exposition à l'air a entraîné l'apparition d'un temps d'incubation dans la première hydrogénation et une légère diminution de la capacité en hydrogène. De ce travail, il est clairement démontré que l'addition de Zr permet de diminuer le temps de la première hydrogénation de l'alliage TiIVo.9Crl.1 à température ambiante et sous une pression d'hydrogène modérée.Ackn
o
wledgements
My profound gratitude to God Almighty. He was, He is and He shaU be with me aU days ofmy life.
1 would like to express my thanks and deep appreciation to my thesis director and supervisor Professor Jacques Huot (Institut Recherche Hydrogène, UQTR) for giving me the opportunity to do my master.
1 am thankful for Agnes.
Thanks to Peng for his expert suggestions. Thanks to Viney with her 1 leamed.
Special thanks to Arnol for the consultations that reflected positively on my work.
AU the thanks to my beloved husband Mohamad for his continued support and encouragement. To my kids Hussein, Ibrahim and Jad thank you aU for your understanding.
FinaUy, 1 owe my deepest gratitude to my parents for their love, prayers and sacrifices. 1 love you aU and may the Almighty God richly bless aU of you.
Table of contents
Résumé ... iv
Acknowledgements ... v
List of figures ... viii
List of tables ... x
Introduction ... 1
Chapter 1: H ydro gen Storage ... 2
1.1 Hydrogen as an energy carrier ... 2
1.1.1 Hydrogen storage systems ... 3
1.1.1.1 Compressed hydrogen gas ... 4
1.1.1.2 Liquid hydrogen ... 4
1.1.1.3 Systems based on physisorption ofhydrogen ... 4
1.1.1.4 Metal hydride tanks ... 5
1.1.2 Metal Hydrides ... 5
1.1.3 Hydrogenation process ... 6
1.1.4 Thermodynamic properties of Metal Hydrides ... 8
1.1.5 Activation process ... 12
1.2 Ti-V-Cr BCC solid solution ... 13
1.3 Effect of a secondary phase ... 13
1.4 Objective ofthis research ... 14
Chapter 2: Experimental Methods ... 15
2.2 Characterization ofmaterials ... 16
2.2.1 Scanning Electron Microscopy (SEM) ... 16
2.2.2 Energy Dispersive X-ray spectroscopy (EDX) ... 18
2.2.3 X-Ray Diffraction ... 19
2.2.4 Sievert's Apparatus ... 21
2.3 Synthesis and characterization of materials ... 22
Chapter 3: Microstructure and hydrogen storage properties ofTilVo.9Crl.1 alloy with addition ofx wt % Zr (x = 0, 2, 4,8, and 12) ... 24
3.1 Introduction ... 24
3.2 Results and discussions ... 24
3.2.1 Microstructure Analysis ... 24
3.2.2 Structural Characterization ... 32
3.2.3 Activation process ... 34
3.2.4 XRD patterns after Hydrogenation ... 37
3.2.5 Air exposure effect. ... 40
3.3 Conclusion ... 42
Chapter 4: The article ... 43
4.1 Abstract ... 43
4.2 The article ... 44
Conclusions and perspectives ... 56
List of figures
Figure 1.1: Hydrogen Fuel Cycle ... 2
Figure 1.2: Comparison of specifie energies of different hydrocarbon fuels with that of hydrogen ... 3
Figure 1.3: Volume of 4 kg of hydrogen stored in different ways with size relative to car' s size ... 5
Figure 1.4: Schematic Lennard-Jones potential energy diagram ofhydrogen molecule and atom approaching hydride surface ... 7
Figure 1.5: Ideal Pressure-Composition-Isotherms (PCI) on the upper left-hand side, the construction of the corresponding Van't Hoff plot on the upper right-hand and on the lower part a schematic representation ofhydrogen atoms (red) penetrating the metal host lattice (metals atoms are grey) in
a, a+p
andp
phases ... ..... 9
Figure 1.6: Schematic presentation of sloping plateau, hysteresis and reversible capacity ... 12
Figure 2.1: Arc-melting furnace ... 16
Figure 2.2: SignaIs emitted from different parts ofthe interaction volume ... 17
Figure 2.3: Mechanisms of emission of secondary electrons, backscattered electrons, and characteristic X-rays from atoms of the sample ... 18
Figure 2.4: Diffraction of incident X-rays from the family of parallel atomic planes ... 19
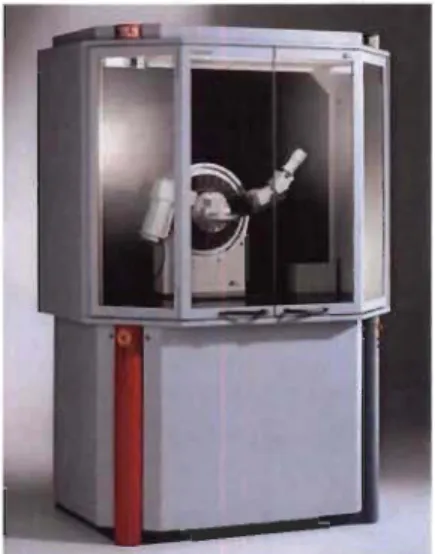
Figure 2.5: Bruker D8 advance X-Ray diffractometer ... 20
Figure 2.6: Schematic of the hydrogen titration apparatus ... 21 Figure 3.1: Backscattered electrons (BSE) micrographs of: TilVO.9 Cn.l
+
x wt % Zr with x= 0 (a), 2 (b), 4 (c), 8 (d) and 12 (e) ... 25Figure 3.2: Backscattered electrons micrographs of: Ti1Vo.9Cr1.l
+
x wt % Zr alloys with elements mapping where x=O (a), 2 (b), 4 (c), 8 (d) and 12 (e) ... 28 Figure 3.3: X -ray diffraction patterns of as cast: Ti 1 VO.9Crl.l+
x wt % Zr alloys with x = 0,2,4,8, and 12 ... 32Figure 3.4: Activation curves of: Ti 1 VO.9Cr1.l
+
x wt % Zr for x = 0, 2, 4, 8, and 12 at room temperature under 2 MPa ofhydrogen ... 35Figure 3.5: X-ray diffraction patterns of: Ti1Vo.9Crl.l
+
x wt % Zr alloys in the hydrogenated state for x = 0, 2, 4,8, and 12 ... 38Figure 3.6: First hydrogenation curves of: Ti1Vo.9Crl.l
+
12 wt % Zr crushed under argon and under air and after 2 days of air exposure at room temperature and under 2 MPa of hydrogen ... 41List of tables
Table 3.1: Bulk atomic abundance: nominal and as measured by EDX of: TiIVo.9CfJ.1
+
xwt % Zr anoys for x = 0, 2, 4, 8 and 12. Error on the last significant digit is indicated in parentheses ... 26 Table 3.2: EDX analysis showing the elemental composition of the matrix (point 1) of: TiIVo.9Crl.l+ x wt % Zr anoys for x = 0, 2, 4, 8 and 12. Error on an values is 0.1 at 0/0 ... 29 Table 3.3: EDX analysis showing the elemental composition of the secondary phase 1 (point 2) ofTilVo.9Crl.l
+
x wt % Zr anoys for x = 0, 2, 4,8, and 12 ... 30Table 3.4: EDX analysis showing the elemental composition of secondary phase 2 (point 3) of: Ti1Vo.9Crl.l
+
x wt % Zr anoys for x = 0, 2, 4, 8, and 12 ... 31 Table 3.5: EDX analysis showing the elemental composition at point 4 of: TiIVo.9CfJ.1+
x wt % Zr anoys for x = 0, 2, and 4 ... 31Table 3.6: Crystal parameters and abundance of each phase in as cast: Ti1Vo.9Crl.l
+
x wt% Zr anoys for x = 0, 2, 4, 8, and 12. Error on the last significant digit is indicated in
parentheses ... 33
Table 3.7: Crystal parameters and abundance of each phase in hydrogenated: Ti 1 VO.9CfJ.1
+
x wt % Zr anoys for x=O, 2, 4, 8 and 12. Error on the last significant digit is indicated in parentheses ... 39Introduction
The use ofhydrogen as a safe and efficient energy vector of the future requires overcoming barriers such as production cost and storage. The difficulties in hydrogen storage are still an important shortcoming for practical applications. Among the various storage means, metal hydrides are very interesting because of their high volumetric density, safety and reversibility. They can be operated at relatively low temperatures and pressures typical of fuel cell operation.
Amongst the different metal hydride systems, Ti-V-Cr body-centered-cubic (BCC) solid solution alloys 'are good candidates for hydrogen storage tanks because of their tunable plateau pressure, reasonable hydrogen storage capacity and safety. But, these alloys suffer from slow and difficult first hydrogenation, the so-called activation step. The first hydrogenation is usually done by subjecting the alloy to a high hydrogen pressure at high temperature which complexify and add cost to the hydride production.
The objective of this research was to study the effect of adding Zr to BCC alloy for quick activation. We used Zr as an additive because prior investigations showed that the alloy Zr7NiIO greatly enhance the first hydrogenation of Ti-V-Cr alloys. Using Zr instead of Zr7NiIO would means a lower material cost and simpler system. We also investigated the effect of air exposure on the first hydrogenation.
This master' s thesis is formed of four chapters. Chapter 1 is an introduction of the context of the study. Chapter 2 is a description of the experimental techniques used for the synthesis and characterization of materials. In chapter 3, the results of addition of Zr to Til VO.9Crl.l alloy are shown and discussed, and finaIly, chapter 4 displays our published article in the special issue of the journal Inorganics, entitled "Functional Materials Based on Metal Hydrides".
Chapter 1: Hydrogen Storage
1.1 Hydrogen as an energy carrierOur society is implementing more and more renewable energy sources such as wind
energy, solar energy, etc. For solar and wind energies, the production is usually not in
phase with the utilization, so' a means to store and carry energy is needed: Hydrogen is a
renewable energy carrier and could also be used as an energy storage [1, 2]. Its high
gravimetric storage capacity attracted the attention of the researchers and increased their interest in hydrogen fuel and storage technologies.
Hydrogen doesn't exist freely in nature, it should be released from chemical compounds
like hydrocarbons and water. There are many methods to pro duce hydrogen such as steam
reforming of natural gas, gasification of coal and biomass, partial oxidation of
hydrocarbons and electrolysis ofwater [3]. In the ideal hydrogen fuel cycle (from water
to water) as presented in Figure 1.1, hydrogen is produced by splitting water via
electrolysis using solar energy and is stored to produce electrical energy.
Figure 1.1: Hydrogen Fuel Cycle [4]
Since the by-product of hydrogen reaction in the fuel cell is water, it is environmentally
friendlyand can be adopted to secure a clean carbon-free energy for the future [5]. From
the energy content point ofview, the gravimetric energy density ofhydrogen is 142 kJ/g
which is about three times that of gasoline and almost five times higher than that of coal [6] as shown in Figure 1.2. 160 140 E 120 ~
..
-;;- 100 Il "5 ~ 80 .2 i2 60 20o
~ o'li ~ ~e ci ~ ~e o~:<:o~~ v Îo..,e" Qfl,t; ~o ,oq A~~ ... OC[,
«i q)Cf" ~~ ~...", ~~~
Figure 1.2: Comparison of specifie energies of different hydroearbon fuels with that of hydrogen [7]
However, the volumetrie energy density of hydrogen at atmospheric pressure and room
temperature is too low, 1 kg ofhydrogen occupies a volume of Il m3. Many efforts are
being made in order to find new materials with high volumetrie hydrogen storage capacity. 1.1.1 Hydrogen storage systems
The hydrogen storage system for most practical applications should have a high storage
capacity, high gravimetric and volumetrie densities, long and stable cycling performance
Hydrogen can be stored using many ways such as: compressed hydrogen gas, liquid hydrogen, systems based on physisorption ofhydrogen and metal hydride tanks.
1.1.1.1 Compressed hydrogen gas
Hydrogen is stored in its gaseous form at room temperature in cylinders that can withstand pressures up to 800 bars. At that pressure, the hydrogen volumetrie density is 40 kglm3
but the gravimetric density is low and this lirnits the practical use of compressed hydrogen .
cylinders. In addition, handling highly pressurised compressed cylinders implies safety risks [8].
1.1.1.2 Liquid hydrogen
Here, hydrogen is stored in its liquid form in cryogenie tanks at around -252 oC and at ambient pressure. Liquid hydrogen has a high volumetrie density of70.8 gIL. Despite the large amount of energy required for liquefaction, this method is being used to transport large quantities of hydrogen. However, hydrogen boil-off and the cost of advanced insulating tanks to maintain very low temperatures coupled with the energy cost to liquefy hydrogen make this method impractical for on-board vehicular application [9].
1.1.1.3 Systems based on physisorption of hydrogen
Molecular hydrogen can be adsorbed to the surface of porous materials by the weak Van der Waal forces. Thus, hydrogen molecules can be reversibly stored on high specifie surface area materials such as carbon-based materials and Metal Organic-Frameworks (MOFs). The amount ofhydrogen stored at 77 K and under 70 bars on porous carbon and MOFs materials have been found to be around 5 wt % and 7.5 wt % respective1y. Usually, to get significant adsorption, a cryogenie temperature as well as high specifie area and porosity are needed [10, 11].
1.1.1.4 Metal hydride tanks
Atomic hydrogen can be stored in a metal hydride. In general, metal hydrides have higher hydrogen volumetric density at ambient conditions compared to the three storage systems mentioned previously. This is shown in Figure 1.3 which compares the volume needed to store hydrogen in: solid metal hydrides, liquified hydrogen and compressed hydrogen. It
is shown that storing 4 kg of hydrogen requires an internaI volume of 110 L in high-pressure tank, while liquified hydrogen requires about 57 L. In the case ofmetal hydrides, the volume needed is much less, being 33 L or 26 L depending on the type of hydride. From the practical point of view where reduction in volume is important, the storage of hydrogen in metal hydrides could be promising.
.solid metal .solid metal hydride hydride
4 k& of H2 needed by electric car with a fuel œil to cover 400Km .
Figure 1.3: Volume of 4 kg of hydrogen stored in different ways with size relative to car's size [12]
1.1.2 Metal Hydrides
The study of metal hydrides started with Thomas Graham near1y 150 years ago with the discovery of the hydrogen absorption properties of palladium [13].
Generally, hydride compounds can be formed with most transition elements and rare earths or actinides. In these compounds, hydrogen atom acts as a metal forming a chemical bond with the metal atoms in the bulk of material. Metal hydrides usually exhibit an important electrical resistivity compared to metals. They are commonly hard and brittle. Intermetallic compounds have been extensively studied for hydrogen storage. These compounds are characterized by well-defined stoichiometric compositions and crystalline order. They are broadly classified as AB, AB2 or AB5 systems, where A is a stable hydride forming element like a transition metal from group III to VI or a rare earth element and B is a weak hydride forming element like Ni, Fe, Co, Al, etc [14]. According to Miedema's model of reversed stability, the more stable intermetallic compound of A and B, the less stable will be the corresponding hydride and vice versa [15].
Intermetallic compounds, such as binary AB5 alloys like LaNi5, have high volumetric hydrogen densities (115 kg/m3) and good cycling ability [16]. However, their gravimetric
storage capacity is low (1.5 wt % H2 in case of LaNi5H6) which is not suitable for on-board hydrogen storage. This is the main drawback for several other intermetallic hydrides having gravimetric capacities less than 4 wt % H2.
In the case of solid solution alloys, the metal atoms of the constituent elements are randomly arranged in the crystallattice. TiVCr solid solutions with body centered cubic (BCC) structure are well known metal hydride alloys. They have been considered as candidate for hydrogen storage application due to their relatively high absorption capacity (3.0 wt %). More details on these alloys are given in Section 1.2.
As hydrides are formed by direct reaction with gaseous hydrogen, it is important to present the hydrogenation process and the thermodynamic properties of metal hydrides.
1.1.3 Hydrogenation pro cess
Equation (1.1) represents metal hydride formation: x
where M is a metal, M Hx is a hydride,
x
is the ratio of hydrogen atoms to metal atomsH / M and Q is the thermal energy released or heat of the reaction.
The hydrogenation mechanism can be divided into the following steps: 1. Adsorption ofhydrogen molecules on the surface.
2. Dissociation to atomic hydrogen.
3. Diffusion ofH atoms into the bulk of the metal (obeying Fick's law) forming a solid solution.
4. When hydrogen concentration exceeds a certain limit depending on the metal ho st, a hydride phase starts to nucleate.
5. Diffusion ofhydrogen through the hydride layer.
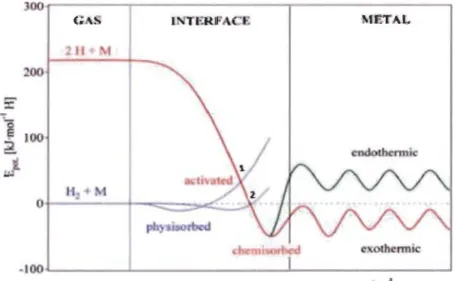
Figure 1.4 represents the potential energy curves for dissociation and chemisorption of hydrogen on a clean metal surface.
200
l
1002
·IOO~---~---~
d
Figure 1.4: Schematic Lennard-Jones potential energy diagram of hydrogen molecule and atom approaching hydride surface [17]
When an hydrogen molecule is getting closer to the surface, the potential energy will
increase due to repulsion between the electronic clouds of the molecule and the surface.
Upon increasing the potential energy of the H2 molecule, it could intersect with the
potential energy of the H atom (point 1 in Fig 1.4) and thus energetically favor for H2 molecule to dissociate into two H atoms and bonded to metal surface.
At point 1, the potential energy is positive, therefore dissociation occurs and the activation
barrier is the height of point 1. The height of tbis barrier generally depends on the type of
rnetal atorns at the surface.
If the intersection happens at point 2 where the potential energy is zero, then a fraction of
H2 rnolecules of energy higher than the activation barrier will dissociate and the
dissociation is said to be non-activated. After dissociation, the H atorns will be
chernisorbed on the surface and bonded to the rnetal atorns.
This chernisorption is exotherrnic if the hydrogen-rnetal H-M bond is stronger than
hydrogen-hydrogen H-H bond otherwise it will be endotherrnic.
1.1.4 Thermodynamic properties of Metal Hydrides
The pressure composition isotherm (pel)
The therrnodynarnic aspects of the hydrogen absorptionldesorption reaction are given by the ternperature and pressure of the reaction.
Figure 1.5 (to the left) displays the PCI behavior of an ideal hydride.
Pel-Oiacram Van't Hoff Plot
m
/ Il Pu.(".
-;
+
f3
-
sT
~---
...
---)~
:
\ex
Figure 1.5: Ideal Pressure-Composition-Isotherms (PCI) on the upper left-hand side, the construction of the corresponding Van It Hoff plot on the upper right-hand
and on the lower part a schematic representation of hydrogen atoms (red) penetrating the metal host lattice (met ais atoms are grey) in
«, «+p
andp
phases[14]
Each isotherm, is a plot of equilibrium hydrogen pressure and hydrogen to metal ratio (concentration ofhydrogen: CH) at a constant temperature, and could be divided into three regions l, II and III.
Referring to Gibb's phase rule, the degree of freedom F at constant temperature in each region is determined by the equation:
F = C - P + 2 (1.2)
where C is the number of components ofhydrogen-metal system and P is the number of phases in thermodynamic equilibrium with each other in this system. F provides the number of possible variables that can simultaneously vary.
Region l (Fig 1.5) corresponds to the low hydrogen concentration (CH « 1) at which hydrogen atoms dissolve randomly in the metallattice forrning a solid solution known as the a-phase which has the same crystal structure as the metal. In this region, two components (metal and hydrogen) as weIl as two phases (a-phase and hydrogen gas) exist. Using Equation (1.2):
F=2
Thus, at constant temperature, hydrogen concentration increases with hydrogen pressure PH2. In this region, the concentration obeys Sievert's law (CH oc p~t2
)
.
The concentration increases until the attractive H-H interaction becomes sufficiently important. This interaction is explained by the fact that the host metallattice expands by hydrogenation, thus reducing the elastic energy for the introduction of hydrogen. When hydrogen reaches sufficient concentration, nucleation of the ~-phase (ordered hydride phase) occurs as presented by region II of Figure 1.5.
In the region II, there is a transition from a to ~ phase, i.e. growth of the hydride phase and the system now has three phases (a-phase, ~-phase and hydrogen gas) and two components (metal and hydrogen). The degree of freedom F is then equal to one. Therefore, in the two-phase region the hydrogen pressure is constant while hydrogen concentration increases. This constant pressure during the transition is called the plateau pressure of the PCI curve and it depends on temperature. With an increasing temperature,
the plateau pressure increases but its width decreases (Fig 1.5) and at the critical temperature Tc no plateau exists.
Once the pure ~-phase is reached, i.e. a-phase is completely transformed to ~-phase as shown in region III (Fig 1.5), an additional degree of freedom is restored and the further absorption of hydrogen would now require a notable increase in hydrogen pressure at which hydrogen enters into the solid solution into the ~-phase.
A series of PCI curves at different temperatures enable the construction of a Van't Hoff plot as presented in the right side of Figure 1.5. It is used to deterrnine experimentally the thermodynamic parameters of formation of a metal hydride by using the Van't Hoff relation given by:
( )
IlH ilS
ln PH =
-2 RT R (1.3)
where D.H is the enthalpy change during the formation of the hydride (transition a to P), !::.S is the associated change in entropy, Ris the gas constant and T is temperature.
The entropy change with hydride formation is mainly due to the loss of the standard entropy ofhydrogen gas. Knowing that the standard entropy ofhydrogen is So = 130 J. K
-I mol-I at 100 kPa then, to a first approximation, the entropy change could be considered
constant: !::.S
=
-130 J. K-I mol-I H2. The enthalpy !::.H is a parameter that determines the stability of the metal hydride bonds, i.e. it measures the strength ofmetal-hydrogen bond. The enthalpy of formation of the hydrides determines the amount ofheat which is released during hydrogen absorption and consequently to be supplied in case of desorption. According to Equation (1.3), the slope of the line obtained (Van't Hoffplot in right upperfF' 1 5) ' IlH hil" . ilS
part 0 19 . lS - W e 11s y-mtercept lS - - .
RT R
In a BCC (body cubic centered) solid solution, the distribution of atoms on the lattice sites is random. These sites have different chemical and geometrical configurations and thus different energies. As a result, the interstitial sites that could be occupied by hydrogen are not equivalent. So, the heat of formation ofhydrogen will be different for interstitial sites with different atomic surrounding and this will give rise to a sloping plateau. An example is given in Figure 1.6. This slope could change over the whole length of the plateau. It is attributed to compositional inhomogeneities.
In a PCI curve, the reversible capacity is the capacity that could be obtained in absorptionldesorption process under practical conditions oftemperature and pressure. The hydrogen capacity could be expressed in terms of atomic ratio HlM which is the number of hydrogen atoms stored for each metal atoms or, in weight percent wt % which is the weight ofhydrogen stored over the weight ofhydride phase.
Q. C ...J Max Reversible
_1
capaclty capaclty Hydrogen capacity (HlM)Figure 1.6: Schematic presentation of sloping plateau, hysteresis and reversible capacity [18]
The hysteresis (shown in Fig 1.6) between absorption and desorption pressures in PCI curves could be due to the difference in elastic and plastic energies resulting from creation of defects and dislocations in hydrogenation and dehydrogenation processes [19]. Reduction ofhysteresis could be attained by heat treatment and by element substitution.
1.1.5 Activation process
The first hydrogenation is also called the activation process. The surfaces of metal alloys are generally covered with oxide layers whose thickness depend on the synthesis process. These layers act as a hydrogen barrier and should be broken for hydrogen to be in contact with the bare metal surfaces.
The activation process is usually performed at high hydrogen pressure and at high temperature. These conditions make it easier to force hydrogen through the oxide layer and this will offer a fresh metal surface for interaction with hydrogen.
1.2 Ti-V-Cr BCC solid solution
Ti-V-Cr BCC solid solution alloys are well known as promising hydrogen storage materials. They are widely studied considering their operating conditions close to normal temperature and pressure conditions and their reversible hydrogen capacity (> 2 wt %) [20-23] .
. For the present investigation, by looking at a temary phase diagram of the Ti-V -Cr system, .
a composition was selected. BCC structure is preferred for hydrogen storage rather than FCC (face cubic centered) and HCP (hexagonal close packed) structures because it has more interstitial sites in the lattice [24]. Moreover, diffusivity of hydrogen is higher in BCC structure [25].
One ofthe problems of Ti-V-Cr system is the slow and difficult activation process. Many approaches have been taken to overcome this drawback such as heat treatment and mechanical deformation.
Heat treatment is an approach that solves the activation problem. It is usually carried out at a high temperature (from 500D
C to 1000D
C). The treatment breaks the oxide layers on a metal surface and improves the hydrogen sorption properties of as-cast alloys [26,27]. However, this approach leads to additional cost on the industrial scale.
Mechanical deformation is another approach that has been used. Edalati et al. [28] found that in Ti -V BCC alloys processed by high pressure torsion, micro structural modifications were induced therefore introducing lattice defects and so enhancing hydrogen storage properties. However, the main drawback for mechanical deformation is the fact that it is difficult and expensive to scale-up [29].
1.3 Effect of a secondary phase
Recently, the addition of Zr7Ni 10 to the Ti-V -Cr system was found to drastically improve
the activation process [30-33]. In these alloys, a specific microstructure is formed. The microstructure is made of a main BCC phase and a Zr and Ni rich secondary phase. The
secondary phase is considered to be acting as a gateway for hydrogen to enter into the main BCC phase [34].
In investigations done by Shashikala et al., where they tried to replace Ti by Zr in Ti-V-Cr system, they noticed the appearance of a secondary phase that is rich in Zr [35]. SEM analyses were done by Bibienne et al. on Ti-V-Cr system with many compositions doped with Zr7Nho [30, 36]. According to their results, almost all zirconium was found in the secondary phase.
In the different system TiFe, Jain et. al demonstrated that addition ofZr7NilO leads to easy activation [37]. Moreover, they tested the effect of Zr and they concluded that a betler performance of TiFe alloy could be obtained by addition of Zr rather than Zr7NilO [38].
1.4 Objective of this research
In section 1.2, we saw that activation by high temperature or by mechanical alloying could be time consuming and costly for the industry. Therefore, there is a need of a material that will be cheap and efficient for activation. From previous investigations, it was shown that adding Zr7NilO helps the activation.
In this research, we picked the system Th VO.9Crl.l that was used by Miraglia et al. [32]. Instead of adding Zr7NilO as Miraglia we decided to add only Zr.
We think that the addition of Zr in pure state could be sufficient for solving the activation problem as well as improving the performance of Ti-V-Cr system.
The effect of adding zirconium on hydrogen properties of Ti-V-Cr system was investigated. The microstructure and the crystal structure were studied in order to see if there is a relationship between microstructure and hydrogen storage properties of these materials.
Chapter 2: Experimental Methods
This chapter presents the experimental techniques that were employed for the synthesis, characterization and evaluation of the hydrogen storage properties of Til VO.9Crl.l
+
x wt % Zr. An arc melting furnace was used for synthesis of alloys. Hydrogen absorption kinetics were measured by a Sievert's type apparatus developed in our laboratory. The characterization of the samples has been performed by: Scanning electron microscopy (SEM), Energy Dispersive X-ray (EDX) and X-Ray powder diffraction (XRD).Brief descriptions of the general principles of these techniques are presented in the following sections.
2.1. Arc Melting
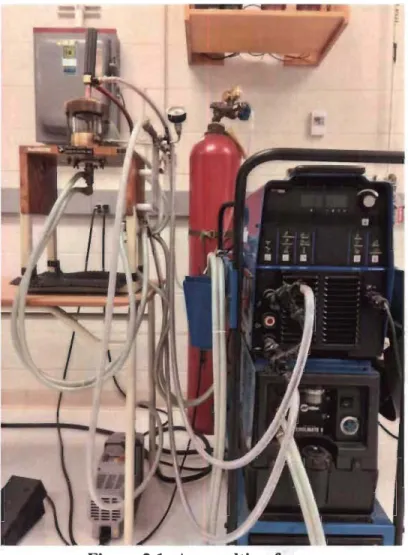
Arc melting is a conventional and easy technique to prepare alloys with good reproducibility. Figure 2.1 shows the arc melting setup used in our laboratory.
The sample is placed in a copper crucible after mixing the desired stoichiometry. The system is pumped down via a rotary pump to remove air and then back filled with argon gas. Hence, melting is performed in argon atmosphere.
An electrically generated arc, between the crucible copper electrode and a tungsten electrode, causes fusion of the materials by loule's effect. To ensure homogeneity, the obtained pellets were tumed over and re-melted three times.
Figure 2.1: Arc-melting furnace
2.2 Characterization of materials 2.2.1 Scanning Electron Microscopy (SEM)
A SEM image is formed by a finely focused beam of energetic electrons scanning over the sample's surface area. The important feature of SEM is the 3-dimensional appearance of its image due to its large depth of field. SEM provides detailed high-resolution images ofthe sample. In addition, chemical information could be obtained by equipping the SEM system with an X-ray energy-dispersive spectrometer (EDX) [39].
The key components of SEM are: electron gun, electromagnetic lenses and detectors. Electrons are used due to their wave-particle duality. The high energy electrons generated by the electron gun are accelerated and focused on the sample using the lenses. The electrons interact with atoms in the sample at various depths as shown in Figure 2.2.
electron beam
Auger Electrons (AE) surface atomlc composHion
Secondary Electrons (SE)
. topographical information (SEM)
Characterlstlc X-ray (EOX)
Ihlc1tness atomic composition
Inelaltlc Scatterlng composltion and bond slales (EELS)
Incoherent Elastlc Seatterlng
Backseattered Electrons (SE) atomlc number and phase differenœs
Continuum X-ray (Bremsstrahlung)
Elastlc Scatterlng
structural analysls and HR Imaglng (diffraction)
Tranlmltted Electrons morphological information (TEM)
Figure 2.2: Signais emitted from different parts of the interaction volume
[40]
This interaction results in the emlSSlOn of secondary electrons "SEs" by inelastic scattering, in the reflection of high-energy electrons (so called back scattered electrons
"BSEs") by elastic scattering, and/or the emission of electromagnetic radiation as presented in Figure 2.3.
PE
•
x-ray
Ch aracte rlstic
•
BSE•
SEFigure 2.3: Mechanisms of emission of secondary electrons, backscattered electrons, and characteristic X-rays from atoms of the sample
[40]
The secondary electrons "SEs" are emitted from atoms in the sample (mainly on the surface) which are detlected at small angles. The image obtained by the SEs gives the morphology of the sample.
Back scattered electrons "BSEs" are the incident electrons retlected or back scattered by atoms in the sample (penetrate deeper) which are detlected at large angles and with small energy loss. This scattering depends on the atomic number Z of the elements.
The higher the atomic number the more backscattered electrons thus a brighter image compared to elements with a lower atomic number. So, the are as that contain heavier elements will be easier to see than areas with lighter ones.
2.2.2 Energy Dispersive X-ray spectroscopy (EDX)
EDX is a technique that provides elemental analysis alongside the high-resolution imaging of SEM. With these two techniques combined, we obtain not only information concerning the morphology of the sample, but also elemental information, in the form of maps and images of surfaces [41].
EDX uses X-rays emitted from the sample when the SEM electron beam hits the surface. These incoming electrons eject an electron from the atoms of the sample's surface creating a hole. This hole is then filled by an electron from a higher shell. As the electron falls to a lower energy shell a photon is ejected. The number and energy of the X-rays emitted from the sample is measured by an energy-dispersive spectrometer.
These emitted X-rays due to the energy difference between the higher and the lower energy shells are directly correlated to the atomic structure of the emitting element [42]. The energy ofthese X-rays is used to identify the elements and provides information about their abundance.
2.2.3 X-Ray Diffraction
X-ray diffraction (XRD) is a technique used for the characterization and identification of crystalline phases in a material.
When a crystal is illuminated by an X- ray beam with wavelength comparable to the
interatomic distances ofthe crystallattice, a constructive interference between elastically
scattered X-ray beams occurs at the Bragg's angle. Bragg's law (Figure 2.4) is expressed
as:
Where, dhkl is the interplanar distance between two crystallographic planes in the crystal,
8hkl is the angle between the incident ray and scattering planes where the diffraction peak
is observed (Bragg' s angle), n is an integer number (order of reflection), it is normally equal to 1 and À is the wavelength of the X-rays.
3 hkl Bragg's Law nÀ
=
2dsin8 )' 2Â.Figure 2.4: Diffraction of incident X-rays from the family of parallel atomic planes [43]
The interplanar distance dhkl is a function of the Miller indices (hkl) and the lattice
parameters of the crystal lattice where (hkl) represents the different crystallographic planes. Therefore dhkl is dependent on the crystal structure.
A diffraction pattern is typically in the form of a graph of the diffraction angle (or interplanar spacing dhkl ) versus the intensity of diffracted beam.
Each ofthese unique patterns can act as an empirical "fingerprint" for the identification of the present phases, by comparing them with patterns in the International Powder Diffraction File(PDF) database complied by the Joint Committee for Powder Diffraction Standards (JCPDS) [44].
As a result, identification of the phases present is possible, but also a quantitative estimation of these phases could be made by the Rietveld method.
The Rietveld method is a whole-pattern fitting least squares refinement technique. This refinement can be performed on the pattern using a software like GSAS or Full-prof. The crystallographic parameters such as lattice parameters of the unit cell, size and strain of the crystallites as weIl as the position of the atoms and the phases abundance can be evaluated.
Figure 2.5 shows the Bruker D8 advance diffractometer with a Bragg-Brentano configuration, used in our laboratory.
2.2.4 Sievert's Apparatus
A Sievert-type experimental apparatus allows the study of the hydrogen absorption and
desorption kinetics as weIl as the detennination of the pressure-composition (P-C)
diagram ofthe material-hydrogen system [45].
In our laboratory, a homemade Sievert-type hydrogen titration apparatus was used. This
apparatus is made of a series of connecting pipes, valves and pressure gauges, as shown in Figure 2.6.
Chamber tempo Temp.Oven
1
37,3
20,1
_AUTO 1 oc
t
Figure 2.6: Schematic of the hydrogen titration apparatus
The volume of each component of the apparatus was accurately measured.
The pipes are connected to a hydrogen inlet, an exhaust outlet, an outlet attached to a
vacuum pump, a reference side and a sample side that are separated by a differential
pressure gauge. The reference and samples sides have identical volumes. The sample side pressure is measured relative to the reference side pressure by me ans of the differential pressure gauge.
By knowing the volume of each component, the amount ofhydrogen absorbed/desorbed could be determined using the equation of state of hydrogen. The equation of state of hydrogen (considered a real gas) can be expressed, by virial expansion of the second order (this is sufficient for the pressure range used in this research), as:
PV = nRT(l +~) (2.1)
v
where P is the hydrogen pressure, V is the volume filled by hydrogen, n is the number of moles ofhydrogen, Ris the ideal gas constant (8.314 J. mole·IK1), T is the temperature
of the sample holder and B is the second virial coefficient and is temperature dependent. One can find the value of B in the reference [46].
Knowing that the volume of the apparatus is constant and the experiment is done at constant temperature, then the number of moles of H atoms absorbed by the sample is:
V ilP iln = 2
----:::-RT(l
+
~)
(2.2)
Where ilP is the pressure drop and the factor 2 corresponds to H atoms absorbed. This factor cornes because the equation of state of gas is established for H2.
The percentage of mass of H atoms absorbed by the sample is calculated using the equation:
massH
% absorbed H = (2.3)
mass(sample+H)
2.3 Synthesis and characterization of materials
In the present study, the following alloys were synthesized: Til VO.9Crl.l
+
x wt % Zr with x=O, 2, 4, 8 and 12. The synthesis was done using an arc-melting fumace. The raw materials were purchased from Alfa-Aesar (Ward Hill, MA, USA) and had the foUowing purities: Ti sponge (99.95%), V pieces (99%), Cr pieces (99%) and Zr sponge (99.95%). They were mixed at the desired stoichiometry and melted together under argonSince these elements have similar melting points (melting points for Ti, V, Cr and Zr are
1668°C, 1910°C, 1907°C and 1855°C respectively), their melting was easy with no mass loss found after the melting.
Microstructure and chemical analysis were performed using a JEOL-JSM 5500 scanning electron microscopy equipped with an EDX apparatus from Oxford Instruments. For this analysis, the pellet was placed for one day in epoxy and then it was polished in steps by
silicon carbide (SiC) abrasive grinding papers. It was grinded from 400 grit to 2400 grit
sizes ln order to get a surface like mirror. The used magnifications for the SEM images were of the order of 250X to 2500X. The percentage of different phases was analyzed by ImageJ software.
For kinetic and XRD measurements, each pellet after synthesis was hand crushed, using a steel mortar and pestle in an argon-filled glovebox. Crushing in air was performed only for the air exposed sample.
The powdered sample was filled without sieving into a sample holder. After loading the
sample holder into the hydrogen titration apparatus, it was kept under vacuum for one
hour at room temperature before exposing it to hydrogen. The temperature was regulated by a thermostatic bath. The kinetic measurements were performed under 2000 kPa of
hydrogen and at room temperature (25°C).
The crystal structure was determined by powder XRD on a Bruker D8 focus apparatus
with Cu Ka radiation (ÀKa = 1.5406
A).
The angle of detection ranges from 30° to 110°for each sample. Lattice parameters were evaluated by Rietveld refinement of the X-ray patterns using Topas software. In order to keep the hydride phase, the absorption experiment was stopped after reaching full hydrogenation and the pressure kept at one bar ofhydrogen.
Chapter 3: Microstructure and hydrogen storage properties of
ThVo.9Cr1.1 alloy with addition of
x
wt
%Zr (x
=0, 2, 4, 8, and 12)
3.1 Introduction
In this chapter, we report our investigation of the effect of ad ding zirconium on the microstructure of Ti1Vo.9Crl.l BCC alloy. Zirconium was added with the following percentages by weight: 2, 4,8 and 12. The alloys Ti1Vo.9Crl.l
+
x wt % Zr (x=
0, 2, 4,8, and 12) were prepared by mixing aIl the constituent elements together in an arc melting furnace.The impact of microstructure on the first hydrogenation was studied. The crystallographic parameters of aIl alloys before and after hydrogenation were determined. We will discuss how the amount of zirconium affects the relative abundance of secondary phase. AIso, the first hydrogenation of a sample exposed to air was measured.
3.2 Results and discussions
3.2.1 Microstructure Analysis
Figure 3.1 shows the backscattered electron micrographs of: Ti 1 VO.9Crl.l + x wt % Zr alloys where x = 0, 2, 4, 8, and 12. It is clear that the microstructure changes with x. Pure TiIVo.9Cn.1 (Figure la) shows a network ofblack are as structure.
Even with a slight doping of Zr (x = 2), a bright secondary phase appears. This could reveal that the bright phase is rich in Zr because the brightness indicates an element with a high number of electrons.
AlI the zirconium-containing alloys were found to be multi-phase: a matrix phase and a bright phase. Dendrites appeared from x
=
8 and were clearly observed for x=
12. It is seen that more Zr leads to higher secondary phase abundance.Figure 3.1: Backscattered electrons (BSE) micrographs of: Th VO.9 CrI.1
+
x wt % Zrwith x= 0 (a), 2 (b), 4 (c), 8 (d) and 12 (e)
By using ImageJ software, the bright phase surface areas were measured. The percentage of the bright areas are 0,4, 12,26, and 35 respectively for x
=
0,2,4, 8, and 12. It shows that, as the amount of Zr increases, the bright phase surface area is getting bigger.To determine the chemical composition of the alloys, EDX measurements were performed. Table 3.1 shows the bulk measured atomic abundance compared to the nominal composition for aIl alloys studied. We see that the bulk measured composition agrees with the nominal one in aIl cases. This was expected because aIl these elements have sirnilar melting points.
Table 3.1: Bulk atomic abundance: nominal and as measured by EDX of: TiIVo.9Crl.l
+
x wt % Zr alloys for x = 0, 2, 4,8 and 12. Error on the last significantdigit is indicated in parentheses
Sample Ti (at %) V (at %) Cr (at %) Zr (at %)
x=O Nominal composition 33 30 37 0
Measurement 34.0(2) 29.8 (3) 36.2 (3) 0.0 x=2 Nominal composition 32.6 29.7 36.6 1.1 Measurement 32.8 (2) 29.4 (2) 36.4 (3) 1.4 (1) x=4 Nominal composition 32.3 29.3 36.2 2.2 Measurement 34.0 (3) 28.2 (1) 35.2 (3) 2.6 (1) x=8 Nominal composition 31.6 28.7 35.4 4.3 Measurement 32.3 (2) 27.7 (2) 34.5(3) 5.5 (1) x=12 Nominal composition 30.9 28.1 34.7 6.3 Measurement 31.7 (2) 26.2 (2) 33.9 (2) 8.2 (1)
Figure 3.2 presents BSE micrographs with elemental mapping for Ti1Vo.9 CrI.l
+
x wt % Zr alloys where x= 0 (a), 2 (b), 4 (c), 8 (d) and 12 (e). These micrographs show that the alloys are made of a main phase thereafter called matrix and indicated by point number 1, bright secondary phases (points 2 and 3) and a dark phase (point 4).Fig 3.2a displays the microstructure of the undoped sample and it can be seen that it is just formed of a matrix and sorne dark phase. The dark phase is about few microns in size. The EDX mapping indicates that the dark phase is Cr and V depleted.
By adding 2 wt % Zr (Fig. 3.2b), a bright secondary phase appears. Close inspection,
reveals that the brightness has two shades, region 3 being brighter than region 2. The EDX mapping shows that the secondary phases are Zr rich and V depleted. In this alloy, dark phase is less abundant than for the bare alloy.
At 4 wt % addition of Zr (Fig 3.2c), the quantity of secondary phase seems almost the same as for x=2 and Zr is mainly in the secondary phase. Also, the secondary phase has two shades. The size of dark phase is getting smaller.
For 8 wt % Zr (Fig 3.2d), more secondary phase appears. It is c1early shown that the secondary phase is Zr and Cr rich and V depleted. There is no dark phase.
By adding more Zr (12 wt %), even more secondary phase appears (Fig 3.2e) and the dark phase disappears. It could be observed that the secondary phase is Zr and Cr rich and poor .
in V. Close inspection of Fig 3.2b, c, d and e indicates that region 2 is usually on the edge of the bright surfaces while region 3 is more in the centre. Thus, it seems that the secondary phase 1 is bridging the secondary phase 2 with the matrix.
TI V Kal
Figure 3.2: Backscattered electrons micrographs of: TitVO.9Cn.l
+
x wt % Zr alloys with elements mapping where x=O (a), 2 (b), 4 (c), 8 (d) and 12 (e)A quantitative analysis was done by EDX measurements at the specifie locations presented in Fig 3.2. Chemical composition of regions 1, 2, 3 and 4 are listed in the Tables
3.2 to 3.5 respectively. Table 3.2 presents the composition of the matrix (point 1) for a11 a11oys.
Table 3.2: EDX analysis showing the elemental composition of the matrix (point 1) of: TitVo.9Cr1.1
+
x wt % Zr alloys for x = 0, 2, 4, 8 and 12. Error on ailvalues is 0.1 at %
Sample Ti (at %) V (at %) Cr (at %) Zr (at %)
x=O 27.8 33.8 38.4 0.0
x=2 27.4 33.4 38.9 0.3
x=4 25.8 35.0 38.9 0.3
x=8 29.3 31.6 38.2 0.9
x=12 28.5 31.7 38.9 0.9
From this table, it can be seen that the matrix is a Ti-V-Cr a110y with inclusion of only a very sma11 amount of Zr «1 at %). The matrix composition does not significantly change when more zirconium is added.
On average, the atomic composition of the matrix is Tio.84 V 1 Cf( .2Zro.o3 which is quite different than from the nominal value. The main difference is that, compared to the nominal composition, the titanium proportion is reduced, the vanadium amount increased. The chromium abundance is almost the same as the nominal one.
As the amount of zirconium was very sma11 in the matrix, it can be expected that zirconium
will be mainly confined in the secondary phases. This can be seen in Tables 3.3 and 3.4 that show the atomic composition of the two secondary phases. Secondary phase one (point 2) is rich in Ti and Zr while secondary phase two (point 3) has a relatively high content of the four elements.
Table 3.3: EDX analysis showing the elemental composition of the secondary phase 1 (point 2) of Th VO.9Cr1.1
+
x wt % Zr alloys for x = 0, 2,4,8, and 12
Sample Ti (at %) V (at %) Cr (at %) Zr (at %)
x=2 64.0 7.0 6.2 22.8
x=4 64.0 6.7 6.2 23.1
x=8 58.3 6.8 4.6 30.3
x= 12 55.8 7.2 5.1 32.0
From Table 3.3, we see that the secondary phase 1 (point 2) is close to composition Ti1.9Vo.2Cro.2Zro.7 for x
=
2 or 4 and to composition TiI.7Vo.2Cro.2Zro.9 for x=
8 and 12. To our knowledge, there are no quatemary alloys that have a stoichiometry close to these. Comparing these two compositions, it could be seen that when x is higher than 8 it seems that there is substitution of Ti by Zr (Zr is getting up by 0.2 and Ti is going down by 0.2) while V and Cr abundances stayed the same. It can be an indication that Ti and Zr are sitting on the same crystallographic site.Table 3.4 shows the composition of secondary phase 2 (point 3). This phase has an almost constant composition Til.oVo.4CrI.lZro.5 and also has a high zirconium content but here chromium is the most abundant element. Contrary to secondary phase 1, the composition ofthis phase does not vary significantly with increasing x.
Table 3.4: EDX analysis showing the elemental composition of secondary phase 2 (point 3) of: Til Vo.9Crl.l
+
x wt % Zr alloys for x= 0, 2, 4, 8, and 12
Sample Ti (at %) V (at %) Cr (at %) Zr (at %)
x=2 33.7 12.3 38.0 16.0
x=4 32.8 12.3 37.9 17.0
x=8 32.8 15.5 33.6 18.1
x= 12 28.5 14.8 36.5 20.2
Chemical composition of the black phase (point 4) was measured and the results are reported in Table 3.5
Table 3.5: EDX analysis showing the elemental composition at point 4 of: ThVo.9Cr1.l
+
x wt % Zr alloys for x = 0, 2, and 4Sample Ti (at %) V (at %) Cr (at %) Zr (at %)
x=O 87.7 7.0 5.3 0.0
x=2 88.2 3.3 2.0 6.5
x=4 79.6 6.8 5.6 8.0
It is evident that the black areas are titanium precipitates. The amount of precipitation tends to decrease with increasing Zr content and for 8 and 12 wt % of Zr there are no Ti-precipitates.
3.2.2 Structural Characterization
Figure 3.3 presents the XRD pattern of aIl the studied samples in the as-cast state. The major diffraction peaks of aIl as cast alloys can be identified as BCC phase (space group
lm-3m). SmaIl peaks appeared as the zirconium doping increases. These peaks are surely
related to the secondary phases. Due to the smallness of the peaks and their relatively smaIl numbers, indexing them is difficult.
• BCC ... C15 .C14 • Ti x=12
en
c
CI)...
x=8 x=4 cr---~ x=2•
x=O•
•
•
30 40 50 60 70 80 90 100 11028
(0)
Figure 3.3: X-ray diffraction patterns of as cast: Th VO.9Crt.l
+
x wt % Zr alloys with x = 0, 2, 4, 8, and 12As demonstrated by Akiba and lba, Laves phases could be closely related to BCC aIloys [20]. Laves phases are weIl known intermetaIlic phases that crystaIlize in three different structures: a cubic MgCu2-type (Space group Fd-3m), a hexagonal MgZn2-type (space
group P63/mmc), or a hexagonal MgNh-type (Space group P63/mmc). Following the
Strukturbericht nomenclature, these phases will be thereafter respecti vel y designated C 15,
C14, and C36. In the specifie case of Ti-V-Cr BCC alloys, it was also shown by Bellon
et al. [47] that when zirconium is substituted for vanadium in these alloys there is the appearance of a C 15 Laves phase.
We analyzed our diffraction patterns by Rietveld's refinement. The obtained crystal
parameters and the abundance of each phase in aIl samples are shown in Table 3.6. Table 3.6: Crystal parameters and abundance of each phase in as cast:
Th Vo.9CrI.l
+
x wt%
Zr alloys for x = 0, 2, 4, 8, and 12. Error on the lastsignificant digit is indicated in parentheses
Sample Phase Lattice Crystallite Phase Bright
parameter size (nm) abundance Area
(Â)
(%)
abundance(%)
BCC 3.0379 (9) 24 (2) 97 (3) x=O Ti a=2.961 (4) 13 (2) 3 (3) 0 c=4.773 (1) BCC 3.0479 (5) 22 (1) 92 (2) x=2 C15 7.172 (7) 14 (7) 2 (1) 4 C14 a=5.903 (9) 8 (2) 6 (2) c=7.26 (2) BCC 3.0470 (7) 23 (2) 89 (3) x=4 C15 7.153 (5) 20 (8) 3 (1) 12 C14 a=5.935 (1) 5 (1) 8 (3) c=8.09 (4) BCC 3.0452 (1) 38 (9) 68 (5) x=8 C15 7.180 (5) 6 (1) 21(4) 26 C14 a=5.849 (7) 6 (1) Il (2) c=8.l 09 (2) BCC 3.0310(1) 8 (3) 66 (4) x=12 C15 6.099 (7) 10 (1) 22 (2) 35 C14 a=5.815 (2) 3 (1) 12 (2) c=8.01 (1)In these refinements, we tried to index the secondary phases' peaks with Laves phases. It
and C14 phases. Tentatively, the C14 phase was assigned to the composition TiI.9Vo.2Cro.2Zro.7 (secondary phase 1) and the C15 phase to the composition Ti 1.0 V0.4Crl.lZro.5 (secondary phase 2).
However, as it is difficult to distinguish between Ti, V, and Cr by X-ray diffraction the exact assignment could be only done by using neutron diffraction. AIso, the problem with these compositions is that the ratio NB is not 2 as it should be for C14 and CI5 phases.
For these reasons, it should be stressed that the indexing ofCI4 and CI5 is tentative and more experiments are needed in order to have the definitive crystal structure of the secondary phases. We are now undertaking neutron experiments and these will be reported in a future paper.
It could be concluded that using two Laves phases for fitting the secondary phase peaks confirm the finding of electron microscopy where two different secondary phases were found.
It should also be pointed out that, on Figure 3.3 only the main peaks ofC14 and CI5 have been indexed. As these two phases have small abundances, only the main peaks are showing in the diffraction patterns and indexing aIl possible peaks would have confused the reader, especially for overlapping peaks that are so small that they are undistinguishable from the background.
Referring to Table 3.6 at which the phase abundances are presented for aIl studied alloys,
the total abundance ofCI5
+
C14 phases roughly matched the abundance measured with ImageJ software.3.2.3 Activation pro cess
The first hydrogenation (activation) of as-cast Ti,Vo.9Crl.l
+
x wt % Zr alloys was performed at room temperature under a hydrogen pressure of 2 MPa after the alloys had been crushed in argon. Results are presented in Figure 3.4.3.5
-
~ 0'i
3.0-
C CI) 2.5 C) 0 ... 20 "C . ~J:
1.5 "C CI)of
1.0 0 t/).c
0.5 c( 0.0 0____ x=O
--.-
x=2
~ x=4--T-
x=8
-+-
x=12
60 120 180 240 300 360 420 480 540 600Time(min)
Figure 3.4: Activation curves of: ThVo.9Cr1.l
+
x wt % Zr for x = 0, 2, 4,8, and 12 at room temperature under 2 MPa of hydrogenThe first hydrogenation for x = 0 is practically impossible. This sample did not absorb hydrogen even after 900 min ofhydrogen exposure. Adding only 2 wt % of Zr to the alloy resulted in a good hydrogen uptake, but the full hydrogenation still took about 10 h.
Increasing x value to 4 wt % had the effect of greatly enhancing the kinetics and full hydrogenation was achieved after 150 min. Further increase of zirconium content slightly improved the kinetics but the total capacity decreased. Among all doped samples, the one with 12 wt % Zr has the fastest activation kinetics, reaching maximum capacity within 3 min. For hydrogen storage purposes, the optimum amount of zirconium seems to be 4 wt
%. However, even if the capacity slightly decreases with addition of more zirconium, the decrease in capacity is not very important.
In the alloy with 12 wt % of Zr the secondary phases comprise between 35 wt % (as
measured from SEM images) and 34 wt % (as determined from Rietveld refinement).
Taking the low estimation of 34 wt %, if these secondary phases do not absorb hydrogen,
and assuming that pure Bec absorbs about 4 wt % of hydrogen, we should expect a
capacity of about 2.7 wt % which is clearly not the case. The measured capacity can not
be explained by the presence of the Bec alloy itself. Thus, we have evidence that, at least one of the secondary phases absorbs hydrogen.
Nonetheless, this then raises the question of the kinetic curves. Except for the 2 wt % Zr alloy, all activation curves do not show any kinks or slope change. This is the signature of a single-phase alloy which is evidently not the case here. However, it has been shown by Akiba and Iba [20] that the Bec Laves phase related alloys could actually be formed by a Bec phase and a Laves phase and still display a single-phase behaviour upon hydrogen
absorption. It seems to be the case in the present system.
As the alloys with Zr addition have a multiphase structure, it is clear that interphase boundaries probably play a role in the activation. Similar investigation in other systems seems to point that way [48].
Nanocrystallinity is also well known to enhance hydrogenationldehydrogenation kinetics [23]. However, in the present case it is not the main factor as evidenced by Table 3.6. From this table, we see that the samples with x=2 and x=4 have almost the same crystallite size but their activation curve is drastically different.
Moreover, the sample with x=8 has a larger crystallite size but the hydrogenation is faster. Therefore, nanocrystallinity alone could not explain the behaviour of this system. Dislocations and defects could lead to a faster first hydrogenation in metal hydrides and this was shown for cold rolled alloys [49, 50].
Another explanation for the quick activation of alloys with zirconium addition may be stability ofthe Fee hydride. As the matrix ofthe Zr-containing alloys has a stoichiometry different from the nominal value and also, taking into account the fact that the Bec alloy contains sorne zirconium, it may well result in sorne change of the formation enthalpy of the Fee hydride phase.
Obviously, thennodynamics should play a role in the improvement ofkinetics. From the EDX measurements, we saw that the amount of Zr in the BCC matrix is small, then we don't expect a big change of thennodynamics of our alloys compared to the work of Miraglia [32]. However, to have a complete understanding of TilVo.9Crl.l alloys with Zr addition, and to detennine the effect ofthennodynamic change in the variation ofkinetics,
the pressure-composition curves and associated Van't Hoff plot should be made. Unfortunately, this type of investigation is too time-consuming to be within the scope of the present thesis.
3.2.4 XRD patterns after Hydrogenation
In order to study the crystal structure of the hydride phase in this set of experiments, the absorption experiment was stopped after reaching full hydrogenation and thereafter the hydrogen pressure was lowered to 1 bar. No vacuum was applied to the sample so that desorption does not occur during the sample holder removal. In separate tests, we exposed the samples to a pressure of 10 kPa and no desorption was noticed. Figure 3.5 shows X-ray diffraction patterns of all alloys after first exposure to hydrogen.
• C14 • FCC x=12 ... CIS • BCC .Ti x=8
-
:l cu•
x=4-
~
•
fi)c
•
CI)• •
-
c
•
•
x=2• •
• • •
•
x=O•
•
•
•
•
30 40 50 60 70 80 90 100 11029
e)
Figure 3.5: X-ray diffraction patterns of: Th VO.9Cn.l
+
x wt % Zr alloys in the hydrogenated state for x = 0, 2, 4, 8, and 12We see that for x
=
0, the structure is BCC. For x=
2, the crystal structure is essentially FCC which is usually the crystal structure adopted by a fully hydrided BCC alloy. The FCC phase is also seen in the patterns for x = 4, 8, and 12 but there are clearly other phases present. Indexation of the supplementary peaks is helped by doing a Rietveld' s refinement. Even if in a Rietveld refinement prior knowledge of the phase present is mandatory, we could use this technique to first fit the patterns by using the known phase such as FCC in the present case. The residue of the fit then shows the unindexed peaks more clearly andit is easier to figure out which crystal structure is possible for the remaining peaks. This procedure was performed for aU patterns. By doing this, it is found that the supplementary peaks could be associated with a C 14 and a C 15 phases.
The crystal parameters and abundance of each phase in aU hydrogenated samples as determined by Rietveld's analysis are presented in Table 3.7.
Table 3.7: Crystal parameters and abundance of each phase in hydrogenated: ThVo.9Crt.1
+
x w.t % Zr alloys for x=O, 2, 4, 8 and 12. Error on the last significantdigit is indicated in parentheses
Sample Phase Lattice Crystallite Phase parameter (A) size (nm) abundance (%) BCC 3.0375 (4) 20 (5) 93 (8) x=O Ti a=2.9622 (2) Il (3) 7 (3) c=4.773 (6) FCC 4.2856 (6) 34 (3) 80 (2) x=2 C15 7.413 (1) 4 (2) 10 (2) C14 a=6.141 (7) 6 (3) 10 (1) c=7.262 (2) BCC 3.1443 (1) 25 (5) 56 (4) x=4 FCC 4.2912 (2) 42 (2) 41 (4) C14 a=5.809 (2) Il (3) 3 (1) c=8.03 (4) x=8 FCC 4.2875(2) 16 (2) 72 (6) C15 7.605(7) 8 (3) 28 (3) x=12 FCC 4.289 (2) 12 (2) 56 (6) C15 7.646 (4) 12 (1) 44 (6)
The lattice parameter of the BCC structure for the hydride of x=O is the same as the lattice parameter ofthe as-cast one. This confmns that the undoped sample wasn't hydrogenated at aU. In the case of x = 2, the FCC phase abundance in the hydrogenated sample is less than the BCC abundance in the as-cast alloy (80% vs. 92%) while both C14 and C15 phases are more abundant in the hydrogenated sample.
For x = 4, there is a presence of both BCC and FCC phases in the hydrogenated alloy. This is surprising, considering that the hydrogen capacity is slightly higher than for x
=
2.It is weIl known that the monohydride of the BCC phase is a BCT (Body Centred Tetragonal) but, as the lattices parameters are very close to each other it is practically impossible to distinguish between the BCC and BCT phases.
However, the lattice parameter of the BCC phase in the hydrogenated state is much larger than in the as-cast state. From the difference in volume ofthe unit cells and assumingthat, on average, a hydrogen atom occupies a volume of2.5
A3,
we could estimate that the BCC phase in the hydrogenated state has a ratio ofH/M of about 0.56 which is equivalent to 1 wt%.When x = 8, we see that the hydrogenated alloy has 72 wt % of FCC phase which corresponds closely to the abundance of BCC phase in the as-cast alloy (68 wt %). Only the C15 phase is present in the hydrogenated sample and the abundance is almost the total of the C14 and C15 phases in the as-cast alloy. Thus, it seems that, upon hydrogenation, the C 14 phase turns into a C 15 phase.
Finally, for x = 12, the FCC phase has an abundance of 56 wt % which is lower than the abundance of the BCC phase in the as-cast alloy (66 wt %). As for x
=
8, there is no C14 phase in the hydrogenated pattern.Forhigh addition of zirconium x > 8, the C14 phase was not detected by X-ray diffraction. This may be due to the fact that, upon hydrogenation, the crystallite size is reduced thus, broadening the peaks ofthis phase. As the C14 phase is already present in relatively small amount (less than 12 wt %) this makes that phase practically undetectable by X-ray diffraction as the peaks are merged into the background.
3.2.5 Air exposure effect
For industrial production, it could be beneficial to be able to handle the cast alloys in air. This motivated us to investigate the air exposure effect on the alloy with 12 wt % of
zirconium. Figure 3.6 shows the activation curves for this alloy crushed in air, in argon and after two days of air exposure.
3.5
-r;:::;;;==============:::;---,
•
- 3
.
0
~.
i
_2.5
C Q) D)o
2
.
0
..
"
~ ,:::1:1.
5
"
Q) .Qo
1.0o
.Jl~
0.5 0.0 ~"TIIII~~~~e~ 1E-4 0.001 0.01 0.1 1 10ime(hr)
Figure 3.6: First hydrogenation curves of TiIVo.9Cr1.l
+
12 wt % Zr crushed underargon and under air and after 2 days of air exposure at room temperature and under 2 MPa of hydrogen
The sample crushed in air has a very short incubation time of 1.6 minutes while the sample after two days of air exposure presents a longer incubation time of 3.75 hours.
However, after incubation time the intrinsic kinetic is as fast for the sample exposed to the air two days as for the samples only cru shed in air or in argon.
The longer incubation time shown by the sample stored in air for 2 days is most probably due to presence of surface oxide.
![Figure 1.1: Hydrogen Fuel Cycle [4]](https://thumb-eu.123doks.com/thumbv2/123doknet/14613622.732783/13.918.221.722.718.1040/figure-hydrogen-fuel-cycle.webp)
![Figure 1.2: Comparison of specifie energies of different hydroearbon fuels with that of hydrogen [7]](https://thumb-eu.123doks.com/thumbv2/123doknet/14613622.732783/14.918.182.806.315.692/figure-comparison-specifie-energies-different-hydroearbon-fuels-hydrogen.webp)
![Figure 1.3: Volume of 4 kg of hydrogen stored in different ways with size relative to car's size [12]](https://thumb-eu.123doks.com/thumbv2/123doknet/14613622.732783/16.918.186.799.491.830/figure-volume-hydrogen-stored-different-ways-size-relative.webp)
![Figure 1.6: Schematic presentation of sloping plateau, hysteresis and reversible capacity [18]](https://thumb-eu.123doks.com/thumbv2/123doknet/14613622.732783/23.918.318.684.133.469/figure-schematic-presentation-sloping-plateau-hysteresis-reversible-capacity.webp)
![Figure 2.2: Signais emitted from different parts of the interaction volume [40]](https://thumb-eu.123doks.com/thumbv2/123doknet/14613622.732783/28.918.221.768.288.802/figure-signais-emitted-different-parts-interaction-volume.webp)
![Figure 2.3: Mechanisms of emission of secondary electrons, backscattered electrons, and characteristic X-rays from atoms of the sample [40]](https://thumb-eu.123doks.com/thumbv2/123doknet/14613622.732783/29.918.184.780.179.353/figure-mechanisms-emission-secondary-electrons-backscattered-electrons-characteristic.webp)
![Figure 2.4: Diffraction of incident X-rays from the family of parallel atomic planes [43]](https://thumb-eu.123doks.com/thumbv2/123doknet/14613622.732783/30.918.291.710.749.1026/figure-diffraction-incident-rays-family-parallel-atomic-planes.webp)