HAL Id: hal-02350379
https://hal.archives-ouvertes.fr/hal-02350379
Submitted on 25 Nov 2020
HAL is a multi-disciplinary open access
archive for the deposit and dissemination of sci-entific research documents, whether they are pub-lished or not. The documents may come from teaching and research institutions in France or abroad, or from public or private research centers.
L’archive ouverte pluridisciplinaire HAL, est destinée au dépôt et à la diffusion de documents scientifiques de niveau recherche, publiés ou non, émanant des établissements d’enseignement et de recherche français ou étrangers, des laboratoires publics ou privés.
A simple and reliable method reducing sulfate to sulfide
for multiple sulfur isotope analysis
Lei Geng, Joel Savarino, Clara Savarino, Nicolas Caillon, Pierre Cartigny,
Shohei Hattori, Sakiko Ishino, Naohiro Yoshida
To cite this version:
Lei Geng, Joel Savarino, Clara Savarino, Nicolas Caillon, Pierre Cartigny, et al.. A simple and reliable method reducing sulfate to sulfide for multiple sulfur isotope analysis. Rapid Communications in Mass Spectrometry, Wiley, 2018, 32 (4), pp.333-341. �10.1002/rcm.8048�. �hal-02350379�
A simple and reliable method reducing sulfate to sulfide for multiple sulfur isotope 1
analysis 2
Authors: Lei Geng1,a,*, Joel Savarino1,*, Clara Savarino1,2, Nicolas Caillon1, Pierre 3
Cartigny3, Shohei Hattori4, Sakiko Ishino4, Naohiro Yoshida4,5 4
5
1Univ. Grenoble Alpes, CNRS, IRD, Institut des Géosciences de l’Environnement, IGE,
6
F-38000 Grenoble, France 7
2
School of Chemistry, Cardiff University, Cardiff CF10 3AT, UK 8
3
Laboratoire de Géochimie des Isotopes Stables, Institut de Physique du Globe de Paris, 9
Sorbonne Paris Cité, Univ. Paris Diderot, UMR 7154 CNRS, 75005 Paris, France 10
4
School of Materials and Chemical Technology, Tokyo Institute of Technology,
226-11
8502 Yokohama, Japan
12
5
Earth-Life Science Institute, Tokyo Institute of Technology, 152-8551 Tokyo, Japan
13 14
a
Now at Anhui Province Key Laboratory of Polar Environment and Global Change,
15
School of Earth and Space Sciences, University of Science and Technology of China,
16
Hefei, Anhui 230026, China
17 18
*Correspondence to: Joel Savarino, Email: [email protected] ; and/or Lei Geng, 19 Email: [email protected] 20 21 22 23 24 25 26 27 28
RATIONALE: Precise analysis of four sulfur isotopes of sulfate in geological and 29
environmental samples provides the means to extract unique information in wide 30
geological contexts. Reduction of sulfate to sulfide is the first step to access such 31
information. The conventional reduction method suffers from a cumbersome distillation 32
apparatus system, long reaction time and large volume of the reducing solution. We 33
present a new and simple method enabling the process of multiple samples at a time with 34
a much reduced volume of reducing solution. 35
METHODS: 1 mL reducing solution made of HI and NaH2PO2 was added to a septum
36
glass tube with dry sulfate. The tube was heated at 124 °C and the produced H2S was
37
purged with inert gas (He or N2) to go through gas-washing tubes and then collected by
38
NaOH solution. The collected H2S was converted to Ag2S by adding AgNO3 solution and
39
the co-precipitated Ag2O was removed by adding a few drops of concentrated HNO3.
40
RESULTS: Within 2-3 hours, a 100 % yield was observed for samples with 0.2 to 2.5 41
μmol Na2SO4. The reduction rate was much slower for BaSO4 and a complete reduction
42
was not observed. International sulfur reference materials, NBS-127, SO-5 and SO-6, 43
were processed with this method, and that the measured against accepted δ34S values 44
yielded a linear regression line which had a slope of (0.99 ± 0.01) and a R2 value of 45
0.998. 46
CONCLUSIONS: The new methodology is easy to handle and allows to process 47
multiple samples at a time, and was demonstrated with good reproducibility in terms of 48
H2S yield and for further isotope analysis. It is thus a good alternative to the manual
conventional method, and especially when processing samples with limited amount of 50
sulfate available. 51
52
Stable sulfur isotopes have been widely used to trace a range of biogeochemical 53
processes [1]. Especially, in 2000, the discovery of the mass-independent isotopic 54
fractionations of sulfur isotopes (S-MIF) in sulfate and sulfide in Archean rocks [2] have 55
shown the potential of the S-MIF signals on tracking the oxygenation of the atmosphere 56
2.4 Gy ago [3], and the geochemical evolution of Mars [4]. The S-MIF signals in ice-core 57
sulfate have also been observed and demonstrated to be useful to track sulfur cycle in 58
today's stratosphere and serve as a unique proxy of large volcanic eruptions that inject 59
sulfur into the stratosphere and thus have global climate impacts [5-8]. Multiple sulfur 60
isotope compositions can also help to constrain the oceanic sulfur cycle (e.g., [9, 10]). 61
To access the S-MIF signals, precise analysis of the four sulfur isotopes (32S, 33S, 62
34
S and 36S) is necessary. The isotopic results are expressed as δ3xS = 3xRsample/3xRCDT-1,
63
where x = 3, 4, and 6, and the δ values are calculated using the CDT standard. The S-MIF 64
values are then defined by: 65 ] 1 ) 1 S [( S S ] 1 ) 1 S [( S S 90 . 1 34 33 36 515 . 0 34 33 33 66
The isotopic analysis is conventionally done by reducing sulfate (SO42-) to sulfide (H2S),
67
converting H2S to silver sulfide (Ag2S), and fluorinating Ag2S to sulfur hexafluoride
68
(SF6) for isotopic composition analysis by isotope ratio mass spectrometry [2, 6, 11, 12]. In
69
the literature, the reduction from SO42- to H2S is mainly achieved by two different
70
reducing agents, Tin(II) (Sn2+) solutions and hydroiodic acid (HI) hypophosphorous acid
71
minerals) with an optimum reaction temperature between 280-300 °C, and the HI acid 73
reducing solution can be applied to aqueous samples at 100-125 °C [14]. Currently, the 74
most applied reducing method used in sulfur isotope geochemistry follows the reducing 75
agent recipe (500 mL concentrated HI, 816 mL concentrated HCl, and 245 mL 50 % 76
H3PO2) of Thode et al. [16] and a distillation apparatus similar to that described in Forrest
77
and Newman [17]. 78
In the Thode et al. [16] reducing solution, high concentrations of HI seem to be the 79
most important component of the reducing agent for complete sulfate reduction, and the 80
presence of H3PO2 or NaH2PO2 fastens the reduction speed by maintaining a high
81
hydroiodic acid to iodine ratio which is one of the factors favoring the reduction [14, 18]. 82
HCl acid is only of secondary importance and its presence is suggested to be used to 83
increase the acidity and volume, and reduce the use of relatively expensive HI [13, 19]. 84
However, Gustafsson [20] found the presence of water is detrimental for the reduction 85
because water tends to dilute and thus lower the concentration of HI, and at lower HI 86
concentration, side product (i.e., SO2 and elemental S) will be formed [18]. In this regard,
87
mixing 50 % H3PO2 and concentrated HCl to concentrated HI may have draw backs for
88
the reduction efficiency, because both H3PO2 (50 %) and concentrated HCl (37 %) acids
89
comprise more than half of water by weight. To avoid additional water in the reducing 90
solution, the H3PO2 acid can be replaced with dry NaH2PO2 salt, and HCl acid can be
91
omitted. Gustafsson [20] and Davis and Lindstrom [18] have used a reducing solution 92
containing only HI acid (57 %) and NaH2PO2 salt, and found good reduction yield. In
93
particular, Davis and Lindstrom [18] found an optimum composition of reducing solution 94
for complete and fast sulfate reduction is 0.13 g NaH2PO2 in 1 mL HI (57 %). In these
studies, aqueous sulfate samples were processed and a cumbersome distillation apparatus 96
was used. 97
Summarized from the literature, it seems that the best composition of the reducing 98
solution would be a mixture of 0.13 g NaH2PO2 in 1 mL HI (57 %), and water should be
99
limited in the reduction experiment. The latter suggests dry sulfate samples are a better 100
choice as the starting material. Typically, barium sulfate (BaSO4) is the preferred sulfate
101
form used for the four sulfur isotope analysis because it is the natural form found in 102
major geological samples or can be readily prepared from natural samples containing 103
soluble sulfate (e.g., sea water) by precipitation with excess BaCl2 solution. BaSO4 has
104
very low solubility (≈ 0.02 mg/L at 20° C) and this may inhibit the reaction efficiency 105
and speed, especially when the volume of the reducing solution is small. Alternatively, 106
soluble sulfate in natural samples can also be extracted and purified by other methods 107
such as using an ion-exchange resin [21] and which can lead to dry Na2SO4 by evaporating
108
the eluent. We thus conducted tests with both BaSO4 and Na2SO4 to explore the reaction
109
efficiency of the reduction process with respect to different sulfate forms. In this study, 110
we present a series of experiment using a reducing solution comprising NaH2PO2 and HI
111
(57% by weight) to process dry sulfate samples (both Na2SO4 and BaSO4). To avoid the
112
cumbersome distillation apparatus, we tested a simple flow system with only sealed glass 113
tubes connected by PEEK tubes and explored the possibility to process multiple samples 114
at a time. The reproducibility for H2S yield and for further sulfur isotope analysis is
115 reported. 116 EXPERIMENTAL 117 Reagents 118
The new reducing solution was made of 100 mL concentrated hydriodic acid (HI, 57 119
% by weight, ) and 13 g sodium hypophosphite (NaH2PO2). The reducing solution should
120
be made in a fume hood, where 100 mL HI and 13 g NaH2PO2 were added to a flask. The
121
flask was placed on a hot plate magnetic stirrer and a magnetic stir bar was used to mix 122
the liquid and the salt. Because HI is easily oxidized by O2, helium (He) or another inert
123
gas stream (e.g., N2) was introduced by a PEEK tube to the flask to purge the mixture.
124
While purging with He, the hot plate was turned on and the temperature was set at 130 125
°C. The flask was heated at 130 °C for at least one hour to reduce any sulfur compounds 126
into H2S (that was flushed away from the reagents) and to reduce traces of I2 (in the form
127
of I3-) into I- by NaH2PO2. The solution started with deep color (I3-) and became colorless
128
with time. After heating for 1 hour, the solution was allowed to cool down under the He 129
stream and then stored in a sealed brown bottle. The reducing solution may be oxidized 130
overtime, which is indicated by light yellow color and the color may get deeper 131
depending on the degree of oxidation. 132
Different from what can be found in the literature, in this study, we used sodium 133
hydroxide (NaOH, 0.1 M) as the trapping solution to collect the reducing product H2S.
134
Conventional trapping solution, cadmium (or zinc) acetate (Cd(CH3CO2)2, 0.1 M) and/or
135
silver nitrate (AgNO3, 0.01 M) were also made and used, and the results were compared
136
with that from the NaOH trapping solution. As detailed below, using NaOH as the 137
trapping solution allows direct quantification of sulfur concentration by UV absorption 138
spectroscopy, which, in terms of the yield quantification, is faster and more reliable than 139
gravimetric techniques. 140
Apparatus 141
The reduction train is sketched in Figure 1. The main parts of the apparatus are four 142
15 mL glass tubes each with nitrile/PTFE septum and a block heater. The reaction tube 143
'a', two gas washing tube 'b1' and 'b2' and the collection tube 'c' were connected with 144
PEEK tubes (1/16" ID) directly through the septum. Alternatively, a drying cartridge 145
filled with potassium perchlorate (KClO4) and a cryogenic trap (which its internal
146
temperature can be controlled between -200 °C and -80 °C) could be placed between the 147
b2 trap and the collection tube to test the possibility of using pure H2S as the working gas
148
for isotope analysis. The aim of the drying cartridge and the cryogenic trap is to purify 149
H2S without any loss. Dry sulfate sample (i.e. Na2SO4) and 1 mL reducing solution were
150
introduced in glass tube 'a', which was placed on a block heater and purged with He flow 151
for 20 minutes before turning on the heater to a temperature set at 124 °C. The purge 152
before the heating is necessary to remove trace I2, especially when the reducing solution
153
has a light yellow appearance overtime due to slight oxidation. 154
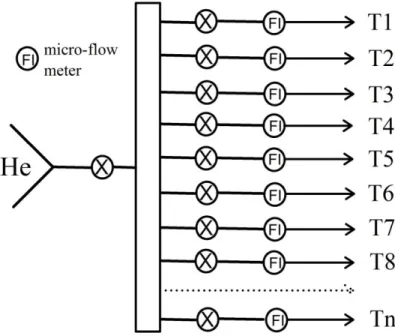
A He tank supplied the He gas. In practice, we had a home-made flow distributor to 155
distribute the He flow to eight flows, as shown in Figure 2. Each flow was then guided to 156
an individual reduction train, and the flow rate (~ 2 mL/min) of each reduction train was 157
controlled by a micro-flow meter (ref: P-446, IDEX Health & Science, Sainte-Foy-La-158
Grande, France). In this way, multiple samples can be processed simultaneously. 159
Testing samples 160
We used the above-mentioned reducing solution and apparatus to process dry 161
sulfate samples in the forms of barium sulfate (BaSO4) and sodium sulfate (Na2SO4).
162
Na2SO4 samples were made from 1 mM Na2SO4 solution (0.142 g Na2SO4 in 1 L Milli-Q
163
water, Millipore SAS, Molsheim 67120, France), and then a desired volume of the 164
Na2SO4 solution (e.g., 0.2 or 0.5 mL, equivalent to 0.2 or 0.5 μmol SO42-) was added to a
165
pre-cleaned reaction tube. The reaction tube was allowed to completely dry in a 100 °C 166
oven, and the sample was then stored for later use. 167
In order to make BaSO4 samples, a desired volume (e.g., 0.2 or 0.5 mL) of the 1
168
mM Na2SO4 solution was added to the reaction tube, and then a drop of 1 M HCl solution
169
was added to the same tube to remove any carbonate in the solution. After overnight, a 170
drop of 0.1 M BaCl2 solution was added to the reaction tube to precipitate BaSO4. After
171
BaSO4 precipitates, the sample was processed differently. For one set of BaSO4 samples,
172
they were just dried completely in an over at 100 °C, so the dry samples contain BaSO4,
173
BaCl2 and NaCl. We termed this set of samples BaSO4-EB (BaSO4 with excess BaCl2).
174
For the other set of BaSO4 samples, they were centrifuged and the supernatant was
175
removed. The remained solids were rinsed with Milli-Q water and then separated from 176
the rinsing water by centrifuge. This step was repeated three times before the sample was 177
placed in the oven to dry. This set of samples was termed P-BaSO4 (pure BaSO4).
178
In addition, international reference materials (in the form of BaSO4), IAEA-SO-5
179
(δ34S = (0.5 ± 0.2) ‰), IAEA-SO-6 (δ34
S = (-34.1 ± 0.2) ‰) and NBS-127 (δ34S = (20.3 180
± 0.4) ‰) were prepared by weighing ~ 0.5 mg of the BaSO4 standards to reaction tubes.
181
After reduction, these samples were further converted to SF6 for isotope analysis. We
182
note the reference materials were not weighed precisely because of the capability of our 183
balance (0.1 mg precision). However, the purpose of processing these samples is to test 184
potential sulfur isotope fractionation during the reduction, rather than assessing the 185
reduction yield (which can be assessed from the samples made from drying Na2SO4
solution with accurate measurement of sulfur content or precipitating BaSO4 from the 187 same Na2SO4 solution). 188 Quantification 189
The yield of the reduction from sulfate (SO42-) to sulfide (S2-) can be directly
190
assessed by determining the quantity of H2S collected in the NaOH trapping solution.
191
Hydrogen sulfide (H2S) solution is known to absorb ultraviolet light with a peak
192
absorbance at 230 nm [22, 23]. Guenther et al. [22] have shown that in alkaline solutions with 193
pH > 8, H2S is present nearly 100 % in the form of bisulfide ion (HS-), and found that at
194
pH ~ 8, ultraviolet determination of HS- yields are accurate because precise estimates of 195
total sulfide concentration in the solution can be achieved. Thus, with NaOH as the 196
trapping solution, the yield of the reduction can be directly assessed by measuring HS- in 197
the solution with optical methods. In comparison, the conventional trapping solution 198
(cadmium acetate or silver nitrate) collects H2S as a precipitate, which makes it difficult
199
to directly quantify the reduction yield. 200
In this study, we used an ultraviolet spectrophotometer (model 6850, Jenway, 201
Staffordshire, UK) to determine the concentration of H2S in the NaOH trapping solution.
202
The calibration standards were made from mixing sodium sulfide nonahydrate 203
(Na2Sˑ9H2O, > 99.99% purity, Sigma-Aldrich, St. Louis, MO, U.S.A.) with 0.1 M NaOH
204
solution. Few Na2Sˑ9H2O crystals were quickly rinsed on kimwipes® disposable wipers
205
to remove surface oxidation products, dried and weighed directly. A stock solution of 206
0.01 M HS- was made by mixing 0.0125 g of pre-cleaned Na2Sˑ9H2O in 5 mL 0.1 M
207
NaOH solution. A set of working standards, 0.0 μM, 20 μM, 50 μM and 100 μM were 208
then made by diluting 0, 0.02, 0.05 and 0.1 mL of the stock solution into the adequate 209
volume of 0.1 M NaOH to reach 10 mL standard solution. The stock solution should be 210
stored in a sealed brown bottle and flushed with He before storage, since sulfide is easily 211
oxidized by O2 once in contact with air. Even flushed before storage, we noticed
212
significant loss of sulfide from the stock solution after two to three days. Guenther et 213
al.[22] made the stock solution in a glass aspirator bottle purged with N2, and stated the
214
solution should be stable for about 1-2 weeks. In practice, we made fresh stock solution 215
once every two days, and working standards every day. 216
Procedure 217
Prior to the reduction, all glassware, caps, septum and PEEK tubes were cleaned 218
with Milli-Q water. The PEEK tubes have to be flushed to make sure there is no water 219
left inside of them, otherwise the water will block the flow of the carrier gas in the 220
reduction line. 221
In a fume hood, 1 mL reducing solution was added to a pre-prepared reaction tube 222
with known amount of dry sulfate. In the reaction tube, the reducing solution was purged 223
with He for 20 minutes at room temperature to remove any I2 and O2. The gas washing
224
tubes (b1 and b2 in Figure 1), and the collection tube (c in Figure 1) were prepared by 225
adding 12 mL Milli-Q water and 12 mL 0.1 M NaOH, respectively. After the reducing 226
solution was purged for 20 minutes, the reduction train was assembled (Figure 1) and the 227
reaction tube was placed in the block heater and heated at 124 °C. At lower temperatures 228
the reduction speed will be slow, while if the temperature is too high, excessive amount 229
of phosphine (PH3) will be produced from the decomposition of NaH2PO2[14]. For the
230
alternate set up, the drying agent was in-line with the cryogenic system, the latter was set 231
at -200° C to trap the products of the reaction. When the reaction was over, the 232
temperature of the cryogenic trap was raised to -120° C from which the produced H2S
233
was released and trapped in the collection tube. 234
The collection tube was removed from the reduction train after the reaction was 235
done. The concentration of H2S in the trapping solution was firstly measured by the
236
ultraviolet spectrophotometer as described in section 2.4, in order to assess the yield. 237
After that, 1 mL 0.01 M AgNO3 was added to the collection solution to precipitate Ag2S
238
and Ag2O. After gently shaking, a few drops of concentrated HNO3 (68 %) were added to
239
the suspension. With thoroughly shaking, Ag2O was dissolved and only Ag2S remains in
240
the solid phase. The tube was allowed to settle down, and a plastic laboratory dropper 241
was used to remove the supernatant. The solid was then rinsed with Milli-Q water for 242
three times, transferred to an aluminum boat and dried for fluorination. 243
Isotope analysis 244
To explore potential sulfur isotope fractionation during the reduction, we processed 245
international sulfate reference materials, IAEA-SO-5, IAEA-SO-6 and NBS-127, 246
following the above-mentioned procedure in section 2.5. The reference materials were 247
weighed approximately 0.5 mg and added to the reaction tube. The reaction was stopped 248
after ~ 5 hours. 249
After converting to Ag2S as described in section 2.5, the reference materials were
250
shipped to the Stable Isotope Geochemistry Laboratory at IPG-Paris (Institut de Physique 251
du Globe) for sulfur isotope analysis. At IPG, the samples were dried and then transferred 252
to aluminum boat and weighed. Due to the small quantity (~ 0.3 mg Ag2S or less) of the
253
sample, we found it is very difficult to transfer the dry Ag2S from the collection tube to
254
the Al boat. Alternatively, we transferred the solid with a small amount of water together 255
from the tube to the Al boat, and then dried the samples. Under this circumstance, we 256
found that after drying, the inside wall of the Al boat became light-brown in color, and 257
the mass of the dried Al boat with sample exceeded the sum of the sample and the Al 258
boat, indicating the gain of extra mass during the drying process. This is likely due to the 259
development of a thin layer of Al2O3 on Al metal surface when Al contacts with water at
260
the drying temperature (70 °C). This is consistent with the observation that, after drying 261
an Al boat with Milli-Q water at 70 °C, a brown layer on the inner surface of the Al boat 262
was formed and the mass of the Al boat was increased . Nevertheless, the results of 263
fluorination yields and sulfur isotopic analysis suggested this neither influences the 264
fluorination procedure nor the isotopes composition. 265
The dried Ag2S samples were fluorinated in nickel bombs under approximately 37
266
kPa of fluorine gas (F2) at 250 °C overnight. The evolved SF6 was purified cryogenically
267
and then by a gas chromatography. Because of the small amount of samples (< 0.5 mg 268
Ag2S), a microvolume cold finger of an isotope ratio mass spectrometer (Thermo
269
Scientific MAT 253) working in dual-inlet mode was used to concentrate the sample gas 270
for isotope analysis [24]. The analytical uncertainty (1 σ) for the instrument was 0.25 ‰ 271
for δ34S, 0.010 ‰ for Δ33S and 0.062 ‰ for Δ36S obtained by replicate analysis (N = 4) 272
of IAEA-S-1 over a period of four weeks (one week per IAEA-S-1 analyzed) when the 273
processed sulfate standards were also measured for sulfur isotopic composition. 274
RESULTS AND DISCUSSIONS 275
H2S collection agents
276
The reduction product, H2S, has to be collected and converted to Ag2S before
277
fluorination for isotope analysis. As mentioned above, Cd(CH3CO2)2 [16, 17] and AgNO3[13]
have both been shown to be able to efficiently trap H2S by forming CdS and Ag2S
279
precipitates, respectively. The CdS precipitate is further converted to Ag2S by adding
280
AgNO3 solution [16, 17].
281
Conventional reducing solution commonly contains phosphorous acid (H3PO3) or
282
hypophosphorous acid (H3PO2) [13], and phosphine (PH3) is produced when the reducing
283
solution is heated [18]. Once PH3 gets in contact with AgNO3, it reduces Ag+ to Ag0 and
284
leads to excess precipitate in addition to Ag2S [17]. To prevent this, Thode et al.[16] and
285
Forrest et al.[17] used Cd(CH3CO2)2 as the trapping solution. In particular, Forrest et al. [17]
286
flushed the Cd(CH3CO2)2 solution with N2 for 15 minutes after CdS precipitates and prior
287
to adding AgNO3. This step was found to effectively remove PH3 and thus no excess
288
precipitate formed. However, Arnold et al. [13] found that when using AgNO3 as the
289
trapping solution, excess of Ag precipitate in the trap is not detrimental to the final
290
isotope analysis of the sulfur content after fluorination. Because of this, AgNO3 appears
291
to be a better reagent to collect H2S, given the environmentally toxic nature of Cd2+.
292
In this study, we first employed 0.01 M AgNO3 as the trapping solution. However,
293
we observed spuriously high precipitate in the trap as soon as the reducing solution was
294
heated, and the trapping solution turned to completely dark in a few minutes, even when
295
there was no sulfate added to the reducing solution. At the same time, we noticed
296
apparent silver mirror on the inside wall of the collection tube, indicating reduction of
297
Ag+ to Ag0. This severely reduction of the AgNO3 solution is probably due to the high
298
production of PH3 from our reducing solution. Different from the conventional reducing
299
solution, our reducing solution used NaH2PO2 instead of H3PO2/H3PO3. NaH2PO2 starts
300
to decompose and produce PH3 at 90 °C, while H3PO3 effectively decomposes to yield
PH3 at 200 °C. Therefore, at the temperature of the reduction experiment (i.e., 124 °C),
302
our reducing solution was presumably producing much more PH3 than the conventional
303
reducing solution. To remove the excess precipitate other than Ag2S caused by PH3, we
304
used 1 M HNO3, followed by 1 M NH4OH to wash the precipitate formed in the AgNO3
305
trapping solution. Only part of the precipitate was removed after these treatments and
306
there was still virtually more precipitate than expected. Thus, AgNO3 is not a good choice
307
as the trapping solution, as least with regard to our reducing solution.
308
To avoid the reduction of Ag+ by PH3, we next tested 0.1 M Cd(CH3CO2)2 as the
309
trapping solution and following the strategies described in Forrest et al.[17]. Despite this,
310
excess precipitation was still frequently observed after AgNO3 was added to the trapping
311
solution for CdS to Ag2S conversion. In particular, we noticed during the collection of
312
H2S, yellow material was accumulated at the wall right above the surface of the
313
Cd(CH3CO2)2 solution, indicating the formation of CdS. However, at the same time, the
314
entire Cd(CH3CO2)2 solution became light brown and the brown color got deeper with
315
increasing trapping time. When AgNO3 was added after the collection, the trapping
316
solution turned to dark with extensive precipitate at the same time. Obviously there were
317
still interferences between the trapping solution and/or AgNO3 with the volatile
318
product(s) of the reducing solution. Similarly, excess precipitate remained after washing
319
with 1 M HNO3 and 1 M NH4OH. This, together with the toxic nature of Cd2+, made us
320
decide to abandon Cd(CH3CO2)2 as the trapping solution in our system.
321
Instead, we used 0.1 M NaOH as the trapping solution to collect H2S. At this pH of
322
13, the trapped H2S mainly existed in the form of HS-, as shown in Figure 3a. Since the
323
NaOH trapping solution was purged with He, under this condition the dissolved O2 was
very low and thus the trapped sulfide was stable. The use of NaOH as the trapping
325
solution has two advantages, 1) the trapped H2S can be precisely quantified in real-time
326
using an ultraviolet spectrophotometer as described in section 2.4, and thus the progress
327
toward to complete reduction of a sulfate sample can be monitored; 2) that no reaction
328
between PH3 and AgNO3 occurs avoiding the production of excessive mass interference.
329
After sample collection, 1 mL 0.01 M AgNO3 was added to the trap to produce
330
Ag2S. AgOH was produced at the same time, which changed to Ag2O quickly. The
331
suspension was allowed to settle down for 10-20 minutes after thoroughly shaking, and
332
then a few drops of 68 % HNO3 were added to acidify the trapping solution. Ag2O was
333
readily dissolved in the acidified solution and only Ag2S remains.
334
H2S yield
335
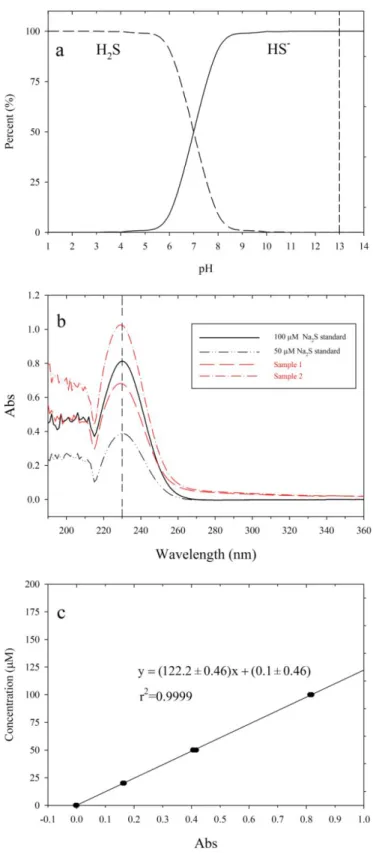
In the 0.1 M NaOH trapping solution, sulfide was mainly present in the form of HS -336
(Figure 3a). Figure 3b shows the typical absorbance spectra of two Na2S working
337
standards (in 0.1 M NaOH matrix) and two NaOH trapping solution after 2 hours 338
collection of H2S, and as expected, the absorbance spectra peak ~ 230 nm, consistent
339
with that from Guenther et al.[22]. In Figure 3c, an average of calibration curve over three 340
days working standards is plotted. 341
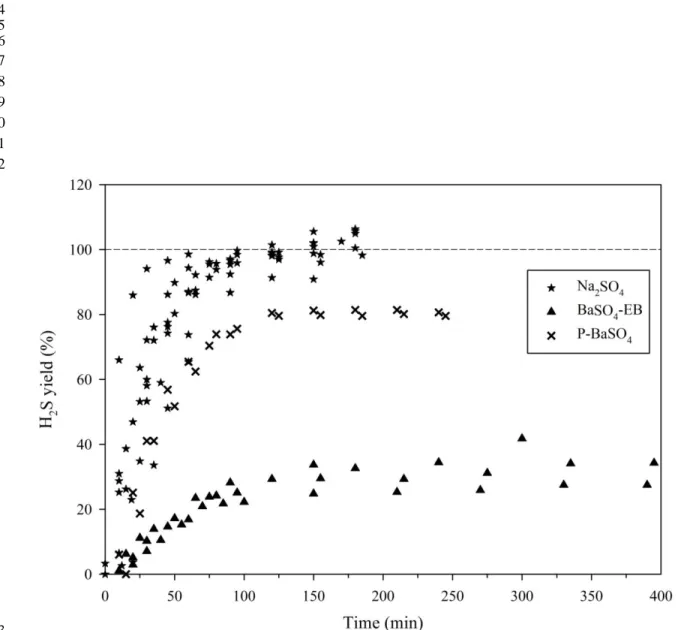
As described in section 2.3, we had three different sulfate samples processed using 342
our system, Na2SO4, BaSO4-EB, and P-BaSO4, and the time-resolved H2S yields from
343
these three materials are plotted in Figure 4. The real-time production of H2S was
344
monitored by ultraviolet determination of HS- in the trapping solution every 15-20 345
minutes. Once the produced H2S reached the amount expected from the starting sulfate,
346
or no longer increases with time, the block heater was turned off and the reduction train 347
was flushed with He for 20 more minutes after the reaction tube cooled to room 348
temperature. 349
In general, Na2SO4 was reduced faster than P-BaSO4, and much faster than BaSO4
-350
EB. Regardless the quantity of the starting sulfate, after 1 hour of reduction, an average 351
H2S yield of (85.7 ± 10.3) % was reached when Na2SO4 was the starting material. In
352
comparison, the H2S yield after 1 hour of reduction was (63.9 ± 2.1) % for BaSO4-EB
353
and only (18.5 ± 0.04) % for P-BaSO4. After 2 hours, a (99.5 ± 3.7) % yield was reached
354
for Na2SO4, indicating the completion of the reduction. However, after 2 hours, it
355
appeared that no more H2S was produced for BaSO4-EB and P-BaSO4, and the yield
356
remained at (80.4 ± 0.75) % for BaSO4-EB and (28.5 ± 0.09) % for P-BaSO4 after 4 or 5
357
hours. For two of the BaSO4-EB samples, we let the reaction continue overnight, and the
358
yield increased from 41.7 % and 34.5 % at 5 hours to 58.3 % and 86.5 %, respectively. 359
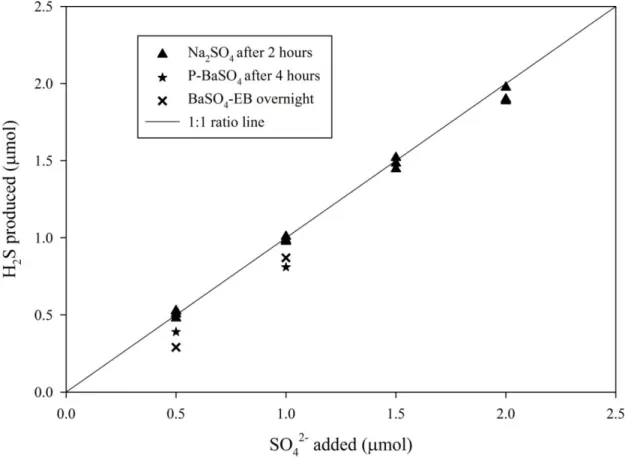
The final yields (yield after stopping the reaction) of Na2SO4, BaSO4-EB and
P-360
BaSO4 sample with different quantities of sulfate are plotted in Figure 5. Overall,
361
Na2SO4 was often 100 % reduced within two hours regardless the starting quantify, even
362
when the drying agent and the cryogenic trap were put in-line, while a 100 % yield for 363
BaSO4-EB, and P-BaSO4 was never observed even after overnight heating.
364
The different apparent reaction speeds and yields of H2S between Na2SO4, BaSO4
-365
EB and P-BaSO4 and the reducing solution likely reflect the effect of the sulfate salt
366
solubility. Na2SO4 is soluble in water, while BaSO4 has a very low solubility of 0.01
367
μmol/mL in water at 20 °C and less than 0.02 μmol/mL at ~120 °C [25]
. Given the small 368
volume of the reducing solution used (1 mL), there would be less than 2 % of the added 369
BaSO4 (if 1 μmol is added) dissolved. Our observations clearly point the sulfate ion
(SO42-) or sulfuric acid (H2SO4) as the reactive species with the reducing acids, i.e. the
371
sulfate salt has to be dissolved first in order to produce H2S. This explains why the
372
BaSO4 samples reacted so slowly with the reducing solution relative to Na2SO4. In
373
addition, if there is excess Ba2+ ion in the solution (due to dissolve of excess BaCl2 that
374
used to precipitate BaSO4 from Na2SO4), it will inhibit the dissolution of BaSO4 as the
375
dissociation equilibrium of BaSO4 will be pushed to the BaSO4 side, following Le
376
Chatelier’s principle. This probably explains why the reducing reaction with P-BaSO4
377
was faster than that with BaSO4-EB. To confirm the effect of excess Ba2+ ion on reducing
378
BaSO4, we made a few BaSO4 samples with extensively more Ba2+ by adding 1 mL 0.1
379
M BaCl2 to 1 mL 1 mM Na2SO4 solution. The samples were then directly dried without
380
removing supernatant from the precipitate. For these samples, after the reduction started, 381
we measure the trapping solution every hour for 7 hours, and no H2S was detected at all
382
times. 383
Therefore, the solubility of the sulfate salt largely affects the reducing speed and the 384
overall yield. We thus recommend to extract and convert sulfate in natural samples to 385
Na2SO4 whenever possible when applying our reducing solution. The extraction of
386
sulfate can be conducted using the IC method described in Geng et al. [26] or the anion-387
exchange resin method described in Le Gendre et al. [21]. In case of BaSO4 is
388
unavoidable, excess Ba2+ should be removed after precipitating BaSO4 with BaCl2, and
389
increasing the volume of reducing solution (e.g., to 10 mL instead of 1 mL) and/or 390
reaction time may improve the yield. 391
Isotope analysis of the standard materials 392
Since the overall goal of reducing sulfate to sulfide is to perform the four-sulfur 393
isotope analysis, we processed three different barium sulfate standards, IAEA-SO-5, 394
IAEA-SO-6 and NBS-127, which were equivalent to P-BaSO4 samples. Unfortunately
395
there are no international standards in sodium sulfate form and thus a strict comparison of 396
the isotopic precision of the reduction step for the two chemical forms is impossible. 397
Even a simple comparison of the salt from an identical sulfate batch is not possible as 398
BaSO4 reduction will never reach a full decomposition. The fluorination yield from Ag2S
399
to SF6 and sulfur isotopic composition measured from these standards are listed in Table
400
1. The fluorination yield ranges from 84.6 % to 113.5 % and is with an average of (101 ± 401
7.5) %, except one standard with a low yield of 26.1 %. Regardless the fluorination yield, 402
the measured isotopic values of all processed sulfate standards are statistically consistent 403
with their accepted values, including the one with relatively low yield (26.1 %). The 404
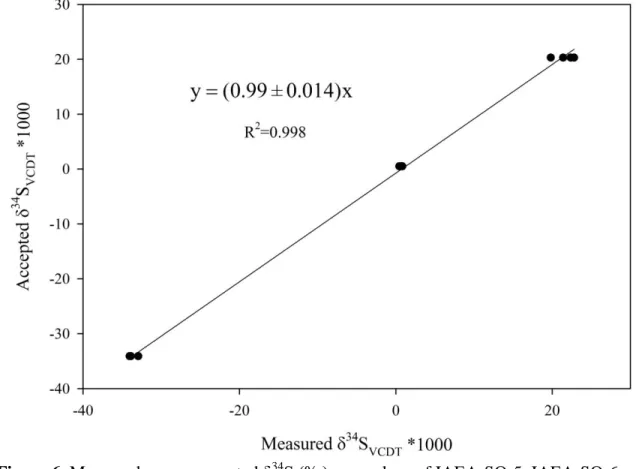
measured δ34S (‰)VCDT values of all standards with different quantities of sulfur (0.34 - 2
405
μmol in SF6) versus their accepted δ34S (‰)VCDT values are plotted in Figure 6. A
least-406
square linear regression gives a slope of (0.99 ± 0.01), suggesting a good reproducibility 407
and the conservation of sulfur isotopic composition during the reduction of sulfate to 408
sulfide using our reducing system, despite the reduction yields of these standard materials 409
were not 100%. This is not a surprise. In fact, if any sulfur isotope fractionation occurs 410
during the reduction, it would be between the solid BaSO4 and the dissolved part HSO4
-411
(the form of SO42- in concentrated acid solution), but not in the step(s) from SO42- to H2S
412
because the dissolved part is 100 % converted to H2S. Kusakabe and Robinson [27] found
413
that sulfur isotope fractionation between solid BaSO4 and the dissolved HSO4- in the
414
BaSO4- HSO4--H2O system is very small (less than 0.4 ‰ in the temperature range from
110 to 350 °C), which could explain why the solubility effect seems to not affect the 416
isotopic measurements. 417
For these standards, we also reported the Δ33S and they are all not distinct from what 418
can be expected from mass-dependent fractionation. However, we did not include the 419
Δ36
S values as when these standards were measured, the mass spectrometer had a high 420
and variable background at m/z = 131 up to 50 mV which made the δ36S values drifting 421
and not reliable. 422
CONCLUSION 423
We present a simple and reliable reducing method modified from the literature for the 424
conversion of sulfate to sulfide for four-sulfur isotope analysis. This system is simple to 425
set up, easy to replace and cheap to acquire and is made of sealed test tubes and PEEK 426
flowing lines (metal part, e.g. needle, in contact with the hot reducing solution is not 427
allowed). This method uses a reducing solution made of 100 mL 57 % HI and 13 g 428
NaH2PO2, and a very small amount (1 mL) reducing solution was demonstrated to be
429
able to completely reduce soluble sulfate salt (0.5 - 2.5 μmol) to sulfide within 2 hours, 430
minimizing the use of relatively expensive HI acid. In practice, nothing prohibits the 431
recycling of the used reducing solution by adding a few mgs of NaH2PO2 in order to
432
reduce I2 back to I- in a boiling flask if the used solution turns brown [14]. In addition, the
433
reduction train avoids distillation apparatus and multiple reduction trains can be operated 434
at a time, making it easier to process multiple samples simultaneously. The use of NaOH 435
as the trapping solution allows the assessment of reduction yield directly from UV 436
determination of HS- in the trapping solution. 437
This new approach was demonstrated to produce H2S very rapidly with a 100 %
438
recovery when soluble sulfate salt was used (e.g., Na2SO4), as opposed to BaSO4 for
439
which the kinetic was slow and conversion never reached 100 % even after overnight 440
reaction. However, despite the relatively low reduction yield for BaSO4, there was no
441
significant isotope fractionation effect induced by the reduction. As it is the dissolved 442
part of sulfate salt that reacts with the reducing solution, this method is best suitable for 443
natural samples containing soluble sulfate (e.g., aerosol, snow and ice core), which can be 444
extracted (e.g., by the resin method) and converted to Na2SO4. Barite precipitate method
445
for sulfate extraction and purification is not recommended due to the inhibition of the salt 446
solubility on the reduction speed and yield. In case of BaSO4 is the main form of sulfate
447
(e.g., barite), increasing the volume of the reducing solution and/or the reaction time may 448
improve the H2S yield with no guarantee of a complete conversion. While poor
449
conversion and fluorination yields do not seem to introduce isotope fractionations, poor 450
yield reduces the sensitivity of the method to sample sizes above few micromoles of 451
sulfate and may also have consequence on the mass-dependent slopes between sulfur 452
isotope ratios as 33S/32S ratio of the international standard have never been calibrated. 453
454 455
Acknowledgements 456
L. Geng was supported by a Marie Sklodowska Curie action from the EU (contract 457
number 700853). This work is also supported by JSPS KAKENHI Grant Numbers 458
17H06105 (N.Y.), 16H05884 (S.H.), and 17J08978 (S.I.). S. Hattori, and S. Ishino, were 459
supported by a Japan–France Research Cooperative Program (SAKURA and CNRS) of 460
MEXT, Japan. J. Savarino thank the CNRS/INSU (PRC program 207394) and the PH-461
SAKURA program of the French Embassy in Japan (project 31897PM) for financial 462
support for this collaboration. This work has also been supported by a grant from Labex 463
OSUG@2020 (Investissements d’avenir – ANR10 LABX56). This work was partially 464
supported by the ANR FOFAMIFS project, grant ANR—14-CE33-0009-01 of the French 465
Agence Nationale de la Recherche. 466
468 469
References 470
[1] D. E. Canfield. Biogeochemistry of Sulfur Isotopes. Reviews in Mineralogy and Geochemistry 471
2001, 43, 607.
472
[2] J. Farquhar, H. M. Bao, M. Thiemens. Atmospheric influence of Earth's earliest sulfur cycle. 473
Science 2000a, 289, 756.
474
[3] G. Feulner. The Faint Young Sun Problem. Rev. Geophys. 2012, 50. 475
[4] J. Farquhar, J. Savarino, T. L. Jackson, M. H. Thiemens. Evidence of atmospheric sulphur in the 476
martian regolith from sulphur isotopes in meteorites. Nature 2000b, 404, 50. 477
[5] J. Cole-Dai, D. Ferris, A. Lanciki, J. Savarino, M. Baroni, M. H. Thiemens. Cold decade (AD 478
1810-1819) caused by Tambora (1815) and another (1809) stratospheric volcanic eruption. 479
Geophys. Res. Lett. 2009, 36.
480
[6] J. Savarino, A. Romero, J. Cole-Dai, S. Bekki, M. H. Thiemens. UV induced mass-independent 481
sulfur isotope fractionation in stratospheric volcanic sulfate. Geophys. Res. Lett. 2003, 30. 482
[7] M. Baroni, M. H. Thiemens, R. J. Delmas, J. Savarino. Mass-independent sulfur isotopic 483
compositions in stratospheric volcanic eruptions. Science 2007, 315, 84. 484
[8] A. Lanciki, J. Cole-Dai, M. H. Thiemens, J. Savarino. Sulfur isotope evidence of little or no 485
stratospheric impact by the 1783 Laki volcanic eruption. Geophys. Res. Lett. 2012, 39. 486
[9] N. Wu, J. Farquhar, H. Strauss, S.-T. Kim, D. E. Canfield. Evaluating the S-isotope fractionation 487
associated with Phanerozoic pyrite burial. Geochim Cosmochim Ac 2010, 74, 2053. 488
[10] P. Sansjofre, P. Cartigny, R. I. F. Trindade, A. C. R. Nogueira, P. Agrinier, M. Ader. Multiple 489
sulfur isotope evidence for massive oceanic sulfate depletion in the aftermath of Snowball Earth. 490
Nat Commun 2016, 7.
491
[11] S. Ono, B. Wing, D. Rumble, J. Farquhar. High precision analysis of all four stable isotopes of 492
sulfur (32S, 33S, 34S and 36S) at nanomole levels using a laser fluorination isotope-ratio-493
monitoring gas chromatography–mass spectrometry. Chem Geol 2006, 225, 30. 494
[12] Y. Ueno, S. Aoyama, Y. Endo, F. Matsu'ura, J. Foriel. Rapid quadruple sulfur isotope analysis at 495
the sub-micromole level by a flash heating with CoF3. Chem Geol 2015, 419, 29. 496
[13] G. L. Arnold, B. Brunner, I. A. Müller, H. Røy. Modern applications for a total sulfur reduction 497
distillation method - what’s old is new again. Geochem T 2014, 15, 4. 498
[14] M. C. van Grondelle, F. van de Craats, J. D. van der Laarse. Microcoulometric determination of 499
total inorganic sulphur in water by a hydroiodic acid reduction method. Anal Chim Acta 1977, 92, 500
267. 501
[15] K. Toshiyasu, T. Tomoo, Y. Yooko, K. Ikuko. Tin (II)-Strong Phosphoric Acid. A New Reagent 502
for the Determination of Sulfate by Reduction to Hydrogen Sulfide. B Chem Soc Jpn 1955, 28, 503
641. 504
[16] H. G. Thode, J. Monster, H. B. Dunford. Sulphur isotope geochemistry. Geochim Cosmochim Ac 505
[17] J. Forrest, L. Newman. Silver-110 microgram sulfate analysis for the short time resolution of 507
ambient levels of sulfur aerosol. Anal. Chem. 1977, 49, 1579. 508
[18] J. B. Davis, F. Lindstrom. Spectrophotometric microdetermination of sulfate. Anal. Chem. 1972, 509
44, 524.
510
[19] G. Norwitz. Spectrophotometric determination of sulphate in propellents and nitrocellulose. 511
Analyst 1971, 96, 494.
512
[20] L. Gustafsson. Determination of ultramicro amounts of sulphate as methylene blue—I: The colour 513
reaction. Talanta 1960, 4, 227. 514
[21] E. Le Gendre, E. Martin, B. Villemant, P. Cartigny, N. Assayag. A simple and reliable anion-515
exchange resin method for sulfate extraction and purification suitable for multiple O- and S-516
isotope measurements. Rapid Commun. Mass Spectrom. 2017, 31, 137. 517
[22] E. A. Guenther, K. S. Johnson, K. H. Coale. Direct Ultraviolet Spectrophotometric Determination 518
of Total Sulfide and Iodide in Natural Waters. Anal. Chem. 2001, 73, 3481. 519
[23] R. J. Williams. Determination of inorganic anions by ion chromatography with ultraviolet 520
absorbance detection. Anal. Chem. 1983, 55, 851. 521
[24] D. A. Yang, G. Landais, N. Assayag, D. Widory, P. Cartigny. Improved analysis of micro- and 522
nanomole-scale sulfur multi-isotope compositions by gas source isotope ratio mass spectrometry. 523
Rapid Commun. Mass Spectrom. 2016, 30, 897.
524
[25] C. W. Blount. Barite solubilities and thermodynamic quantities up to 300 oC and 1400 bars. Am 525
Mineral 1977, 9.
526
[26] L. Geng, A. J. Schauer, S. A. Kunasek, E. D. Sofen, J. Erbland, J. Savarino, D. J. Allman, R. S. 527
Sletten, B. Alexander. Analysis of oxygen-17 excess of nitrate and sulfate at sub-micromole levels 528
using the pyrolysis method. Rapid Commun. Mass Spectrom. 2013, 27, 2411. 529
[27] M. Kusakabe, B. W. Robinson. Oxygen and sulfur isotope equilibria in the BaSO4-HSO4−-H2O
530
system from 110 to 350°C and applications. Geochim Cosmochim Ac 1977, 41, 1033. 531
[28] S. Halas, J. Szaran. Improved thermal decomposition of sulfates to SO2 and mass spectrometric
532
determination of δ34S of IAEA SO-5, IAEA SO-6 and NBS-127 sulfate standards. Rapid Commun.
533 Mass Spectrom. 2001, 15, 1618. 534 535 536 537 538 539 540 541
Table 1. Fluorination yield and the measured isotopic values of the sulfate standards 542
processed with the protocol described in this study. 543
544 545
Figure Legends: 546
Figure 1. A sketch of the reduction train. a: block heater and the reduction tube; b1 & b2: 548
gas washing tubes; c: H2S collection tube.
549 550
Figure 2. A sketch of the flow system containing multiple reaction trains. "T1...Tn" 551
indicate the reduction trains assembled. 552
553
Figure 3. a. Percents of H2S and HS- in solutions with different pH calculated with pKa1
554
of 7.0 and pKa2 of 19, the vertical dashed line indicates the pH of the trapping solution
555
used in this study; b. Absorbance spectra of Na2S working standards and trapping
556
solutions after 1 hour collection, the vertical dashed line indicates the absorbance peak of 557
230 nm; c. a three-day averaged calibration curve for H2S quantification.
558 559
Figure 4. Time-resolved yields of H2S from the reduction of dry Na2SO4, BaSO4-EB
560
(BaSO4 with excess Ba2+) and P-BaSO4 (pure BaSO4).
561 562
Figure 5. Yields of H2S from the reduction of Na2SO4, BaSO4-EB (BaSO4 with excess
563
Ba2+) and P-BaSO4 (pure BaSO4) at different sulfate quantities at the time the reaction is
564
stopped. 565
566
Figure 6. Measured versus accepted δ34S (‰)VCDT values of IAEA-SO-5, IAEA-SO-6
567
and NBS-127. The reduction of these sulfate standards to H2S were conducted using the
568
protocol described in this study. 569
570 571
Table 1. Fluorination yield and measured isotopic ratios of the sulfate standards 572
processed with this system. The values of Δ36S are not reported as when the samples were 573
measured the mass spectrometer had a high background of mass 131 (15 to 50 mV) and 574
thus the Δ36S data were discarded. The initial mass of the BaSO4 standards were only
575
approximately weighed, and the mass(es) in Ag2S form were obtained according to the
576
measured H2S production after ~ 5 hours of reduction.
577 Standards Ag2S (mg) SF6 yield (%) Δ33 S values vs CDT (‰) δ 34 S values vs CDT (‰) Accepted δ34 Sa values vs CDT (‰) NBS-127 0.20 101.7 0.015 0.025 ± 0.010 19.8 21.6 ± 1.3 20.3 ± 0.5 0.10 105.3 0.018 22.4 0.08 93.7 0.033 22.8 0.12 98.2 0.034 21.4 IAEA-SO-5 0.51 104.6 0.063 0.097 ± 0.071 0.7 0.7 ± 0.2 0.5 ± 0.5 0.52 101.6 0.052 0.7 0.82 26.1 0.203 0.8 0.21 99.3 0.067 0.5 IAEA-SO-6 0.41 113.5 0.077 0.086 ± 0.020 -34.0 -33.5 ± 0.6 -34.1 ± 0.5 0.46 106.9 0.065 -33.9 0.13 102.0 0.110 -32.9
0.15 84.6 0.090 -32.9 a. Accepted values are taken from Halas and Szaran [28]. 578 579 580 581 582 583 584 585 586 587 588 589 590 591 592 593 594 595 596 597 598 599 600 601 602 603
Figure 1. A sketch of the reduction train. a: block heater and the reduction tube; b1 & b2: 604
gas washing tubes; c: H2S collection tube.
605 606 607 608 609 610 611 612 613 614 615 616 617 618 619
620 621 622 623 624 625 626 627 628 629 630 631 632
Figure 2. A sketch of the flow system containing multiple reaction trains. "T1...Tn" 633
indicate the reduction trains assembled. 634
635 636
Figure 3. a. Percents of H2S and HS- in solutions with different pH calculated with pKa1
637
of 7.0 and pKa2 of 19, the vertical dashed line indicates the pH of the trapping solution
638
used in this study; b. Absorbance spectra of Na2S working standards and trapping
solutions after 1 hour collection, the vertical dashed line indicates the absorbance peak of 640
230 nm; c. a three-day averaged calibration curve for H2S quantification.
641 642 643 644 645 646 647 648 649 650 651 652 653
Figure 4. Time-resolved yields of H2S from the reduction of dry Na2SO4, BaSO4-EB
654
(BaSO4 with excess Ba2+ ) and P-BaSO4 (pure BaSO4).
655 656 657 658 659 660 661 662 663 664 665
666
Figure 5. Yields of H2S from the reduction of Na2SO4, BaSO4-EB (BaSO4 with excess
667
Ba2+) and P-BaSO4 (pure BaSO4) at different sulfate quantities at the time the reaction is
668
stopped. 669
670 671
672
Figure 6. Measured versus accepted δ34S (‰)VCDT values of IAEA-SO-5, IAEA-SO-6
673
and NBS-127. The reduction of these sulfate standards to H2S were conducted using the
674
protocol described in this study. 675
676 677