HAL Id: hal-01423655
https://hal.archives-ouvertes.fr/hal-01423655
Submitted on 9 Jan 2017
HAL is a multi-disciplinary open access
archive for the deposit and dissemination of
sci-entific research documents, whether they are
pub-lished or not. The documents may come from
teaching and research institutions in France or
abroad, or from public or private research centers.
L’archive ouverte pluridisciplinaire HAL, est
destinée au dépôt et à la diffusion de documents
scientifiques de niveau recherche, publiés ou non,
émanant des établissements d’enseignement et de
recherche français ou étrangers, des laboratoires
publics ou privés.
Contour-Based Depth Coding: A Subjective Quality
Assessment Study
Marco Calemme, Marco Cagnazzo, Béatrice Pesquet-Popescu
To cite this version:
Marco Calemme, Marco Cagnazzo, Béatrice Pesquet-Popescu. Contour-Based Depth Coding: A
Subjective Quality Assessment Study. IEEE International Symposium on multimedia (ISM 2015),
Dec 2015, Miami, FL, United States. pp.295 - 300, �10.1109/ISM.2015.34�. �hal-01423655�
Contour-based depth coding: a subjective quality assessment study
Marco Calemme, Marco Cagnazzo, Senior Member, IEEE, and Beatrice Pesquet-Popescu, Fellow, IEEE Telecom Paristech, 75634 Paris, France
Email:{calemme, cagnazzo, beatrice.pesquet}@telecom.paristech.fr
Abstract—Multi-view video plus depth is emerging as the most flexible format for 3D video representation, as witnessed by the current standardization efforts by ISO and ITU. The depth information allows synthesizing virtual view points, and for its compression various techniques have been proposed. It is generally recognized that a high quality view rendering at the receiver side is possible only by preserving the contour information since distortions on edges during the encoding step would cause a sensible degradation on the synthesized view and on the 3D perception. As a consequence recent approaches include contour-based coding of depths. However, the impact of contour-preserving depth-coding on the perceived quality of synthesized images has not been conveniently studied. Therefore in this paper we make an investigation by means of a subjective study to better understand the limits and the potentialities of the different techniques.
Our results show that the contour information is indeed relevant in the synthesis step: preserving the contours and coding coarsely the rest typically leads to images that users cannot tell apart from the reference ones, even at low bit rate. Moreover, our results show that objective metrics that are commonly used to evaluate synthesized images may have a low correlation coefficient with MOS rates and are in general not consistent across several techniques and contents.
Keywords-perceived quality, quality assessment, 3D video, multiple-views-plus-depth, contour coding, elastic curves.
I. INTRODUCTION
The video-plus-depth representation for multi-view video sequences (MVD) consists of several views of the same scene with their associated depth information, which is the distance from the camera for every point in the view [1]. Depth information allows synthesizing virtual view points, for such applications as 3D television and free-viewpoint video, but it requires ad-hoc compression techniques, since those developed for texture images are not well suited for depths. As a consequence, MVD compression has attracted a huge amount of research effort in the last years, while ISO and ITU are jointly developing an MVD coding standard [2]. A key point in depth images compression is that they are not meant to be visualized but only used for rendering of virtual views. Various techniques have been specifi-cally proposed to code the depth information associated to the views and recent approaches include contour-based and object-based coding of depths. This approach seems reasonable because the properties of depth maps differ greatly from the ones of texture images. Objects within a depth map are usually arranged along planes in different
perspectives; as a consequence there are areas of smoothly varying levels, separated by sharp edges which correspond to object boundaries. It is generally recognized that a high quality view rendering at the receiver side is possible only by preserving the contour information [3], [4], [5], since distortions on edges during the encoding step would cause a sensible degradation on the synthesized view and on the 3D perception. The typical artifact consists in fact in a slight displacement of an object, with clear sharp edges. This leads to low scores for objective metrics like PSNR, which are very sensitive to this kind of errors, and at the same time the visual quality is claimed to be high. We want to investigate this claim by conducting for the first time a subjective quality assessment test to compare an object-based technique and a hybrid block-based techniques for the coding of depth maps. In a previous work we proposed a technique using elas-tic deformation of curves to losslessly encode the object contours, and shape-adaptive wavelet to represent the inner parts of the objects [6]. In a practical bit-rate range, this technique proved to be competitive with HEVC [7], state-of-the-art for hybrid block-based coding techniques, in terms of objective quality metrics (PSNR and SSIM). At that time, only very preliminary subjective evaluations were performed for this technique. Just like other contour-based methods, this techniques present totally different artifacts in synthesized images with respect to HEVC, and their impact is difficult to evaluate with classical metrics like the PSNR. We have thus set up a subjective test to make a quality assessment of synthesized views.
II. CODING OF DEPTH MAPS
Lossless contour coding using elastic curves. Srivastava
et al. [8] introduced a framework to model a continuous
evolution of elastic deformations between two reference curves. According to the interpretation of the elastic metric, it is relatively easy to compute the geodesic between two curves: it consists in a continuous set of deformations that transforms one curve into another with a minimum amount of stretching and blending, and independently from their absolute position, scale, rotation and parametrization. The referred technique thus interpolates between shapes and makes the intermediary curves retain the global shape structure and the important local features such as corners and bends. An example of the geodesic connecting two
curves is shown in Fig. 1. We show in black two contours extracted from a MVD sequence, corresponding to views 1 and 8. The curves in red are the contours extracted from the intermediate views, while in dashed blue we show a sampling of the elastic geodesic computed between the two extreme curves. The elastic deformations along the geodesic reproduce very well the deformations related to a change of viewpoint or a temporal evolution of an object in a sequence, given the initial and final shapes.
˜b0.2
i0 b3 i1
˜bs
bt
Figure 1. Geodesic path of elastic deformations ˜bs from the curve i0
to i1(in dashed blue lines). b3is one of the contours btextracted from
the intermediate frames between the two reference ones, a good matching elastic curve ˜b0.2along the path is highlighted.
Supposing that the encoder and the decoder share a rep-resentation of the initial and final shape, they can reproduce exactly the same geodesic path between them. Then, the decoder will use a suitable point of the geodesic, i.e. one of the dashed curves in Fig. 1, as context [9] to encode an intermediary contour (one of the solid curves in the same figure). The encoder will only have to send a value in[0, 1] to let the decoder identify this curve. The lossless coding of the contour is performed through an arithmetic coder, and the input symbol probability distribution is modified on the fly according to the elastic prediction [6].
Object-based depth maps coding technique. A segmen-tation map of the scene with different objects can be coded with our lossless contour coding technique, and this map can be used in conjunction with an object-based coding tech-nique to code the depth images. The method proposed in [6] relies on the SA (Shape Adaptive) Wavelet Transform [10], followed by SA SPIHT (Set Partitioning In Hierarchical Trees) [11], followed by an arithmetic coder for the SPIHT symbols (memoryless, without context). This provides an entirely Intra technique for the inner part of the objects. From now on we will refer to this technique as “CC”, contour coding.
Advantages of lossless coding. The validity of the object-based approach is suggested by the relevance of the contour information in the synthesis step. A minimum bit budget is needed for a lossless representation of contours and this initial cost may be a relevant fraction of the total rate
beergarden (1920×1080) lovebird (1024×768)
mobile (720×536)
Figure 3. Contents of the different sequences and their resolution.
dedicated to the depth map. One question that arises is whether the benefits of a lossless contour will actually be perceived as relevant against its bit-rate cost. We investigated on this subject by simply skipping the lossless coding part in our coding technique and using the elastic prediction to directly generate the segmentation map to feed the object-based coder. We rely on the SA SPIHT block to correct the possible imprecision of the coded depth map.
This technique allows the rates to be lowered dramatically, however the quality of the synthesized images obtained from the depths compressed with this simple technique must be carefully evaluated. From now on we will refer to this technique as “NR”, no refinement.
A concise scheme of the two methods is shown in Fig. 2. As inputs we have a depth image and its extracted contours, plus two reference contours to perform the elastic interpolation. First the elastic prediction is performed (EP block); then in case of method CC it is used in conjunction with the original contours of the depth image to perform the lossless contour coding (LLCC block); the depth image in input, with the coded (method CC) or predicted contours (method NR), arrange a segmentation map (Segm. block), and its objects are coded with a SA wavelet transform (SA WT block), followed by SA SPIHT.
III. PRODUCTION OF TEST MATERIAL
The multiview sequences beergarden (provided by Philips), lovebird (ETRI/MPEG Korea Forum) and mobile (Philips) have been used for test, an example for each content is shown in Fig. 3. We produced the test material by
content frames view L goal view R crop
beergarden 54-58 5 5.25 6 840×896
lovebird 1-5 6 7 8 1024×768
mobile 43-47 3 3.75 4 720×536 Table I
FRAMES USED FOR COMPRESSION AND SYNTHESIS FOR EACH SEQUENCE.
Depth Image SA WT SA SPIHT Segm. Original Contour LL CC objects NR CC NR CC EP Reference Contours
Figure 2. Coding scheme for the techniques CC (Contour Coding) and NR (No Refinement). The block EP performs the elastic prediction and takes as input two reference contours; the LLCC block performs the lossless contour coding using an original contour and its elastic prediction as context; the Segm. block arranges the segmentation map of the depth image with the coded or predicted contours, and it passes the objects of the segmentation map to the SA WT block, which performs the shape adaptive wavelet transform, followed in its turn by the shape adaptive SPIHT, represented by the SA SPIHT block.
compressing the selected images using the techniques CC, NR, and HEVC. For HEVC, used in mode Intra, we have chosen as QPs: 27, 38, 44, 51. QP 51 is the maximum level of compression allowed, corresponding to the smallest bit-rate for HEVC. For CC, the use of SA-SPIHT allows to chose the exact bit-rate, so we have chosen the lowest possible rate and the bit-rates corresponding to QPs 51, 44, and 38. And as for NR, we have chosen again the lowest possible rate and other two to match the low rates of the two other techniques. Details about the frames and views used for each sequence are reported in Tab. I. Moreover the whole dataset is available on the authors’ website [12].
The use of the technique NR for this test is important to evaluate the effects of contour coding on the synthesized image. We will show in fact that the precision of the contour leads to remarkable gains in terms of perceived quality. Moreover we used this technique at a very low bit rate as the reference for the “very annoying” quality, for the evident artifacts that it produces on the synthesized image. If the predicted contour lies outside the object and the interior part is coded very coarsely, we will produce a change in the geometry of the scene, that will result in a ”gap” in between the objects of the synthesized image.
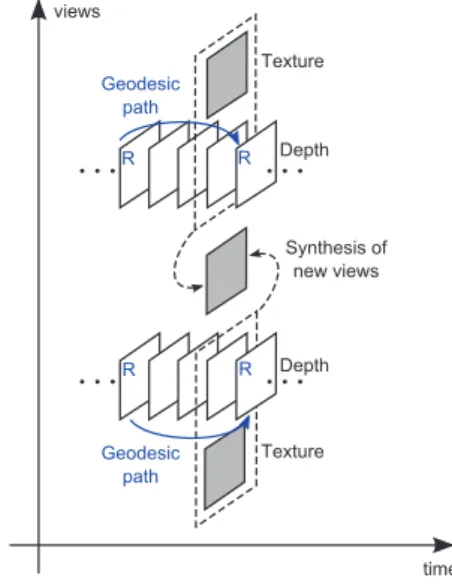
Once the depths are compressed for two views, we used them to generate new synthetic views in between the two with the Depth-Image-Based Rendering (DIBR) software [13], as shown in Fig. 4. The use of synthesized images for the test is justified by the plausible scenario of Free Viewpoint Video (FVV) [14].
To perform the elastic prediction we need two reference curves, be them from two different views or two different time instants of the same view. These curves represent a sort of “intra” curves and they are coded independently from the others (and losslessly, for the techniques CC and NR). The gap or distance between the two reference curves along the view or the time axis affects the final rate: the accuracy of the prediction decreases with the distance, but at the same time a wider gap between the two reference curves allows a lower bit-rate. The distance of the reference curves for the elastic prediction has to be chosen for the techniques
CC and NR. To better illustrate this concept, in Fig. 4 we marked with a blue R the frames used to extract a reference curve, a blue arrow representing the geodesic path from one to another, and the distance from a reference curve to the other is defined as the number of frames that exist in between the two. For both the techniques the chosen value is three frames in between the two reference ones and we perform the elastic prediction along the time axis. The synthesis is then performed using the compressed depths of two views and their associated texture images.
Regarding the reference images, the unavailability of intermediate views and the presence of evident synthesis artifacts lead us to the use of synthesized reference im-ages, obtained with the original uncompressed depths, as suggested in [15]. Geodesic path R R R R Depth Depth Texture Texture views time Synthesis of new views Geodesic path
Figure 4. Elastic prediction and synthesis scheme.
IV. EXPERIMENTAL SETUP
Test environment. The images were displayed on a DELL P2210 screen, which has a resolution of 1680 × 1050 pixels. We set up a test space with mid gray non reflective
background, isolated from external sources of light, as recommended in [16], [17]. To avoid direct light sources in the field of view of the user, except for the screen, we placed a lamp at 6500K color temperature behind the screen to provide ambient illumination. The resulting ambient light measured in front of the screen, when this was off, was approximately of 10 cd/m2
. Viewers participated to test sessions one at the time, sitting in front of the screen at a distance of its diagonal approximately, which corresponds to an angular resolution of about 35 pixels per degree. Test methodology. The subjective evaluation has been performed following the Double Stimulus Impairment Scale (DSIS) methodology [16]. For each “round” a pair of images has been proposed to the user, stimuli A and B, in which the stimulus A was always the reference, and stimulus B was the image to be evaluated. The reference image is obtained using uncrompressed depths in the synthesis step, while the image to be evaluated is obtained with compressed depths. The viewer was informed of the presence of the reference image in the pair, and was asked to rate the quality of the second image with respect to the first one, using a continuous scale ranging from 0 to 100, in which five ranges were associated with five distinct adjectives (“Very annoying”, “Annoying”, “Slightly annoying”, “Perceptible”, “Imperceptible”).
Each image was shown for 7 seconds and preceded by a gray screen to indicate the stimulus (A or B) for 1.5 seconds. Every round was composed of: stimulus A, stimulus B, stimulus A, stimulus B, voting screen. The voting screen is a pop-up window on mid gray background. The voting window contains a continuous slider with the five adjectives on its side, and a text box that reports the rating value and again the correspondent adjective with a larger font size to be more evident.The pairs of stimuli were presented in random order. The whole test took around 22 minutes to complete for each user.
V. RESULTS
A panel of twenty people took part in our test, 6 women and 14 men, aged from 23 to 32, with an average of 27.65 years. The subjects reported visual acuity or if needed wore corrective glasses.
The subjective scores were screened in order to detect and remove possible outliers, subjects whose scores differ greatly from the others’. We followed the procedure described in [16] for the DSIS test methodology. As we have not done any assumption on the distribution characteristics, values outside the interquartile range (from the 25% and the 75% percentiles) for more than 1.5 times are labeled outliers, and if there is an incidence of outliers in a subject’s score of more than the 10%, he is considered an outlier and his scores are not taken in account. In our results three subjects have been marked as outliers and their scores have been discarded.
After the outlier removal, we verified that for each stim-ulus the score distribution is unimodal and we computed
the Mean Opinion Scores (MOS), along with the 95% confidence interval (CI), with the assumption that the scores are following a t-Student distribution.
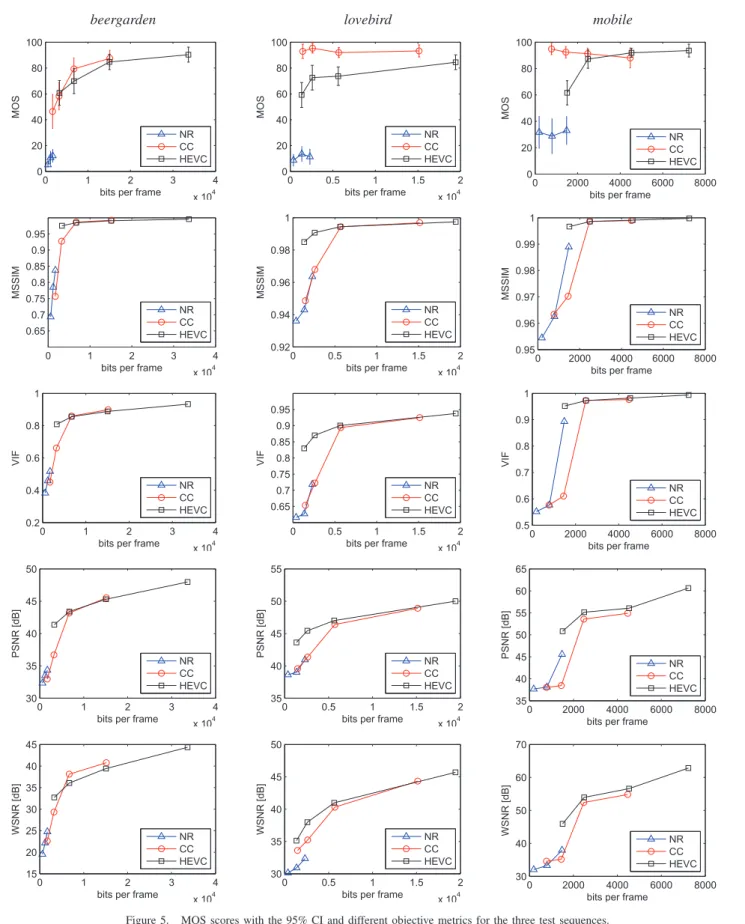
Objective measurements and perceived quality. In addi-tion to the MOS, the images were also evaluated through dif-ferent objective metrics. We considered pixel-based metrics: Peak to-Noise Ratio (PSNR) and Weighted Signal-to-Noise Ratio (WSNR) [18]; as well as non-pixel-based metrics: Multi-scale Structural Similarity (MSSIM) [19] and Visual Information Fidelity (VIF) [20]. In Fig. 5 the results of our subjective test and all the considered objective metrics are reported. Each column refers to a sequence, and each row to a metric. In particular, the computed MOS scores with their 95% CI are reported in the first row.
As we can see in Fig. 5, HEVC exhibits very regular trends in its MOS scores. The resulting visible artifacts are mainly edge fragmentation and blocking effect, which disappear as the bit-rate increases. MOS scores of HEVC generally vary from the “perceptible” to the “imperceptible” range. The technique CC exhibits in general very high scores compared to the other techniques (most of its scores are in fact in the “Imperceptible” range), thus the coding of the contours is generally worth its cost for the perceived quality of the resulting synthesized images. This is especially true if we compare the MOS scores of CC to the ones of NR at the same bit-rate: imperfections in the contour can lead to annoying artifacts and make the final quality drop, even if they are diminished by a finer coding of the interior part. Moreover we see that at low bit-rates a perfect contour and a coarsely coded interior part tend to lead to an excellent perception of the synthesized image. In contrast to this assertion we find slightly lower scores at low bit-rates for the content beergarden, where the proximity of the objects to the camera demands a less coarse coding of the interior part to reach a very high level of perceived quality. Dealing with objective metrics, again in Fig. 5, at low bit-rates HEVC generally shows better results. Pixel-based metrics like PSNR are in fact very sensitive to the most prominent artifact produced by the CC coding technique: the different geometry of the scene, given by the coarsely coded interior part, results in a slightly different disposition of the objects, with respect to the image synthesized from uncompressed depths. To a human observer it can be very difficult to tell apart the two images, but even the shifting of few pixels for an object or the background can cause a low PSNR. On the other hand, in terms of PSNR, the technique NR proves to be competitive with the technique CC. The explanation lies in the fact that very localized errors, especially if they affect the shape of the objects, are perceived as annoying by a human observer, and the tested objective metrics are not able to take this effect into account. Apart from PSNR, also the more refined objective metrics WSNR, MSSIM and VIF produce scores that can differ
beergarden lovebird mobile 0 1 2 3 4 x 10⁴ 0 20 40 60 80 100
bits per frame
MO S NR CC HEVC 0 0.5 1 1.5 2 x 10⁴ 0 20 40 60 80 100
bits per frame
MO S NR CC HEVC 0 2000 4000 6000 8000 0 20 40 60 80 100
bits per frame
MO S NR CC HEVC 0 1 2 3 4 x 10⁴ 0.65 0.7 0.75 0.8 0.85 0.9 0.95
bits per frame
MSSI M NR CC HEVC 0 0.5 1 1.5 2 x 10⁴ 0.92 0.94 0.96 0.98 1
bits per frame
MSSI M NR CC HEVC 0 2000 4000 6000 8000 0.95 0.96 0.97 0.98 0.99 1
bits per frame
MSSI M NR CC HEVC 0 1 2 3 4 x 10⁴ 0.2 0.4 0.6 0.8 1
bits per frame
VI F NR CC HEVC 0 0.5 1 1.5 2 x 10⁴ 0.65 0.7 0.75 0.8 0.85 0.9 0.95
bits per frame
VI F NR CC HEVC 0 2000 4000 6000 8000 0.5 0.6 0.7 0.8 0.9 1
bits per frame
VI F NR CC HEVC 0 1 2 3 4 x 10⁴ 30 35 40 45 50
bits per frame
PSN R [ d B] NR CC HEVC 0 0.5 1 1.5 2 x 10⁴ 35 40 45 50 55
bits per frame
PSN R [ d B] NR CC HEVC 0 2000 4000 6000 8000 35 40 45 50 55 60 65
bits per frame
PSN R [ d B] NR CC HEVC 0 1 2 3 4 x 10⁴ 15 20 25 30 35 40 45
bits per frame
W SN R [ d B] NR CC HEVC 0 0.5 1 1.5 2 x 10⁴ 30 35 40 45 50
bits per frame
W SN R [ d B] NR CC HEVC 0 2000 4000 6000 8000 30 40 50 60 70
bits per frame
W SN R [ d B] NR CC HEVC
overall beergarden lovebird mobile NC CC HEVC MSSIM 0.62 0.97 0.52 0.46 0.75 0.13 0.80 VIF 0.55 0.97 0.50 0.37 0.52 0.02 0.79 PSNR 0.56 0.96 0.50 0.35 0.52 0.15 0.75 WSNR 0.68 0.99 0.63 0.45 0.80 0.14 0.79 Table II
SPEARMAN CORRELATION COEFFICIENTS(IN MODULUS)CALCULATED FOR EACH CONTENT AND TECHNIQUE.
greatly from the scores produced during the subjective test. The table II reports the Spearman correlation coefficients (in modulus) calculated for each content and technique. The metrics with the highest overall correlation coefficient are WSNR (0.68) and MSSIM (0.62), followed by the PSNR (0.56) and finally the VIF (0.55). While dealing with some of the techniques or some of the contents these objective metrics could provide a good subjective MOS prediction, but they are not consistent across several techniques and con-tents, in particular they showed a low correlation coefficient for the method CC.
VI. CONCLUSIONS
This paper addresses the issue of evaluating the effects of contour-preserving compression techniques on synthesized images by means of a subjective test. We compared, with subjective results and objective metrics, HEVC, the tech-nique proposed in [6], and the presented simple techtech-nique NR. The positive impact of contour preserving depth coding was confirmed by our study. Moreover by the comparison of subjective results and objective metrics it is also clear that the quality assessment of synthesized images in MVD can still present unresolved problems: algorithms can introduce non-perceptible or non-annoying artifacts and commonly used objective metrics can assign low scores for them even if for a human observer the degradation is relatively acceptable. Further experiments should be conducted to take into account also temporal artifacts and 3D video perception.
REFERENCES
[1] F. Dufaux, B. Pesquet-Popescu, and M. Cagnazzo, Eds.,
Emerging technologies for 3D video: content creation, cod-ing, transmission and rendering. Wiley, 2013.
[2] G. J. Sullivan, J. M. Boyce, Y. Chen, J.-R. Ohm, C. A. Segall, and A. Vetro, “Standardized extensions of high efficiency video coding (HEVC),” Selected Topics in Signal Processing,
IEEE Journal of, vol. 7, no. 6, pp. 1001–1016, 2013. [3] J. Gautier, O. Le Meur, and C. Guillemot, “Efficient depth
map compression based on lossless edge coding and diffu-sion,” in Proceed. of Pict. Cod. Symp., Krak´ow, Poland, May 2012, pp. 81–84.
[4] I. Daribo, G. Cheung, and D. Florencio, “Arithmetic edge coding for arbitrarily shaped sub-block motion prediction in depth video compression,” in Proceed. of IEEE Intern. Conf.
Image Proc. Orlando, FL, USA: IEEE, Sep. 2012, pp. 1541 – 1544.
[5] G. Shen, W.-S. Kim, S. K. Narang, A. Ortega, J. Lee, and H. C. Wey, “Edge-adaptive transforms for efficient depth map coding,” in Proceed. of Pict. Cod. Symp., 2010.
[6] M. Calemme, M. Cagnazzo, and B. Pesquet-Popescu, “Lossless contour coding using elastic curves in multiview video plus depth,” APSIPA Transactions on Signal and
Information Processing, vol. 3, 2014. [Online]. Available: http://journals.cambridge.org/article S2048770314000201 [7] G. Sullivan, J.-R. Ohm, W.-J. Han, and T. Wiegand,
“Overview of the high efficiency video coding (HEVC) standard,” vol. 22, no. 12, pp. 1649–1668, 2012.
[8] A. Srivastava, E. Klassen, S. H. Joshi, and I. H. Jermyn, “Shape analysis of elastic curves in euclidean spaces,” IEEE
Trans. Pattern Anal. Machine Intell., vol. 33, no. 7, pp. 1415– 1428, Sep. 2010.
[9] M. Cagnazzo, M. Antonini, and M. Barlaud, “Mutual information-based context quantization,” Signal Proc.: Image
Comm. (Elsevier Science), vol. 25, no. 1, pp. 64–74, Jan. 2010.
[10] S. Li and W. Li, “Shape-adaptive discrete wavelet transforms for arbitrarily shaped visual object coding,” IEEE Trans.
Circuits Syst. Video Technol., pp. 725–743, Aug. 2000. [11] M. Cagnazzo, G. Poggi, L. Verdoliva, and A. Zinicola,
“Region-oriented compression of multispectral images by shape-adaptive wavelet transform and SPIHT,” in Proceed.
of IEEE Intern. Conf. Image Proc., vol. 4, Singapore, Oct. 2004, pp. 2459–2462.
[12] [Online] http://calemme.wp.mines-telecom.fr/?p=29 [13] C. Fehn, “Depth-image-based rendering (DIBR),
compres-sion, and transmission for a new approach on 3D-TV,” in
Electronic Imaging 2004. International Society for Optics and Photonics, 2004, pp. 93–104.
[14] E. Bosc, R. Pepion, P. Le Callet, M. Koppel, P. Ndjiki-Nya, M. Pressigout, and L. Morin, “Towards a new quality metric for 3-d synthesized view assessment,” Selected Topics
in Signal Processing, IEEE Journal of, vol. 5, no. 7, pp. 1332– 1343, 2011.
[15] N. A. El-Yamany, K. Ugur, M. M. Hannuksela, and M. Gab-bouj, “Evaluation of depth compression and view synthesis distortions in multiview-video-plus-depth coding systems,” in 3DTV-Conference: The True Vision-Capture, Transmission
and Display of 3D Video (3DTV-CON), 2010. IEEE, 2010, pp. 1–4.
[16] Methodology for the subjective assessment of the quality of
television pictures, ITU-R Recomm. BT.500, January 2012. [17] General viewing conditions for subjective assessment of
qual-ity of SDTV and HDTV television pictures on flat panel displays, ITU-R Recomm. BT. 2022, August 2012. [18] T. Mitsa and K. L. Varkur, “Evaluation of contrast sensitivity
functions for the formulation of quality measures incorporated in halftoning algorithms,” in Acoustics, Speech, and Signal
Processing, 1993. ICASSP-93., 1993 IEEE International Con-ference on, vol. 5. IEEE, 1993, pp. 301–304.
[19] Z. Wang, A. Bovik, H. Sheikh, and E. Simoncelli, “Image quality assessment: from error visibility to structural simi-larity,” IEEE Trans. Image Processing, vol. 13, no. 4, pp. 600–612, 2004.
[20] H. R. Sheikh and A. C. Bovik, “Image information and visual quality,” Image Processing, IEEE Transactions on, vol. 15, no. 2, pp. 430–444, 2006.