See It Fast
to Keep Calm
Real-Time Voltage Control
Under Stressed Conditions
Digital Object Identifier 10.1109/MPE.2012.2196332 Date of publication: 18 June 2012
A
AS THE ELECTRICAL UTILITY INDUSTRY ADDRESSES ENERGY AND environmental needs through greater use of renewable energy, storage, and other tech-nologies, power systems are becoming more complex and stressed. Increased dynamic changes that require improvements in real-time monitoring, protection, and control increase the complexity of managing modern grids. In an effort to ensure the secure operation of power systems, more attention is being given to voltage management. Volt-age manVolt-agement includes addressing voltVolt-age stability and fault-induced delayed volt-age recovery (FIDVR) phenomena. Deployment of phasor measurement unit (PMU) technology, in combination with recently developed methodologies for tracking voltage behavior, has resulted in improved real-time voltage monitoring, protection, and control.This article describes simple and accurate methodologies based on real-time mea-surement—and independent of the system model—designed for tracking both slow-developing and transient voltage stability conditions under various and changing system confi gurations. Tests with real-time supervisory control and data acquisition (SCADA) and PMU data, as well as data from comprehensive simulation studies, from the Bonneville Power Administration (BPA) and South-ern California Edison (SCE) sys-tems show very accurate detec-tion as the system is approaching voltage instability. The calculated reactive power margin and other indices are easily visualized for operator awareness. For quickly developing disturbances, they allow the initiation of fast control and protection actions. This meth-odology also discriminates well between FIDVR and short-term
©EYEWIRE
By Mevludin Glavic,
Damir Novosel,
Eric Heredia,
Dmitry Kosterev,
Armando Salazar,
Farrokh
Habibi-Ashrafi, and
Matt Donnelly
voltage instability. Finally, a tool for properly modeling the complex voltage phenomena is described.
Quantifying Power System Stress
A power system is under stress whenever it is operated close to its limits. The level of system stress is inversely proportional to the level of system security. Operating the system in stressed conditions increases the probability of a chain of severe contingencies. The stressed conditions are not considered in traditional system security assessment, as confi rmed by the number of large system blackouts over the past 20 years (see Table 1). To allow system operation at stressed levels and have the ability to react adequately to the consequences of these conditions, there is a need to quantify the level of system stress. This measure should refl ect the impact of key factors infl uencing the system stress level. In addition, this measure should be intuitive, practical, and easy to visualize so that system operators can interpret it easily and respond quickly by initiating control and protection actions based on practical margins and thresholds. An appropriately chosen voltage stabil-ity index or indicator can serve the purpose of quantify-ing the level of system voltage stress (or system voltage security, as its inverse). As proximity to voltage instability is detected, appropriate control actions are required to pre-vent system degradation or contingency propagation. Many conventional control actions are not designed for quickly developing contingencies and may be too slow. Likewise, conventional methodologies and study tools may not be suffi cient or fast enough to accurately initiate the type of reactive control currently deployed or may require accurate system models to be effective. There is a need to comple-ment existing energy managecomple-ment systems and tools with the real-time approach described in this article for better system voltage management.
Voltage-Related Phenomena
Power system voltage problems with major impacts on the power system manifest themselves in two forms:
1) voltage instability 2) FIDVR.
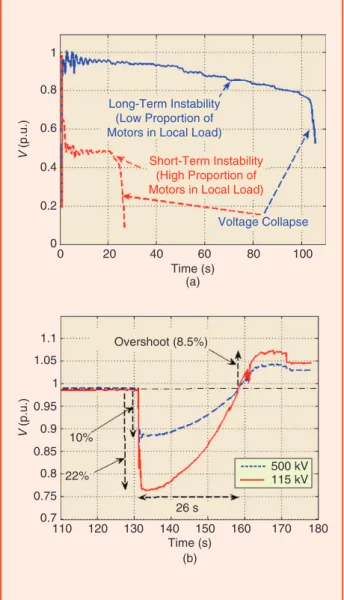
Figure 1 illustrates these two phenomena.
Voltage Instability
Voltage stability is closely related to the notion of the max-imum deliverable power that can be drawn by the system loads while preserving stable operation of the combined generation-transmission system. Voltage instability occurs when the combined generation-transmission system is unable to provide the power requested by the loads; this may be due to system outages and/or limitations in reactive power generation. Once it happens, it can evolve into further volt-age collapse and cause system disruption. Voltvolt-age collapse is the process by which the sequence of events accompany-ing voltage instability leads to a blackout or abnormally low voltages in a signifi cant portion of the power system. The form the voltage instability takes is infl uenced by the com-position of the system load. A fast (short-term) instability— one that occurs within just a few seconds—can develop in situations when motor loads make up a large proportion of the local load, as illustrated in Figure 1.
Voltage instability, resulting in voltage collapse, has been reported as either a principal cause or an important part of the problem in many partial or complete system blackouts. Various examples have been documented. Table 1 lists some of these incidents, together with time frames, total load interruptions, and some of the societal and economic con-sequences.
FIDVR
A slightly modifi ed defi nition of FIDVR, derived from the NERC Transmission Issues Subcommittee (TIS), is that FIDVR is a voltage condition initiated by a transmission, subtransmission, or distribution fault and characterized by the stalling of induction motors, initial voltage recovery after the clearing of the fault to less than 90% of precontin-gency voltage, and a slow voltage recovery lasting more than 2 s to expected postcontingency steady-state voltage levels.
table 1. Some documented voltage collapse incidents, 1995–2009.
Date Location Time Frame Interrupted Load Remarks
11 November 2009 Brazil and Paraguay 68 s (after initial
event) 24,731 MW Voltage collapse in part of the systemNumber of people affected: 87 million 12 July 2004 Southern Greece 30 min ~9,000 MW Number of people affected: ~5 million 23 September 2003 Southern Sweden and
eastern Denmark 7 min 6,550 MW Estimated cost: US$75 million (Sweden)Number of people affected: 4 million 14 August 2003 United States and
Canada 39 min 63,000 MW Estimated cost: US$7–10 billionNumber of people affected: 50 million
May 1997 Chile 30 min 2,000 MW —
10 August 1996 Western United States
(WECC) 6 min 30,500 MW Number of people affected: 7.5 million
FIDVR is caused by constant-torque induction motor loads (mostly the single-phase motors in residential air condition-ers) that stall in response to low voltages. The stalled motors draw excessive reactive power from the grid. This situation can further aggravate system conditions and cause a cascad-ing system failure. A severe event can result in fast voltage collapse.
A typical FIDVR following a transmission network fault in the SCE system, as experienced at a 500-kV/115-kV sub-station, is illustrated in Figure 1(b). This fi gure indicates that immediately after the fault, voltage decreased to 78% of nominal voltage. The fault-induced low voltage caused air-conditioning units to stall; the stalled air-air-conditioning units kept the voltage from recovering to a nominal level. When the air-conditioning units’ thermal overload protection switches tripped, the voltage recovered but overshot the nominal volt-age (by 8.5% in the particular case shown in the fi gure). The high voltage is a result of the fact that the capacitor banks placed in service before or during the low voltage remained in service after large amounts of air conditioner load trips. This overvoltage caused another problem: the capacitor banks tripped off (at around t = 172 s). With the capacitors tripped off and the load returning, the voltage went up to a little above nominal voltage in this particular case.
Other important observations about FIDVR are:
✔ The deeper the initial voltage sag, the greater the in-crease in the reactive demand of motor loads.
✔ Voltage recovery is affected by the ability of the sys-tem to supply reactive power to the area of depressed voltage.
Table 2 lists some FIDVR incidents documented in the lit-erature.
Tens of FIDVR cases were reported but not documented in available literature. SCE experienced a number of FIDVR cases: one event in 1990, four in 2004, three in 2005, 37 in 2006, and six in 2007. This number was so high in 2006
500 kV 115 kV 1 1.1 1.05 1 0.95 0.9 0.85 0.8 0.75 0.7 110 120 130 140 Time (s) (b) 26 s 22% 10% Overshoot (8.5%) 150 160 170 180 V (p.u.) V (p.u.) 0.8 0.6 0.4 0.2 0 0 20 40 60 Time (s) (a) Voltage Collapse Short-Term Instability (High Proportion of Motors in Local Load) Long-Term Instability
(Low Proportion of Motors in Local Load)
80 100
figure 1. (a) Voltage instability at a bus of the test system and (b) FIDVR at a 500-kV/115-kV SCE station.
table 2. Notable FIDVR cases.
Date Utility/Location Time Frame of Recovery Interrupted Load Remarks
28 July 2003 Arizona Public Service/Phoenix Several seconds 440 MW Generation loss: 2,600 MW
Number of customers affected: 90,000 1 July 2003 Arizona Public Service/Phoenix 9 s 1,000 MW Number of customers affected: 48,000 30 July 1999 Southern Balancing Authority/
Atlanta, Georgia 15 s 1,900 MW Generation loss: 1,165 MW
5 August 1997 Southern California Edison/
Hesperia 20–25 s 3,500 MW Lugo plane crash accident
29 July 1995 Arizona Public Service/Phoenix 20 s 2,100 MW — 3 May 1994 Florida Power and Light
Company/Dade County 8 s 450 MW —
18 August 1988 Florida Power and Light
Company/Miami 10 s 825 MW —
22 August 1987 Tennessee Valley Authority/
due to hot and humid weather conditions, causing both an increase in high air-conditioning load and a large number of faults initiated by thunderstorms and lighting strikes. After a fault, a large number of air-conditioners would stall, causing a major voltage drop.
Voltage Stability Assessment
To avoid catastrophic outages and the huge economical and social costs caused by voltage instability and FIDVR, appro-priate control and protection actions to mitigate these condi-tions are required. A voltage-related problem in the power system should be solved with control actions implemented through system operation, corrective controls, and/or emer-gency protection systems. Such solutions require accurate and fast voltage stability assessment.
Advanced voltage stability monitoring and instability detection schemes include two basic elements: collection of measurement data from PMUs or SCADA and preprocess-ing and computation of the proximity to voltage instability. The following section focuses on advanced voltage stabil-ity indices derived from the concept of a voltage instabilstabil-ity predictor (VIP). The VIP method described here represents the enhancement of a concept fi rst developed in the late 1990s. This new methodology results in major improve-ments in accuracy, numerical stability, implementation variants, and ease of use. This methodology has the fol-lowing benefi ts:
✔ It offers simple, real-time voltage instability margin detection that is model-free.
✔ It works better than voltage-only methods but is sim-pler than any other alternative.
✔ It is much faster than EMS contingency analysis.
✔ It is easy to interpret and combine with other methods and indices.
✔ It enables the tracking of both slow changes and sys-tem dynamics using PMUs (e.g., 10–120 frames per second) or other measurements.
The New Methodology and Its Variants
The general VIP methodology is based on a representation of the power system as a two-bus equivalent circuit, as illus-trated in Figure 2. The maximum deliverable power for such
a system under a given load power factor is reached when the absolute values of the Thevenin and load impedance are equal, i.e., when Z=Zeq.
The Thevenin and load impedance values are not con-stant; they vary, refl ecting changes in power system oper-ating conditions. It is critical to identify and follow these changes as they occur. This simple representation of the sys-tem parameters and their recursive estimation at the rate that the phasor data are measured enable a model-free approach in calculation of the stability margins in real time. Equiva-lent parameter identifi cation at a high rate transforms the linear system of Figure 2 into a linear parameter-varying system, thus more adequately accounting for the nonlinear-ity present in real systems. The condition that the absolute values of the Thevenin and load impedance are equal can easily be used to estimate maximum deliverable power.
The VIP method has been extended for different system confi gurations, such as transmission corridors and load cen-ters using measurements at both ends of the corridors or load center in-feeds. These extensions include better tracking of equivalent parameters, improved use of the measurements available for transmission corridors and load centers, com-putation of intuitive power margins, and simple visualization of system stability conditions.
The most interesting extensions for control center oper-ators are power margins (measured in MVA, MW, and MVAR). A simple representation of these margins is the P-Q plane, shown in Figure 3. Two sets of margins are presented:
loading margins, inherent to the concept of VIP, where the
reactive loading margin, DQloading, is of most interest. The
active power loading margin is denoted as DPloading. Another
set of reactive power margins, Q-margin, represented as
, Q
D is shown in Figure 3. It is related to the known concept of QV-analysis, but in this case it is computed and tracked in real time. The Q-margin is particularly suitable for FIDVR cases, since it provides the amount of reactive power that can be pulled out of the bus, corridor, line, cut-set, and so on. This is exactly what happens in FIDVR cases, when motors are pulling reactive power due to the drop in voltage.
One of the most notable of the extensions to the VIP method is calculation of the reactive power margin in real time (computed as the amount of reactive power that can be
Rest of the System Load Bus E eq Z eq V I Z Z I Zeq = Z ejθ S = (P + jQ) =
Smax, Pmax, Qmax
increased from the current operating point before reaching the voltage stability boundary). This compares favorably with the traditional Q-V analysis method used by many power utilities (an off-line and time-consuming method). Another reason to use the VIP method comes from FIDVR and concerns the fact that the motors are pulling reactive power from the system. The voltage stability boundary shown in Figure 3 is assumed to be quadratic and is easily derived from known maximum deliverable apparent power. Both the voltage stability boundary and the operating point are recomputed and refreshed once a new measurement set is available, allowing for easy visualization and tracking of voltage stability conditions. The method is of course capa-ble of computing and visualizing loading power margins, thus offering greater fl exibility in stability monitoring and detecting conditions of instability.
Further improvements to the classic VIP approach, in which power margins are monitored at individual system load buses, are being implemented for transmission corri-dors and load centers (see Figure 4).
Real-Time Voltage Control
To maintain an acceptable voltage profi le across the network, power systems are equipped with control devices acting as continuous-feedback controls of substation voltages. These control devices are automatic voltage regulators (AVRs) that vary the excitation of rotating generators. Although such devices are not designed to deal with the large contingencies likely to take place in stressed conditions, they still provide useful support in these conditions. This is particularly true for AVRs that regulate high-side voltages of generator step-up transformers through compensation of their leakage reac-tance. The compensation AVR is more effective than other types because it regulates voltages closer to the loads.
In order to deal with large contingencies, additional discontinuous corrective controls are needed. These dis-continuous controls are initiated based on a predetermined
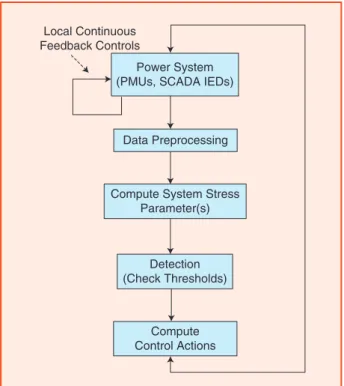
threshold of the system stress indicator. Figure 5 shows a real-time, measurement-based voltage control scheme. An important part of this control scheme is the measurement system’s ability to capture key system variables at fast rates. A well-designed real-time voltage control scheme should be able to detect the onset of the problem rather than rely-ing on observation of its consequences (e.g., by monitorrely-ing voltage magnitudes). The chosen indicator should provide the thresholds for initiation of discontinuous control action. Such an approach should be better than voltage magnitude monitoring (which may be inaccurate when detecting prox-imity to voltage instability) and as simple as possible for easy interpretation and understanding. Indicators with phys-ical meaning, like the ones derived from the VIP method, provide both the required accuracy and simplicity.
Corrective voltage control in real time aims at saving the system after an unexpected contingency actually occurs and a voltage-related problem is detected. In principle, correc-tive voltage controls, in case of voltage instability, are used to push the system to a new equilibrium by increasing the
G G G First Equivalent (a) (b) Second Equivalent G G G PMU PMU PMU PMU PMU PMU PMU PMU PMU PMU PMU PMU
figure 4. (a) Corridor and (b) load center concepts.
figure 3. Voltage stability power margins in P-Q plane: loading (DQloading) and Q-margin (DQ).
Voltage Stability Boundary Q Normal Operating Region P ΔQloading ΔPloading ΔQ θ Operating Point
maximum deliverable power or reducing the load consump-tion. This approach is effi cient for both short-term and long-term instability. Another approach, effi cient for long-long-term instability, is to stop the load restoration mechanism.
In the case of FIDVR, transmission network–level solu-tions are:
✔ guiding the system to a new operating point with accept-able voltage magnitudes (voltages within the normal operating range), which can be achieved by increasing the maximum deliverable power or by shedding load
✔ limiting the impact of the fault, which is usually achieved by quicker clearing of the faults and section-alizing a tightly coupled transmission system.
Corrective real-time voltage controls can be divided into two major categories:
✔ The first category includes controls that are event-based, using control actions assessed off-line through simulations of postulated scenarios. This type of con-trol is initiated upon recognition of specific system conditions (events) and does not readjust its actions in response to the system’s evolution.
✔ The second category includes controls that are re-sponse-based, assessing the severity of the distur-bance through measurements and adjusting their ac-tions correspondingly. These controls do respond to the system’s evolution, and they repeat some actions if the actions taken previously are not sufficient to re-solve the problem. This approach makes the control scheme more robust.
Emergency control is a special type of corrective control designed to deal with extremely stressed system conditions. This control can be both event-based and response-based.
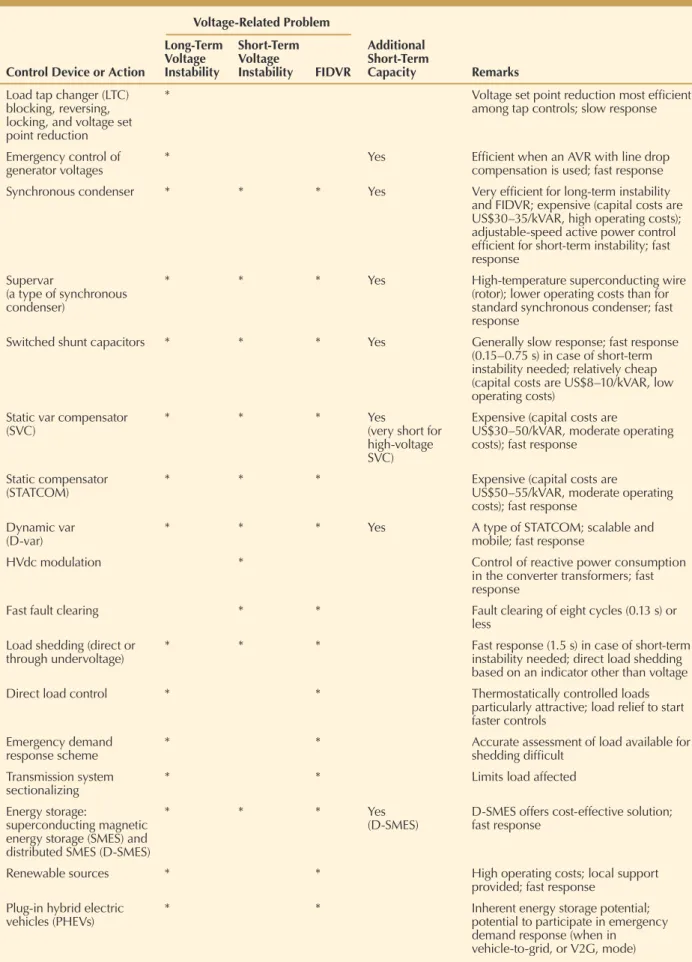
Various control devices and actions can be used to achieve the control objectives described above. The effectiveness of a number of different control devices and actions in voltage-related problems is summarized in Table 3.
Usually, LTC controls are not able to save the system but do postpone system collapse, providing extra time so that other controls can stabilize the system, as illustrated in Fig ure 6. A real advantage of LTC controls is that when they are com-bined with other control types, such as load shedding, they usually help decrease the amount of the other controls neces-sary to achieve a satisfactory result, as shown in Figure 6.
Load shedding is an effective measure for voltage-related issues. Load-shedding schemes can be implemented based on local data (typically one or several bus voltages, in some designs complemented by other signals) and/or on wide-area measurements. Figure 6 also illustrates the effectiveness of load shedding in stabilizing the system upon detection of developing long-term voltage instability. Voltage source converter devices such as STATCOM (especially the D-var type) and D-SMES are very effi cient in controlling voltages during periods of short-term instability. Standard versions of these devices connected to distribution networks are more cost effective than larger devices connected to transmission networks. The effectiveness of large shunt capacitor banks can be improved by selecting and using only the groups of capacitor banks required. Additional short-term capacity offers benefi ts and should be exploited in the case of short-term instability. Renewable energy resources, if capable of producing both active and reactive power with the help of a power electronics interface, can provide cost-effective local voltage support to boost the local bus voltage during FIDVR.
Voltage Control Implemented in a System
Integrity Protection Scheme (SIPS)
A robust corrective emergency control against voltage insta-bility and FIDVR requires a combination of the controls
1 0.98 0.96 0.94 0.92 0.9 0.88 0.86 0.84 0 20 40 60 80 Time (s) Uncontrolled Voltage Instability Detected LTC Blocking Only LTC Blocking + Load Shedding 100 120 140 160 V (p.u.)
figure 6. Effects of some emergency voltage control actions. Power System
(PMUs, SCADA IEDs) Local Continuous
Feedback Controls
Data Preprocessing
Compute System Stress Parameter(s)
Detection (Check Thresholds)
Compute Control Actions
table 3. Effectiveness of control devices and actions.
Control Device or Action
Voltage-Related Problem Additional Short-Term Capacity Remarks Long-Term Voltage Instability Short-Term Voltage Instability FIDVR Load tap changer (LTC)
blocking, reversing, locking, and voltage set point reduction
* Voltage set point reduction most efficient
among tap controls; slow response
Emergency control of
generator voltages * Yes Efficient when an AVR with line drop compensation is used; fast response
Synchronous condenser * * * Yes Very efficient for long-term instability
and FIDVR; expensive (capital costs are US$30–35/kVAR, high operating costs); adjustable-speed active power control efficient for short-term instability; fast response
Supervar
(a type of synchronous condenser)
* * * Yes High-temperature superconducting wire
(rotor); lower operating costs than for standard synchronous condenser; fast response
Switched shunt capacitors * * * Yes Generally slow response; fast response
(0.15–0.75 s) in case of short-term instability needed; relatively cheap (capital costs are US$8–10/kVAR, low operating costs)
Static var compensator
(SVC) * * * Yes (very short for
high-voltage SVC)
Expensive (capital costs are
US$30–50/kVAR, moderate operating costs); fast response
Static compensator
(STATCOM) * * * Expensive (capital costs are US$50–55/kVAR, moderate operating costs); fast response
Dynamic var
(D-var) * * * Yes A type of STATCOM; scalable and mobile; fast response
HVdc modulation * Control of reactive power consumption
in the converter transformers; fast response
Fast fault clearing * * Fault clearing of eight cycles (0.13 s) or
less Load shedding (direct or
through undervoltage) * * * Fast response (1.5 s) in case of short-term instability needed; direct load shedding based on an indicator other than voltage
Direct load control * * Thermostatically controlled loads
particularly attractive; load relief to start faster controls
Emergency demand
response scheme * * Accurate assessment of load available for shedding difficult
Transmission system
sectionalizing * * Limits load affected
Energy storage:
superconducting magnetic energy storage (SMES) and distributed SMES (D-SMES)
* * * Yes
(D-SMES) D-SMES offers cost-effective solution; fast response
Renewable sources * * High operating costs; local support
provided; fast response Plug-in hybrid electric
vehicles (PHEVs) * * Inherent energy storage potential; potential to participate in emergency demand response (when in
given in Table 3 with coordination and adaptation of indi-vidual devices. The trend in corrective emergency control is toward integration of voltage control in a SIPS. The idea of a SIPS is to use measured local and system-wide information at a processing location to initiate actions counteracting the propagation of major disturbances in the power system. A distinguishing feature of the SIPS approach is that it serves the overall power system (or a strategic part of it) in order to preserve system stability, maintain overall system connec-tivity, and/or avoid serious equipment damage during major events. A SIPS may require multiple detection and actuation devices and communication facilities.
Voltage instability and FIDVR corrective controls within a SIPS should be focused on the design of response-based controls, acting in a closed loop and response-based on algo-rithmic decisions. These controls should also strike a balance between control actions taken locally and those taken centrally.
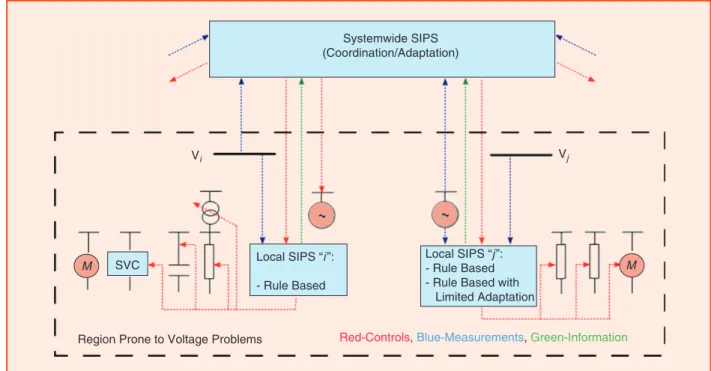
Figure 7 illustrates a hierarchical wide-area protection architecture for emergency voltage instability and FIDVR control integrated in a SIPS. For example, a local SIPS could collect voltage measurements at key buses and take actions on loads, shunt capacitors, and SVCs based on predefi ned rules and settings (usually, voltage thresholds). A system-wide SIPS collects the measurements from all measured buses in the system and detects approaching instability based on this wide-system view. Once developing instability is detected, the system-wide SIPS extracts all the informa-tion at the critical point and sends new parameter settings to the local SIPS, making overall protection adaptive with respect to the system state and contingency. The local SIPS
keeps predetermined thresholds as backup in case of a com-munication failure from the system-wide SIPS.
Test Results
The key to any of the operational, control, and protection measures described above lies in assessing voltage stabil-ity margins using methodologies such as the improved VIP. These methodologies require comprehensive testing under complex system confi gurations and conditions before being deployed. The new VIP methodology has been comprehen-sively tested using real-world PMU and SCADA measure-ments and off-line system simulations in the BPA and SCE systems and under various conditions (local load, transmis-sion corridor, load center). Such tests have included record-ings of past system events and the output of time sequence power fl ow (TSPF) for dynamic off-line system simulations. An improved TSPF tool was developed as an add on to a conventional positive sequence load fl ow (as described later in the article). Although improvements could be made to any positive sequence load fl ow tool, GE PSLF software was used for the following tests. Results showed that the method-ology works correctly for all test cases:
✔ It has the ability to detect instability even if voltage close to nominal.
✔ Results are comparable with those from detailed, model-based, off-line QV analysis and are very accu-rate close to the instability boundary.
✔ There were no false alarms.
Results also showed that the methodology discriminates between FIDVR and short-term voltage instability. FIDVR cases (without voltage collapse) are accurately detected
Systemwide SIPS (Coordination/Adaptation) Vj M Local SIPS “j ”: - Rule Based - Rule Based with Limited Adaptation Local SIPS “i ”:
- Rule Based SVC
M
Region Prone to Voltage Problems Red-Controls, Blue-Measurements, Green-Information Vi
despite the fact that the voltage is low for some time. The test results are described in more detail below.
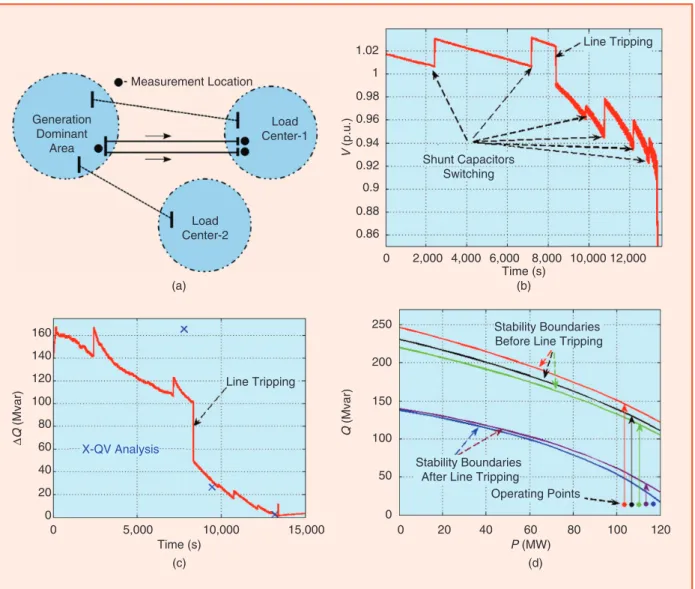
Figure 8(a) displays a load center confi guration in the BPA system and the results of voltage instability detection using a version of the VIP method. The event is shown in Figure 8(b) in terms of voltage magnitude at the bus in load center; in Figure 8(c), the time evolution of Q-margin is com-pared with the results of the BPA Q-V analysis tool; and Fig-ure 8(d) provides a simple visualization of the VIP results in the P-Q plane. From Figure 8(c) it can be seen that Q-margin results, as compared with Q-V analysis, are very accurate when the system is close to the voltage stability boundary. Away from the boundary, differences with respect to Q-V analysis results were observed.
The results given in Figure 8 were obtained using out-puts of simulations performed using time sequence power fl ows and correspond to a scenario with linear load increase in the load center and a line tripping in a generation-domi-nant area. These disturbances trigger the switching of sev-eral shunt capacitors in both the generation area and load
center. Computed Q-margin illustrates that all switching is accounted for, as well as important system events such as line tripping. The same holds true for other VIP-derived quantities (equivalent load and system impedances and their ratio). A contraction of the voltage stability boundary can be observed after the line tripping, as illustrated in Figure 8(d).
VIP Performance for FIDVR and Short-Term Voltage Instability
The simplicity of the VIP method and its reliance on basic circuit equations motivated an assessment of its capabili-ties in FIDVR and short-term voltage instability cases. This assessment was further motivated by the fact that voltage recovery is affected by the ability of the system to supply reactive power to the area with depressed volt-ages. This suggests that the ratio of the system strength to local load can give a good indication of FIDVR, and this is exactly the essence of the VIP method. Its capabilities have been assessed on the BPA and SCE systems in differ-ent situations, using PMU recordings of past system evdiffer-ents
Stability Boundaries After Line Tripping Generation Dominant Area Load Center-1 Load Center-2 Δ Q (Mvar) 160 140 120 100 80 60 40 20 0 0 5,000 10,000 Time (s) (a) (c) Measurement Location V (p.u.) 1.02 1 0.98 0.96 0.94 0.92 0.9 0.88 0.86 0 2,000 4,000 6,000 8,000 10,000 12,000 Time (s) (b) Q (Mvar) 15,000 250 200 150 100 50 0 0 20 40 60 80 100 120 P (MW) Operating Points (d) Stability Boundaries Before Line Tripping Shunt Capacitors
Switching
Line Tripping
Line Tripping
X-QV Analysis
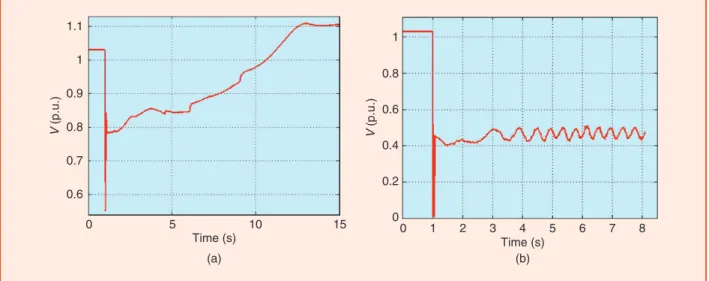
as well as the output of dynamic simulations performed in a PSLF tool. Figure 9 displays voltage magnitudes in a 230-kV station belonging to the BPA system for two dif-ferent simulated transmission system faults (one resulting
in FIDVR and another in short-term voltage instability). The faults have been simulated in the PSLF tool; relevant variables were recorded every 0.033 s to mimic a realistic PMU rate. Δ Q (Mvar) 1,200 1,000 800 600 400 200 0 –200 –400 Time (s) 0.5 0.6 0.4 0.3 0.2 0.1 0 5 10 15 0 5 10 15 Time (s) (c) (a) 0.5 0.45 0.4 0.35 Δ Q (Mvar) 800 600 400 200 0 –200 0 1 2 3 4 Time (s) 5 6 7 8 0.3 0.25 0.2 0.15 0.1 0.05 0 0 1 2 3 4 5 6 7 8 Time (s) (d) (b) ⏐Z⏐ ⏐Zeq⏐ ⏐Zl⏐ ⏐Zeq⏐
figure 10. Load and equivalent impedances and Q-margins following transmission network faults at a 230-kV BPA sta-tion. (a) and (c): FIDVR; (b) and (d): short-term instability.
V (p.u.) 1.1 1 V (p.u.) 1 0.8 0.6 0.4 0.2 0 0 1 2 3 4 Time (s) 5 6 7 8 0.9 0.8 0.7 0.6 0 5 10 15 Time (s) (b) (a)
For both cases, the results of voltage condition monitor-ing, using derived quantities from a transmission corridor, are shown in Figure 10 and can be described as follows:
✔ For the FIDVR case, load and equivalent impedances do not cross each other except during fault-on condi-tions, as shown in Figure 10(a). Q-margin remains positive, except during fault-on conditions, as illus-trated in Figure 10(c).
✔ For the short-term voltage instability case, load and equivalent impedance cross each other, as can be seen in Figure 10(b). Reactive margin becomes and remains negative right after the fault, indicating an unstable case, as shown in Figure 10(d).
✔ There was no false alarm for the FIDVR case, despite the fact that the voltages are considerable depressed.
✔ The results during fault-on conditions should be dis-carded.
In summary, the new VIP method accurately discriminates between a voltage-stable case (FIDVR is considered a volt-age-stable case) and an unstable case.
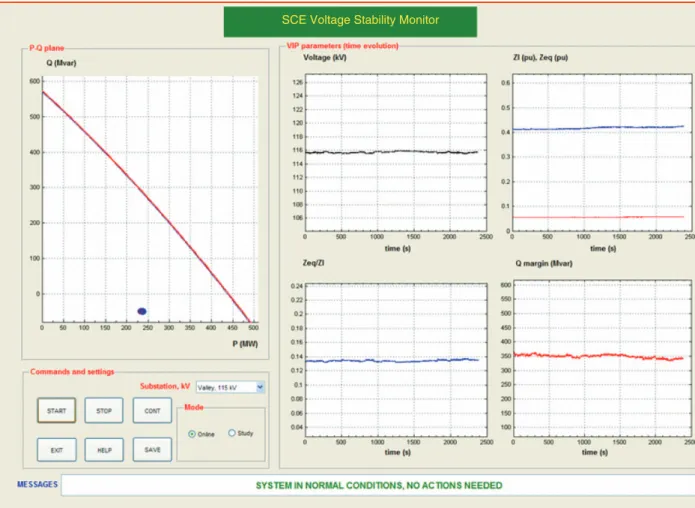
Based on this new methodology, a real-time voltage sta-bility monitor GUI, providing a valuable visualization tool for system operators, was developed and installed at SCE. A snapshot of this display is shown in Figure 11.
TSPF Simulation
The increased complexity of today’s power systems imposes new challenges in using existing dynamic simulation tools in the process of real-time voltage control design. First, a tran-sient stability run is not feasible for studies requiring an hour or more of simulation time. Second, the models used in tran-sient stability runs are not usually considered to be as accu-rate as those used in power fl ow studies, and these modeling errors may be magnifi ed in stability simulations involving hundreds of thousands of time steps. Consequently, there is a need for a simulation tool that bridges a gap in the avail-able set of analysis tools between static power fl ows and full-blown transient simulations. TSPF is such a tool; it is suitable for studying controllers and system control actions with long time constants. The modeling and CPU time requirements for TSPF simulation are much less than for traditional tran-sient simulation, and the modeling environment can be made to be more fl exible.
TSPF is used to model a sequence of events in a static model of the power system. It does not model dynamic phe-nomena as dynamics are typically defi ned in the contempo-rary vernacular, but TSPF could be used to study the onset of voltage instability. The entire purpose of the TSPF simula-tion is to implement the many new control algorithms. There
figure 11. The SCE voltage stability monitoring application GUI.
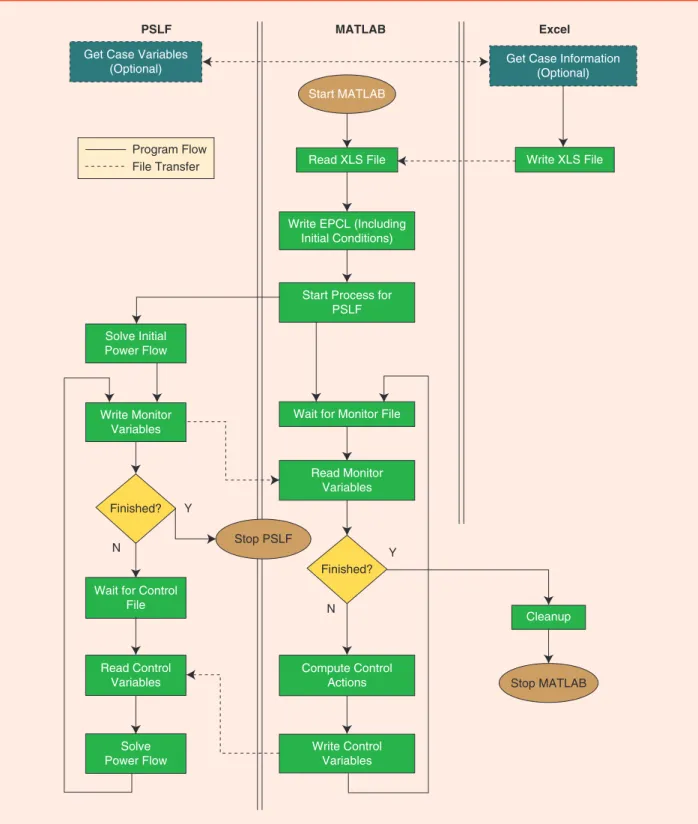
are no standard models for these new controllers, and more are expected to emerge. A specifi c implementation of TSPF is detailed in Figure 12, in terms of computational environ-ments chosen, program fl ow and fi le transfers.
Implementation of the tool requires a fl exible program-ming environment. Such computational environments
include GE’s PSLF, MATLAB, and Excel. MATLAB provides a programming environment familiar to many engineers as well as a robust plotting and display capa-bility. File-based exchange of variables is preferred over memory-based methods for the implementation purpose. Memory-based methods would include programming pipes
Get Case Variables (Optional)
Start MATLAB
Get Case Information (Optional)
Read XLS File
Write EPCL (Including Initial Conditions)
Start Process for PSLF Solve Initial Power Flow Write Monitor Variables Read Monitor Variables Finished?
Wait for Control File Read Control Variables Write Control Variables Compute Control Actions Solve Power Flow Stop MATLAB Cleanup Finished?
Wait for Monitor File
Write XLS File Program Flow File Transfer PSLF MATLAB Excel Y Y N N Stop PSLF
between the programming environment and the power fl ow solver engine.
TSPF simulation cannot be used to study anything that requires dynamic models, including anything that involves frequency response or that invokes governor action. For some future implementation of a TSPF, however, it may be possible to solve a sequence of governor power fl ows rather than classical power fl ows.
Conclusions and Future Improvements
This article has analyzed the need for accurate and fast volt-age stability assessment and real-time voltvolt-age control and protection devices and actions as elements of comprehen-sive system voltage management to prevent voltage prob-lems. It has been demonstrated that the new, improved VIP methodology can be deployed so as to make use of currently available technology (such as synchronized measurements) and enable additional benefi ts, especially with continuous technological advancements. The advantages of this new VIP methodology in determining proximity to voltage collapse are:
✔ It is a model-free approach, offering easy interpreta-tion of results.
✔ It can be implemented in several variants, including those for the bus, transmission corridor, and load center.
✔ It offers calculation of Q-margin and other indices for accurately and quickly detecting proximity to voltage collapse.
✔ It is easily combined with and offers a useful comple-ment to other methods and indices.
✔ It is capable of initiating model-based contingency analysis, e.g., by generating alarms for the operator.
✔ It can reliably distinguish FIDVR from voltage insta-bility, even if voltage is very low.
The method’s advantages regarding practical deployment include its ability to process data from different sources (PMUs, SCADA, and simulation outputs). It takes imme-diate advantage of available data and scales up well with increased numbers of PMUs. Another benefi t is its simplicity of implementation in various hardware devices and control center software tools. Excellent results have been achieved from system tests on slowly changing system operating con-ditions and in tracking system dynamics after large distur-bances using actual PMU and/or SCADA data and system simulations.
Furthermore, the complexity of today’s power system has given rise to a need for a new simulation tool to bridge the gap between traditional static and dynamic analysis tools. The TSPF tool, when used judiciously, is expected to become a useful addition to static power fl ows and full dynamic simulations. The increased deployment of wind, solar, and other renewable generation as well as energy storage and electrical vehicles will have a major impact on power sys-tem performance and consequently on voltage management.
Synchronized measurements, fast and secure communica-tions, and powerful computational facilities are gradually being deployed in modern power grids. These new and continuously improved technological solutions, combined with algorithmic developments, will provide improved and comprehensive solutions for voltage instability and FIDVR monitoring, protection, and control.
For Further Reading
J. A. Diaz de Leon and C. W. Taylor, “Understanding and solving short term voltage stability problems,” in Proc. IEEE
PES Summer Meeting, Chicago, July 2002, pp. 745–752.
T. Van Cutsem and C. D. Vournas, “Emergency voltage stability controls: An overview,” in Proc. IEEE PES General
Meeting, Tampa, June 2007, pp. 1–10.
K. Vu, M. M. Begovic, D. Novosel, and M. M. Saha, “Use of local measurements to estimate voltage-stability margin,”
IEEE Trans. Power Syst., vol. 14, no. 3, pp. 1029–1035, Aug.
1999.
M. Glavic and T. Van Cutsem, “A short survey of meth-ods for voltage instability detection,” in Proc. IEEE PES
General Meeting, Detroit, MI, July 2011, pp. 1–8.
NERC Transmission Issues Subcommittee and System Protection and Control Subcommittee, “Fault-induced de-layed voltage recovery,” Technical reference paper, version 1.2, Princeton, NJ, June 2009.
D. Novosel, V. Madani, B. Bhargava, K. Vu, and J. Cole, “Dawn of the grid synchronization: Benefits, practical appli-cations, and deployment strategies for wide area monitoring, protection, and control,” IEEE Power Energy Mag., vol. 6, no. 1, pp. 49–60, Jan./Feb. 2008.
V. Madani, D. Novosel, S. Horowitz, M. Adamiak, J. Amantegui, D. Karlsson, S. Imai, and A. Apostolov, “IEEE PSRC report on global industry experiences with system in-tegrity protection schemes (SIPS),” IEEE Trans. Power
De-livery, vol. 25, no. 4, pp. 2143–2155, Oct. 2010.
FERC, “Principles for efficient and reliable reactive power supply and consumption,” Docket no. AD05-1-000, Washington, D.C., Feb. 2005.
Biographies
Mevludin Glavic is with Quanta Technology.
Damir Novosel is with Quanta Technology, Raleigh,
North Carolina.
Eric Heredia is with the Bonneville Power
Administra-tion.
Dmitry Kosterev is with the Bonneville Power
Admin-istration.
Armando Salazar is with Southern California Edison. Farrokh Habibi-Ashrafi is with Southern California
Edison.
Matt Donnelly is with Montana Tech of the University
of Montana.