222
Rn as a Partitioning Tracer To
Detect Diesel Fuel Contamination in
Aquifers: Laboratory Study and Field
Observations
D A N I E L H U N K E L E R ,† E D U A R D H O E H N , *, ‡ P A T R I C K H O¨ H E N E R ,
† A N D J O S E F Z E Y E R†
Swiss Federal Institute of Technology (ETH), Institute of Terrestrial Ecology, Soil Biology, CH-8952 Schlieren, Switzerland, and EAWAG, Swiss Federal Institute for Environmental Science and Technology, CH-8600 Du¨ bendorf, Switzerland
The use of
222Rn, a naturally occurring radioactive isotope,
was investigated as a partitioning tracer to detect and
quantify the amount of non-aqueous-phase liquids (NAPLs)
in contaminated aquifers. Diesel fuel was chosen as a
model NAPL. The diesel fuel
-
water partition coefficient for
222Rn was 40
(
2.3, in bottles containing diesel fuel and
water at 12
°
C. In water-saturated quartz sand contaminated
with diesel fuel, the
222Rn emanating from the sand
partitioned between diesel fuel and water as expected based
on this partition coefficient. In a column containing
uncontaminated quartz sand, the
222Rn activity in infiltrated
water increased from
<
0.2 to 4.9 kBq m
-3
, and in a
subsequent column containing diesel fuel-contaminated quartz
sand, the
222Rn activity in the water phase decreased to
3.3 kBq m
-3. This decrease corresponds to what has been
predicted using a mathematical model. At a contaminated
field site, the
222Rn activity of groundwater decreased by
about 40% between monitoring wells upgradient of the
contaminated zone and monitoring wells within the
contami-nated zone. On the basis of this decrease, the average
diesel fuel saturation was estimated using the mathematical
model. The calculated diesel fuel saturation was in the
range of that found in excavated aquifer material.
Introduction
Contamination of aquifers by non-aqueous-phase liquids (NAPLs) is a common environmental problem. To assess the risk of NAPL contamination and to design appropriate remediation measures, the amount, distribution, and com-position of NAPL in an aquifer needs to be known. NAPL contamination is usually located and quantified by analysis of core samples of bore holes. However, laboratory experi-ments and theoretical considerations have revealed that the volume of core samples is often too small to yield a representative average NAPL saturation (1). Partitioning tracer methods may be more accurate because they involve much larger volumes of aquifers (2). Furthermore, the same monitoring well can be used for repeated determinations of the NAPL saturation since the methods rely on the quanti-fication of dissolved species and need only water samples. Partitioning tracer methods were originally developed to determine residual oil saturation in oil reservoirs (3, 4).
Recently, the methods have been adapted to locate and quantify NAPL contamination (2, 5, 6). These methods usually consist of the simultaneous injection of a conservative non-partitioning tracer along with one or several specific parti-tioning tracers. Partiparti-tioning tracers should partition between the NAPL and water phases, but should not be retarded in the absence of NAPL. On the basis of the retardation of the partitioning tracer relative to the non-partitioning tracer, the average NAPL saturation is calculated. The calculation relies on the assumption that a partitioning equilibrium is estab-lished between the NAPL and the water phase [local equi-librium assumption (5)]. So far, SF6(5, 6) and various alcohols (2) have been used as partitioning tracers to detect NAPL contamination. The aim of our study was to investigate the feasibility of the use of222Rn, a naturally occurring radioactive isotope, to detect and quantify NAPL contamination in aquifers.
222Rn is produced by the
R-particle decay of
226Ra, an isotope of the natural radioactive decay series of238U. 222Rn itself decays by anR-particle decay with a half-life of 3.8 days to a series of short-lived daughter products (218Po,214Pb,214Bi, 214Po). The222Rn activity can be determined based on the radioactive decay of222Rn and its daughter products (7, 8). 222Rn is a chemically inert noble gas; however, it partitions into benzene, toluene, octanol, and other NAPLs (7, 9). Its physical-chemical properties are summarized in Table 1. 222Rn emanates from minerals that contain 226Ra to the surrounding gas or water phase byR-recoil and diffusion (10-13). Surface waters usually contain little
222Rn since222Rn is released into the atmosphere. When surface water infiltrates into the subsurface, the 222Rn activity in the infiltrated water increases until a steady state between emanation and radioactive decay is reached (14, 15). The 222Rn activity in the water phase at this steady state is denoted as emanation-decay steady-state
222Rn activity throughout the text. The time necessary to establish the emanation -decay steady-state222Rn activity is about 5 half-lives (20 days). Hoehn and von Gunten (14) used the ingrowth of222Rn to assess underground residence times of bank infiltration. In their study,222Rn was transported without retardation in the absence of NAPL contamination, indicating that 222Rn did not sorb to the aquifer matrix. When groundwater, which contains 222Rn at emanation
-decay steady-state activity, migrates into a NAPL-contaminated zone of an aquifer, a decrease of the222Rn activity in the water phase is expected due to the partitioning of222Rn between water and NAPL. After the groundwater leaves the NAPL-contaminated zone, the222Rn activity in the water phase is expected to return to the original emanation-decay steady-state value.
In this study, we investigated whether a decrease in the 222Rn activity of groundwater in a NAPL-contaminated zone can be used to detect and quantify the contamination. Diesel fuel was chosen as a model NAPL. The diesel fuel-water partition coefficient was determined in bottles with222Rn containing water and diesel fuel. The partitioning of222Rn between diesel fuel and water was studied in batches and columns filled with water-saturated quartz sand from which 222Rn emanated. The aim of the batch experiments was to evaluate whether the partitioning of 222Rn at steady state corresponded to that expected based on the diesel fuel-water partition coefficient despite the continuous emanation and decay of222Rn. In the column study, the partitioning of222Rn between diesel fuel and water during advective transport was investigated and compared to the results of a mathematical model that relates NAPL saturation to 222Rn activities. In addition to the laboratory experiments,222Rn activities were measured in groundwater samples from a diesel fuel-* Corresponding author telephone:+41-1-823-5525; fax+
41-823-5210; e-mail address: hoehn@eawag.ch. †ETH.
‡EAWAG.
Published in Environmental science & technology 31, 11, 3180-3187, 1997 which should be used for any reference to this work
contaminated aquifer to evaluate whether the222Rn method has the potential to be used to detect and quantify NAPL saturation in the field.
Theory
Processes that govern the transport of partitioning tracers other than222Rn injected into aquifers have been mathemati-cally described elsewhere (2, 16). These equations do not apply to222Rn since222Rn emanates continuously from mineral surfaces and is subject to radioactive decay. Equations were established here that describe the activity of222Rn in NAPL-contaminated aquifers. The equations rely on the following assumptions: (i) the average distribution of226Ra, the parent nuclide of222Rn, in the solid phase is homogeneous on the macroscopic scale (14); (ii) the porosity of the aquifer material is constant; (iii) losses of222Rn from the saturated to the unsaturated zone can be neglected; (iv) the partitioning of 222Rn between the NAPL and water phase is in equilibrium; (v) the partition coefficient is independent of the NAPL saturation; (vi) the NAPL phase is immobile, and (vii) sorption of222Rn to the matrix is neglected. Based on these assump-tions, a one-dimensional mass balance equation for222Rn was established (eq 1) that takes into account advective and dispersive 222Rn transport, 222Rn emanation from mineral surfaces,222Rn decay, and partitioning of222Rn between the NAPL and water phase. The equation was derived in analogy to equations given by van Genuchten and Alves (17):
where t is time (s), x is the flow distance (m), S is the NAPL saturation of pore space (volume of NAPL divided by volume of pore space) (-), θ is the porosity (-), A is the
222Rn activity in water phase at location x at time t (kBq m-3
), ANAPLis the 222Rn activity in NAPL phase at location x at time t (kBq m-3
), q is the specific discharge of groundwater (m s-1
), D is the dispersion coefficient of222Rn in groundwater (m2s-1),
Fis the density of aquifer material (kg m-3), P is the 222Rn emanation rate from mineral surfaces per mass of dry aquifer material (kBq kg-1), and λ is the radioactive decay constant of222Rn (s-1).
Equation 2 describes the partitioning of222Rn between the NAPL and the water phase at equilibrium:
where K is the NAPL-water partition coefficient of 222Rn (
-). Substitution of eq 2 into eq 1 and rearrangement gives
Batch Experiments. For the batch experiments without
water flow, q and D in eq 3 can be set to zero, which leads to
Solving eq 4 gives
where A0is the222Rn activity in the water phase at t0)0. For batches with and without NAPL contamination, respectively, Aeis given by
and
where Ae S>0
is the emanation-decay steady-state
222Rn ac-tivity in the water phase of batches with NAPL contamination (kBq m-3) and A
e S)0
is the emanation-decay steady-state 222Rn activity in the water phase of batches without NAPL contamination (kBq m-3) A approaches A e S>0 or Ae S)0 , re-spectively, as t becomes large. Note that Ae
S>0 is smaller than Ae S)0 . Dividing eq 7 by eq 6 leads to According to eq 8, Ae S>0
is expected to decrease with in-creasing NAPL saturation S.
Column Experiment. For the flow-through columns, eq
3 was solved neglecting dispersion since transport of dissolved species was assumed to be dominated by advection. If necessary, there is also an analytical solution that includes dispersion (17). The following solution of eq 3 is obtained for steady-state conditions (∂A/∂t)0):
where κx(m-1) is given by
TABLE 1. Properties of
222Rn
decay constant 3.8 d-1 ref
water solubilitya 10.8 mM (20°C) 9
Kow 32.4(1.5 (20°C) 9
aAt 1 atm partial pressure of Rn.
∂ ∂t[(1-S)θA+θSA NAPL ]) -∂ ∂x[qA-(1-S)θD ∂A ∂x]+ (1-θ)FPλ-[(1-S)θA+θSA NAPL]λ (1) ANAPL)KA (2) θ[1+S(K-1)] ∂A ∂t ) -∂ ∂x(qA-(1-S)θD ∂A ∂x)+ (1-θ)FPλ-θ[1+S(K-1)]Aλ (3) θ[1+S(K-1)] ∂A ∂t )(1-θ)FPλ-θ[1+S(K-1)]Aλ (4) A)A e+(A 0-A e) -λt (5) AeS)0 ) (1-θ)FP θ(1+S(K-1)) (6) AeS >0 ) (1-θ)FP θ (7) AeS)0 AeS>0 )1+S(K-1) (8) A)A e+(A 0-A e)e -κxx (9) κx) θ[1+S(K-1)] q λ (10)
and A0 is the 222Rn activity in water phase at x0 (kBq m-3). A approaches Ae as x becomes large. Ae corresponds to Ae
S>0 for NAPL-contaminated columns (eq 6) and to Ae
S)0
for uncon-taminated columns (eq 7). While eq 8 can be used to estimate the NAPL saturation based on AeS>0and AeS)0, eq 9 describes how quickly Ae
S>0 and Ae
S)0
are approached. The 222Rn emanation rate P, the density of the aquifer material F, and the porosity θ do not have to be known if they are similar in the uncontaminated and the contaminated column.
Experimental
Set-up and Field Site
Diesel Fuel-Water Partition Coefficient. The diesel fuel -water partition coefficient for 222Rn was determined in bottles containing tap water and diesel fuel using a method similar to that used for the determination of octanol-water partition coefficients (18). Six bottles were filled with tap water. Analysis of tap water before and after filling showed that the 222Rn activity in the tap water remained constant. Afterwards, 18 mL of diesel fuel was added to every other bottle. The bottles were shaken at 12 °C. In bottles without diesel fuel, the 222Rn activity in the water phase was measured at 0, 7, and 31 h after filling; in bottles with diesel fuel, the 222Rn activity was measured at 3, 5, and 24 h after filling. The measurement made after 24 h of shaking confirmed that a partitioning equilibrium had been reached at the earlier sampling times. The intervals between the measurement of the contaminated and the uncontaminated samples were due to the fact that one measurement took approximately 2 h. The measured 222Rn activities were corrected for the time 2
difference between filling of the bottles and measurement. For each bottle with diesel fuel, the222Rn activity in the diesel fuel phase was calculated from the222Rn activity in the water phase and the222Rn activities in the corresponding bottle without diesel fuel. The diesel fuel-water partition coef-ficient, K, was obtained by dividing the calculated222Rn activity in the diesel fuel phase by the measured222Rn activity in the water phase (eq 2). The three values for K were averaged, and the standard uncertainty was calculated.
Batch Experiment. Two batch experiments were
per-formed with the same purified natural quartz sand (Zimmerli/ Carlo AG, Zurich, Switzerland) as was used in the222Rn study of Hoehn et al. (15). The grain size distribution of sand no. 1 used for the batch series 1 was slightly different from that of sand no. 2 used for batch series 2 and the column study (Table 2). Since the sand did not contain organic carbon (manufacturers specification), sorption of222Rn to the sand could be excluded. All experiments were performed at 12°C, which corresponds to the average groundwater temperature at the investigated field site. Since the moisture content of the aquifer material affects the distribution of NAPLs (19) and the aquifer material at the field site was most probably wet at the time of the contamination, the quartz sand was saturated with water before contamination. The water-saturated sand was mixed with diesel fuel (ESSO, Schlieren, Switzerland) for 10 min using an electric mixer. Separatory funnels (2 L) were filled completely with the quartz sand and closed with glass stoppers without any headspace. In each batch series, two separatory funnels were filled with water-saturated uncontaminated quartz sand, and three of them were filled with water-saturated quartz sand contaminated with diesel fuel. The porosity of this sand was determined to be 0.46(0.02, based on the volume of water added to the dry sand and the total volume of the water-saturated sand in the separatory funnels. The high porosity is due to the narrow grain-size distribution of the sand (Table 2) and is in the same as those found in sand columns used by other investigators (e.g., ref 5). From each separatory funnel containing contaminated sand, three samples were taken before filling and three samples were taken after the experi-ment in order to test the homogeneity of the diesel fuel contamination. The samples were analyzed for total hydro-carbon concentration by IR spectrometry. The separatory funnels were stored at 12°C for 4 weeks without shaking. According to eq 5, after 4 weeks, the deviation between the actual222Rn activity and the emanation
-decay steady-state 222Rn activity is expected to be less than 1%. After 4 weeks, the water was drained from the separatory funnels into 120-mL vials using a glass tube of 36 cm length and 2 mm inner diameter. The222Rn activities in these samples were measured using the RAD7 instrument (see below). A sample volume of 50 mL was extracted with CCl4 to determine dissolved hydrocarbon concentrations (see below). The filled sepa-ratory funnels are referred to as batches throughout the text.
Column Experiment. For the column experiment, the
same quartz sand was used as was for the batch series 2 (Table 2). The dimensions and operation parameters of the columns are given in Table 3. The size of the columns was chosen based on the minimal sample volume necessary (120
mL) and the required residence time (13 days) of the water in the columns to reach 90% of Ae
S)0
. The columns had a sieve plate at the bottom, which was covered with glass wool, and lateral sampling ports. The sampling ports were fitted with stainless steel hypodermic needles of an inner diameter of 1.6 mm (Unimed, Geneva, Switzerland). Both columns were placed in a vertical position. Column 1 was filled with water-saturated uncontaminated quartz sand; column 2 was filled with quartz sand contaminated with diesel fuel as described for the batch experiment. During the filling of column 2, nine samples of sand were taken from different filling depths and analyzed for total hydrocarbon concentra-tion by IR spectrometry. The columns were connected with steel capillaries and operated with distilled water using a JASCO HPLC pump (JASCO Corporation, Tokyo, Japan). The water contained 10 mM CaCl2 to obtain an ionic strength similar to that at the studied field site. The water flowed first through column 1 (uncontaminated) and then through column 2 (contaminated). The mean residence time of the water, the effective porosity, and the dispersion coefficient were determined by a tracer test with Br
-. NaBr was added to the water at a concentration of 1 mM during 8 weeks. The breakthrough curves were analyzed using the numerical model code CXTFIT2 (20). The transport parameters were similar for both columns (Table 3). After 8 weeks of operation, water samples were taken to measure the 222Rn activities. The flow was then stopped for 4 weeks after which time water samples were again taken. At flow conditions, the water samples were taken starting at the column outlet, whereas at no flow conditions, sampling was started at the column inlet to minimize the disturbance. For sampling, a glass syringe of 120-mL volume (Merck, Dietikon, Switzerland) was con-nected to the steel needles of the sampling ports and allowed to fill within 20 h at a rate of 6 mL h-1. In tests with glass syringes filled with222Rn-containing water, no losses of222Rn except for decay could be observed within 30 h. At the sampling port at 10 cm, the222Rn activity at no flow conditions was not determined because it is likely that the sample would be influenced by water from the column inlet during sampling. The water samples were transferred to 120-mL sampling vials, and the 222Rn activity was immediately measured. The measured 222Rn activities were corrected for decay during the time between sampling and measurement.
Field Site. The field site (Figure 1) is located in central
Switzerland, 555 m above sea level, and represents a hydro-geological situation typical for the perialpine belt of Swit-zerland. The shallow unconfined valley-fill aquifer consists of glaciofluvial outwash deposits (sand and gravel; saturated thickness 2-8 m), which usually contain less than 1.5 ‰ (w/w) organic carbon (21). The water table is located 3-4
TABLE 2. Grain Size Distribution of the Quartz Sand
fractional weight (%)
grain size (mm) sand 1a sand 2b
0.5-1.0 2.8 3.0
0.25-0.5 73.3 69.2
0.125-0.25 22.9 25.6
0.063-0.125 0.9 2.0
<0.063 0.02 0.01
aUsed for batch series 1.bUsed for batch series 2 and columns.
TABLE 3. Dimensions and Operation Parameters of Columns
column 1 column 2 Dimension length (cm) 120 inner diameter (cm) 6.8 sampling ports at (cm)a 0, 10, 30, 60, 90, 120 Operation Parameters temperature (°C) 12
filling (kg dry weight) 6.7
flow rate (mL h-1) 6.0
(0.2 diesel fuel saturation (%) 0.0 1.4(0.06b effective porosityc(
-) 0.44(0.02 0.42(0.02 Peclet numberc,d(-) 1070(50 1100(50 mean residence timec(d) 13.2
(0.5 12.8(0.5
aSamples at 0 cm taken before water entered the column; samples
at 120 cm taken at column outlet.bAverage of nine measurements. cFrom tracer experiment with Br
-as a tracer.dPeclet numberPe
) Lv/D where L is column length, v, average flow velocity, and D, dispersion coefficient.
m below the surface. On the basis of the average hydraulic conductivity (0.5× 10⁻³
m s-1
), the estimated porosity (0.19), and the hydraulic gradient (2-3%), an average flow velocity of 4.5-7 m d
-1
at natural gradient flow was calculated using Darcy’s law. The average temperature of the groundwater was 12°C.
The aquifer was contaminated in 1988 by 10-12 m 3of diesel fuel from a leaking storage tank of a gas station. After discovery of the contamination, contaminated material in the vicinity of the tank (5-10 m) was excavated, floating diesel fuel in free phase was removed by pumping, and an in situ bioremediation scheme was implemented. The initial hy-drocarbon concentrations were between 0.9 and 2.5 mg kg-1 (S)1.5-4%) in drilling cores, between 5.5 and 8.6 mg kg
-1 (S)9-14%) on the northern boundary of the excavated zone, and up to 72 g kg-1(S
)100%) below the location of the tank. The diesel fuel saturation was calculated assuming a porosity of 0.19 and a density of the aquifer material of 2.5 kg L-1. The field site and remediation measures are described in more detail elsewhere (22, 23). Groundwater samples for222Rn were taken as described in ref 14.
Analytical Methods
Analysis of222Rn Activities. In the water samples from the laboratory experiments,222Rn activities were measured with a Niton RAD7 instrument and a RAD-H2O attachment (both from Niton Corporation, Bedford, MA). The RAD-H2O
attachment transfers 222Rn from the water sample to the measurement cell by purging222Rn out of the sample during 5 min in a closed loop filled with air. According to the manufacturer, the stripping efficiency of the222Rn is 94% for 250-mL sample vials and 99% for 40-mL sample vials. For the 120-mL vials that were used in the laboratory experiments, a stripping efficiency of 97% was assumed. Dissolved hydrocarbons at concentrations measured in the experiments (<3.5 mg L
-1
) did not influence the efficiency of 222Rn stripping. In the measurement cell of the RAD7, the222Rn activity is determined after electrostatic collection of R emitters on a solid-state detector based on the218Po
R-decay. After the secular equilibrium between222Rn and218Po was established (15 min), the decay of218Po (T
1/2)3.05 min) was counted four times during 45 min. The detection limit is 0.2 kBq m-3 for 120-mL vials. The standard deviation of the measurement is(10%. In field samples,
222Rn activities were measured by liquid scintillation counting (LSC) except for samples taken on October 29, 1996, for which the Niton RAD7 was used. Filling of the sampling bottles, extraction of222Rn from the water into a scintillation liquid (toluene basis), measurement of the decay of222Rn and four daughter products with LSC, and the calculation of the222Rn activity at the time of sampling is reported in Hoehn and von Gunten (14). Instrument signals were converted to 222Rn activities and expressed in kBq m-3. The detection limit of the LSC method is 0.02 kBq m-3. The standard deviation of the measurement is(20% (14).
Analysis of Hydrocarbon Concentrations. To determine
the hydrocarbon saturation of the contaminated quartz sand, 20 g of contaminated sand was dried with 8 g of Na2SO4and extracted with 30 mL of CCl4by shaking at 250 rpm in a closed flask on a rotary shaker for 48 h at 25°C. Hydrocarbon concentrations in the extracts were quantified using IR spectrometry and diesel fuel standards (24).
For the analysis of dissolved hydrocarbons in field samples, 1-L glass bottles were completely filled and sealed with Teflon-lined covers. To determine concentrations of dissolved hydrocarbons, 400 mL of water was extracted twice with 20 mL of CH2Cl2(B+J Brand High Purity Solvent, Fluka AG, Buchs, Switzerland) containing the surrogate standard o-terphenyl. The hydrocarbons were analyzed and quantified with capillary GC as described in Bregnard et al. (24). The detection limit was at 0.01 mg L-1. The standard uncertainty was
(20%. The reported uncertainties of all measured values are standard uncertainties determined according to ref 25. Uncertainties of calculated values were estimated using the law of propa-gation of uncertainty (25).
Results and Discussion
Diesel Fuel-Water Partition Coefficient. In bottles con-taining diesel fuel and water, the diesel fuel-water partition coefficient of222Rn was determined to be 40
(2.3 at 12°C (n)3). The diesel fuel-water partition coefficient was similar to the toluene-water partition coefficient, which is 42 at 10 °C (7). It was also in the range of the partition coefficients of SF6(5), which is 32(1.33 for water-trichloroethylene, 24 (1.27 for water-dichloromethane, and 45(1.89 for water -o-dichlorobenzene.
FIGURE 1. Map of field site with water table on October 18, 1995, at natural gradient conditions. Water table contours are interpolations of measurements in monitoring wells.
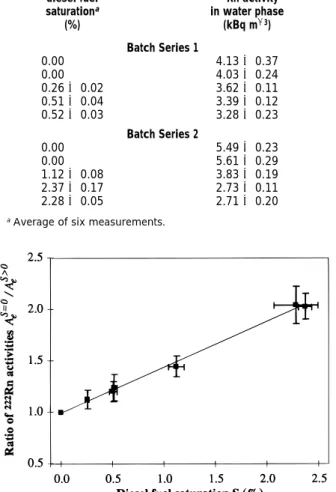
Batch Experiment. In the batches, the relative standard
deviation of the diesel fuel concentration was below 8% (n ) 6). This suggests that the distribution of the diesel fuel was quite homogeneous. In both batch series, the 222Rn activity in the water phase decreased with increasing diesel fuel saturation as was expected from eq 8 (Table 4). 222Rn activities in water samples of batches with a similar diesel fuel saturation corresponded within the range of uncertainty. For batches without contamination, the 222Rn activity was higher in batch series 2 than in batch series 1. The higher 222Rn activities in batch series 2 can be explained by the higher fraction of small grains in the sand of batch series 2 (Table 2). The small grains
release a larger fraction of the222Rn than large grains due to their higher surface area (10). In Figure 2, the ratio of the average222Rn activity in water from separatory funnels without contamination to the222Rn activity in water from separatory funnels with contamination (Ae
S)0 /Ae
S>0
) was plotted as a function of the diesel fuel saturation S. A linear dependence of Ae
S)0 /Ae
S>0
on S was found, suggesting that the partition coefficient of222Rn is independent of the diesel fuel saturation in the studied range of diesel fuel saturation. Based on the linear relation between Ae
S)0 /Ae
S>0
and S given by eq 8, the diesel fuel-water partition coefficient K of
222Rn and its standard uncertainty were calculated using linear regression [least square method (26)]. A diesel fuel-water partition coefficient of 45(2.0 at 12°C was obtained for diesel fuel saturation of up to 2.4%. The calculated partition coefficient of222Rn was similar to the partition coefficient determined in the bottles with tap water and diesel fuel (40(2.3). Thus, the disperse distribution of the diesel fuel in the sand and the continuous222Rn emanation and radioactive decay did not impair the222Rn partitioning between the diesel fuel and water.
Column Experiment/No Flow Conditions. At no flow
conditions, the222Rn activity was similar in water samples from all sampling ports of column 1, indicating that the222Rn emanation was constant throughout the columns (Table 5). Furthermore, the average222Rn activity in water samples from column 1 (5.46(0.15 kBq m
-3) corresponded to the average 222Rn activity in water samples from the uncontaminated batches of batch series 2 (5.55(0.26 kBq m
-3; Table 4). In the contaminated column 2, the222Rn activities were also
similar at all sampling ports (Table 5). This confirms that the diesel fuel was homogeneously distributed. The measured average222Rn activity in water from column 2 (3.53
(0.16 kBq m-3; Table 5) corresponded to the expected222Rn activity in water from column 2 (3.38(0.18 kBq m
-3). The expected activity was based on the measured diesel fuel saturation S in column 2, the diesel fuel-water partition coefficient K from the batch experiment, and the average222Rn activity at no flow conditions in column 1 using the linear relation between Ae
S)0 /Ae
S>0
and S. This relationship was derived in the theory section (eq 8) and verified in the batch experiments (Figure 2).
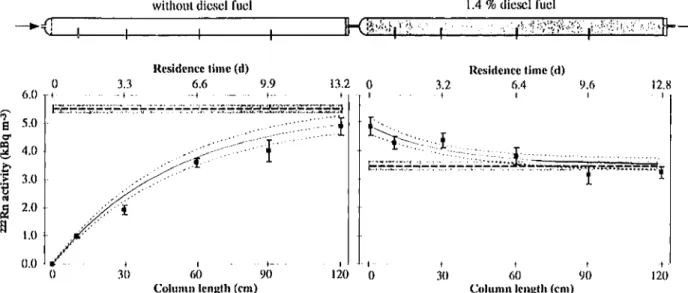
Column Experiment/Flow Conditions. At flow
condi-tions, the222Rn activity in the water phase increased in the uncontaminated column 1 with increasing column length or residence time (Figure 3). In the contaminated column 2, the222Rn activity in water samples decreased with increasing column length (Figure 3). To evaluate whether the observed 222Rn activities in the water phase approached the no flow 222Rn activities as predicted by the model, the expected222Rn activities were calculated using eq 9. The parameters required in eq 9 were obtained as follows: the diesel fuel-water partition coefficient K was taken from the batch experiment, S corresponded to the measured diesel fuel saturation, and Ae
S)0 and Ae
S>0
corresponded to the average 222Rn activity measured at no flow conditions in columns 1 and 2, respectively. In both columns, the measured222Rn activities agreed with the predicted values (Figure 3). In column 2, at 60, 90, and 120 cm, the deviation between the222Rn activities at flow conditions and the222Rn activities at no flow conditions was within the range of uncertainty of the measurement. This suggests that a residence time in the contaminated zone of at least 6.4 days (sampling port at 60 cm) is required before measured aqueous222Rn activities can be used to estimate the diesel fuel saturation using eq 8.
To evaluate the accuracy of the222Rn method in deter-mining NAPL saturation, the diesel fuel saturation in column 2 was calculated using the linear relation between Ae
S)0 / Ae
S>0
and S that was derived in the theory section (eq 8) and verified in the batch experiments. For Ae
S>0
, the average of the222Rn activities measured in column 2 at 60, 90, and 120 cm at flow conditions was taken (3.43(0.20 kBq m
-3). For Ae
S)0
, the 222Rn activity measured at flow conditions in column 1 at 120 cm (4.9 (0.32 kBq m
-3) was used. The diesel fuel-water partition coefficient K was taken from the batch experiment. From these values, the calculated diesel fuel saturation was 1.0(0.28%, which is slightly lower than the measured diesel fuel saturation (1.4(0.06; Table 3). The deviation between the calculated and the measured diesel fuel saturation was due to the fact that Ae
S)0
was not reached in column 1 (Figure 3). If the average no flow222Rn activity in column 1 was used for Ae
S)0
, a diesel fuel saturation of 1.4 ( 0.17% would be obtained that corresponded to the measured diesel fuel saturation.
222Rn Activities at the Field Site. At the field site, groundwater samples were taken three times at natural gradient flow conditions to determine the 222Rn activities. The222Rn activities measured in the monitoring wells KB2, KB8, and KB9 were assumed to represent Ae
S)0
(Table 6). A
TABLE 4. Diesel Fuel Saturation and
222Rn Activities of Water
Samples from Batches
diesel fuel saturationa (%) 222Rn activity in water phase (kBq m-3) Batch Series 1 0.00 4.13(0.37 0.00 4.03(0.24 0.26(0.02 3.62(0.11 0.51(0.04 3.39(0.12 0.52(0.03 3.28(0.23 Batch Series 2 0.00 5.49(0.23 0.00 5.61(0.29 1.12(0.08 3.83(0.19 2.37(0.17 2.73(0.11 2.28(0.05 2.71(0.20
aAverage of six measurements.
FIGURE 2. Correlation of the ratio of222Rn activities in water samples
from batches without and with diesel fuel contamination vs the diesel fuel saturation. (s) Linear regression; intercept, 1.0; slope, 0.44;R2
)0.9966.
TABLE 5.
222Rn Activities in Water Samples at No Flow
Conditions
column 1 column 2 30 cm 5.74(0.24 3.77(0.25 60 cm 5.52(0.28 3.83(0.17 90 cm 5.77(0.22 3.17(0.22 120 cm 5.12(0.12 3.35(0.29 average 5.46(0.15 3.53(0.16 5regional flow model indicated that the groundwater was in the aquifer for more than 20 days before these wells were reached (unpublished data), and the wells are situated upgradient of the diesel fuel-contaminated zone. 222Rn activities significantly smaller than the average value of the wells KB2, KB8, and KB9 are referred to as222Rn deficits (Table 6).
In the monitoring wells KB7, S6, S7, and S8, a222Rn deficit was observed at all sampling days (Table 6). In the wells KB1, KB3, and KB15, a222Rn deficit was observed only at one or two sampling days (Table 6). 222Rn deficits were only found
FIGURE 3. Schematic illustration of the columns (operated in upright position).222Rn activities in water samples from column 1 (uncontaminated)
and column 2 (contaminated with diesel fuel) after 8 weeks of steady flow (9). (s)222Rn activities calculated based on the average222Rn
activities at no flow conditions and the average diesel fuel saturation using eq 9. (- - -) Range of standard uncertainty of the calculated
222Rn activity. (
--) Average
222Rn activity at no flow conditions. (Hatched area) Range of standard uncertainty of the average222Rn activity
at no flow conditions.
TABLE 6.
222Rn Activities and Concentrations of Dissolved
Hydrocarbons Measured in Water Samples from Monitoring
Wells of the Field Site in Menziken
222Rn activitya
(kBq m-3)
dissolved hydrocarbonsb
(mg L-1)
well 9/12/94 10/18/95 10/29/96 10/18/95
Upgradient of Initially Contaminated Zone
KB2 6.0 7.5 9.0 <0.01 KB8 -c 9.4 9.8 <0.01 KB9 6.9 7.8 10.1 -averaged 6.5 8.2 9.6
In Initially Contaminated Zone
KB7 4.7 4.4 6.1 0.35 S6 3.7 4.7 5.2 0.20 S7 2.2 5.7 6.0 0.01 S8 4.2 5.2 - 0.10 KB1 5.7 6.9 7.7 0.21 KB3 5.2 6.4 8.0 0.04 KB10 - 8.6 10.9 <0.01 KB12 - 9.2 10.1 <0.01 KB15 4.5 8.8 9.5 <0.01
Outside but Not Upgradient of Initially Contaminated Zone
KB5 7.7 10.5 12.2
-KB11 - 9.2 8.7
-KB14 - 9.5 11.4 <0.01
aStandard uncertainty of222Rn activity measurement:
(20% on 12/ 9/94 and 10/18/95 and(10% on 10/29/96.
222Rn activities significantly
smaller than average of222Rn activities measured at wells KB2, KB8,
and KB9 (Ae S)0
) are printed in bold.bStandard uncertainty of
mea-surement of dissolved hydrocarbon concentration: (20%.
c
-, not measured.dAverage of222Rn activities measured at wells KB2, KB8
and KB9.
in monitoring wells within the zone that was initially contaminated with non-aqueous-phase diesel fuel. However, the extension of the initially contaminated zone did not necessarily correspond to the extension of the contaminated zone at the time of the 222Rn activity measurements. To establish the correlation between the 222Rn deficits and the presence of diesel fuel, dissolved hydrocarbon concentrations were measured on October 18, 1995. Except for KB1, all monitoring wells that contained dissolved hydrocarbons above the detection limits showed a 222Rn deficit (Figure 4). This provides further evidence that the 222Rn deficit was due to the presence of the diesel fuel. However, there is no quantitative correlation between dissolved diesel fuel and the diesel fuel saturation.
Estimation of the Diesel Fuel Saturation. The 222Rn activities measured in groundwater samples from the wells KB7, S6, S7, and S8 were used to estimate the remaining diesel fuel saturation from the location of the former tank to the wells of cross section B-B′ (Figure 1) after the end of the in situ bioremediation. The values measured in 1994 were not included in the calculation because the in situ bioremediation was re-implemented between October 1994 and May 1995. The diesel fuel saturation was estimated using the linear relation between Ae
S)0 /Ae
S>0
, and the diesel fuel saturation S (eq 8). AeS)0was assumed to correspond to the average of the 222Rn activities measured in groundwater from the wells KB2, KB8, and KB9. The value for K was taken from the batch experiment. The ratio Ae
S)0 /Ae
S>0
was between 1.45 and 1.86 for the wells KB7, S6, S7, and S8 in 1995 and 1996 with an average value of 1.67 ( 0.15 (n ) 7). On the basis of this value, an average diesel fuel saturation of 1.5 ( 0.35% was obtained. The calculated value is in the range of the value measured in an aquifer sample excavated from the contami-nated zone in November 1992, when a diesel fuel saturation of S ) 1.9% was found (24). However, in 1992, aquifer material was excavated only at one location.
The diesel fuel saturation that was calculated based on the222Rn activities in groundwater has to be considered as a rough estimation of the actual diesel fuel saturation for several reasons:
(1) In aquifers, diesel fuel and other NAPLs are usually heterogeneously distributed while the equation used to calculate the diesel fuel saturation relies on the assumption of a homogeneous NAPL distribution. Furthermore, the
laboratory experiments made to verify the equations were performed using a homogeneous diesel fuel saturation.
(2) Mixing of groundwater from the contaminated zone with groundwater from the uncontaminated zone can lead to an increase of the222Rn activity in the groundwater sample and thus to a lower calculated NAPL saturation (eq 8).
(3) If the residence time of the groundwater in the contaminated zone is low, the emanation-decay steady-state 222Rn activity may not be reached (see column experiment). If the emanation-decay steady-state is not reached in the contaminated zone, the NAPL is underestimated when calculated using eq 8.
Further investigations will focus on the effect of these three factors on222Rn activities in the field and thus on the calculated diesel fuel saturation.
Comparison of222Rn with Artificial Partitioning Tracers. Compared to artificially injected partitioning tracers,222Rn has an advantage to be naturally present in aquifers, whereas the addition of an artificial tracer to a large groundwater volume requires an expensive groundwater injection scheme. To quantify the NAPL saturation,222Rn activities need to be measured, in principle, only once, while the use of artificial tracers requires many measurements to obtain complete breakthrough curves (2, 6). To use222Rn as a partitioning tracer, the 222Rn emanation rate must be constant in the aquifer. This can be verified by measuring222Rn activities in the water phase at several locations in the uncontaminated zone. Similarly to other partitioning tracers,222Rn reflects the NAPL saturation along flow paths of the groundwater and not necessarily the average saturation in a given volume
of the aquifer. Variations of the hydraulic conductivity due to variations of the geological structure or due to the presence of NAPL at a high saturation may cause the groundwater to bypass the NAPL-contaminated zone. This may lead to an underestimation of the actual NAPL saturation (6). In addition, mass transfer limitations may cause an underes-timation of the NAPL saturation (6). When using222Rn as a partitioning tracer, the diesel fuel saturation close to the monitoring well is weighted more strongly than the NAPL saturation further away since222Rn activities re-equilibrate in response to changing NAPL saturation. Furthermore,222Rn activities increase again once the groundwater has left the zone of NAPL contamination. Therefore, monitoring wells used to determine222Rn activities should be located close to or within the NAPL-contaminated zone.
Acknowledgments
The authors thank G. Wyssling, A. Sto¨ckli, W. Jucker, and Ch. Herzog for cooperation at the field site, H. R. Zweifel for analyzing samples, and K. Ha¨berli and W. Kinzelbach for stimulating discussions. The manuscript was significantly improved through reviews by G. T. Townsend and four unknown referees. The work was supported by the Swiss National Science Foundation (Priority Programme Environ-ment).
Literature Cited
(1) Mayer, A. S.; Miller, C. T. J. Contam. Hydrol. 1992, 11, 189-213. (2) Jin, M.; Delshad, M.; Dwarakanath, V.; McKinney, D. C.; Pope, G. A.; Sepehrnoori, K.; Tilburg, C. E.; Jackson, R. E. Water Resour.
Res. 1995, 31, 1201-1211.
(3) Tang, J. S.; Harker, B. J. Can. Pet. Technol. 1991, 30, 76-85. (4) Tang, J. S.; Harker, B. J. Can. Pet. Technol. 1991, 30, 34-42. (5) Wilson, R. D.; Mackay, D. M. Environ. Sci.Technol. 1995, 29,
1255-1258.
(6) Nelson, N. T.; Brusseau, M. L. Environ. Sci.Technol. 1996, 30, 2859-2863.
(7) Horiuchi, K.; Murakami, Y. Int. J. Appl. Radiat. Isot. 1981, 32, 291-294.
(8) Surbeck, H. Nucl. Tracks Radiat. Meas. 1993, 22, 463-468. (9) Wong, C. S.; Chin, Y.-P.; Gschwend, P. M. Geochim. Cosmochim.
Acta 1992, 56, 3923-3932.
(10) Andrews, J. N.; Wood, D. F. Trans. Inst. Min. Metall. 1972, 81, 198-209.
(11) Rama. Curr. Sci. 1991, 61, 751-755.
(12) Krishnaswami, S.; Seidemann, D. E. Geochim. Cosmochim. Acta
1988, 52, 655-658.
(13) Maraziotis, E. A. Environ. Sci. Technol. 1996, 30, 2441-2448. (14) Hoehn, E.; von Gunten, H. R. Water Resour. Res. 1989, 25, 1795
-1803.
(15) Hoehn, E.; von Gunten, H. R.; Stauffer, F.; Dracos, T. Environ.
Sci. Technol. 1992, 26, 734-738.
(16) Brusseau, M. L. Water Resour. Res. 1992, 28, 33-45. (17) Van Genuchten, M. T.; Alves, W. J. U.S. Department of Agriculture,
Technical Bulletin No. 1661; Washington, DC, 1982.
(18) Leo, A.; Hansch, C.; Elkins, D. Chem. Rev. 1971, 71, 525-553. (19) Mercer, J. W.; Cohen, R. M. J. Contam. Hydrol. 1990, 6, 107-163. (20) Toride, N.; Leij, F. J.; van Genuchten, M. T. U.S. Salinity Laboratory, Agricultural Research Service, Research Report No. 137. U.S. Salinity Laboratory: Riverside, CA, 1995.
(21) Schwarzenbach, R. P.; Westall, J. Environ. Sci. Technol. 1981, 15, 1360-1366.
(22) Hunkeler, D.; Ho¨hener, P.; Ha¨ner, A.; Bregnard, T. P.-A.; Zeyer, J. Quantification of hydrocarbon mineralization in a diesel fuel-contaminated aquifer treated by in situ-biorestoration.
Ground-water Quality: Remediation and Protection; IAHS Publication
No. 225; IAHS Press: Wallingford, Oxfordshire, 1995; pp 421 -430.
(23) Hunkeler, D.; Ho¨hener, P.; Bernasconi, S.; Zeyer, J. Water Ressour.
Res. Submitted for publication.
(24) Bregnard, T. P.-A.; Ho¨hener, P.; Ha¨ner, A.; Zeyer, J. Environ.
Toxicol. Chem. 1996, 15, 299-307.
FIGURE 4. 222Rn activities (9) and dissolved hydrocarbon
concen-trations (() measured on October 18, 1995, in groundwater from monitoring wells; (A) along the cross section A-A′; (B) along the
cross section B-B′. (- -) Average of
222Rn activities measured on
October 18, 1995, in wells KB2, KB8, and KB9 () background).
(Hatched area) Range between highest and lowest222Rn activity
measured in these three wells.
(25) International Organization for Standardization. Guide to the
expression of uncertainty in measurement; International
Orga-nization for Standardization: Geneva, 1993.
(26) Zar, J. H. Biostatistical analysis; Prentice-Hall: Englewood Cliffs, NJ, 1984.