Diversity of Cortico-descending Projections:
Histological and Diffusion MRI Characterization
in the Monkey
Giorgio M. Innocenti
1,2,3
, Roberto Caminiti
4
, Eric M. Rouiller
5
,
Graham Knott
6
, Tim B. Dyrby
7,9
, Maxime Descoteaux
8
and Jean-Philippe Thiran
3,10
1
Department of Neuroscience, Karolinska Institutet, Retzius vág 8, Stockholm S7177, Sweden,
2Brain and Mind
Institute, EPFL, Lausanne CH-1015, Switzerland,
3EPFL-STI-IEL-LTS5, Station 11, Lausanne CH-1015,
Switzerland,
4Dipartimento di Fisiologia e Farmacologia, SAPIENZA Universitá di Roma, Piazzale Aldo Moro 5,
Roma 00185, Italy,
5Department of Medicine, Swiss Primate Competence Center for Research, Fribourg
Cognition Center, University of Fribourg, Ch du Musee 5, 1700 Fribourg, Switzerland,
6BioEM Facility, Faculty of
Life Sciences, EPFL SV PTECH PTBIOEM AI 0143 Station 19, 1015, Lausanne, Switzerland,
7Danish Research
Centre for Magnetic Resonance, Centre for Functional and Diagnostic Imaging and Research, Copenhagen
University Hospital, Hvidovre, Copenhagen, Denmark,
8Department of Computer Science, Sherbrooke
Connectivity Imaging Laboratory (SCIL), Centre de Recherche CHUS, Sherbrooke University, 2500 Boul, Québec
J1K 2R1, Canada,
9Department of Applied Mathematics and Computer Science, Technical University of
Denmark, Kongens Lyngby, Capital Region, Denmark and
10Department of Radiology, University Hospital
Center (CHUV), University of Lausanne (UNIL), Ecole Polytechnique Fédérale de Lausanne (EPFL) Signal
Processing Lab (LTS5) EPFL-STI-IEL-LTS5 Station 11, Lausanne 1015, Switzerland
Address correspondence to: Giorgio M. Innocenti, Signal Processing Laboratory (LT55) Ecole Polytechnique Fédérale de Lausanne (EPFL), Switzerland. Email: [email protected]
Abstract
The axonal composition of cortical projections originating in premotor, supplementary motor (SMA), primary motor (a4), somatosensory and parietal areas and descending towards the brain stem and spinal cord was characterized in the monkey with histological tract tracing, electron microscopy (EM) and diffusion MRI (dMRI). These 3 approaches provided
complementary information. Histology provided accurate assessment of axonal diameters and size of synaptic boutons. dMRI revealed the topography of the projections (tractography), notably in the internal capsule. From measurements of axon diameters axonal conduction velocities were computed. Each area communicates with different diameter axons and this generates a hierarchy of conduction delays in this order: a4 (the shortest), SMA, premotor (F7), parietal, somatosensory, premotor F4 (the longest). We provide new interpretations for i) the well-known different anatomical and
electrophysiological estimates of conduction velocity; ii) why conduction delays are probably an essential component of the cortical motor command; and iii) how histological and dMRI tractography can be integrated.
Key words: axon diameters, conduction velocity, corticofugal projections, diffusion tractography, histology
http://doc.rero.ch
Published in "Cerebral Cortex doi: 10.1093/cercor/bhx363, "
which should be cited to refer to this work.
Introduction
One of the strongest, time-honored structural-functional rela-tions in the neurosciences is that between axon diameter and conduction velocity of action potentials. This relation was
established by Hursch (1939) in a foundational study,
super-vised by nobody less than Gasser, Grundfest and Lorente de No, at Rockefeller University. This relation was an essential build-ing block in Erlanger and Gasser’s structural/functional
classifi-cation of peripheral nervefibers leading to the attribution of
Nobel prize to Gasser in 1945 (Gasser 1945). It is now textbook
knowledge that peripheral axons can be subdivided in 3 clas-ses, A,B and C, characterized by different diameters and con-duction velocities to which correspond functional properties ranging from axons to motor neurons and muscle spindle affer-ents (the fastest) to pain afferaffer-ents and postganglionic sympa-thetic axons (the slowest).
Over the last few years some of us have tried to extend the analysis of axon diameters and conduction velocities to the central nervous system using a combination of histological techniques coupled to the computation of axonal conduction
velocities and axonally generated conduction delays (Caminiti
et al. 2009,2013;Tomasi et al. 2012;Innocenti et al. 2014). The overall picture emerging is that the brain consists of axonal pathways conducting at different velocities and generating dif-ferent conduction delays between brain sites. It is a bewildering dynamic view of brain function where axons perform funda-mental temporal transformations unlike cables in man-made
devices (Innocenti 1995;Innocenti et al. 2016).
The results thus far show that axon diameters differ depending on the area of origin, in a hierarchical manner, with primary motor and somatosensory areas issuing the fastest axons to some tracts, notably the corpus callosum, but also that the same area can issue axons of different diameters to
different targets (Caminiti et al. 2009; Innocenti et al. 2014).
Thesefindings have prompted some functional interpretations
(Innocenti et al. 2014,2016) although other aspects, notably the slowing down and dispersion of conduction delays in the human brain, compared to the chimpanzee and macaque brain (Caminiti et al. 2009) raise open questions.
The multiple projections originating from cerebral cortex are becoming the target of diffusion magnetic resonance (dMRI) studies which can potentially resolve axon diameters in brain tracts non-invasively and faster than the histological methods (Barazany et al. 2009; Dyrby et al. 2013; Daducci et al. 2016;
Glasser et al. 2016;Innocenti et al. 2016). Two sets of projec-tions are prominent due to the extremely large number of axons, contained within macroscopically identifiable tracts: the corpus callosum (CC) and the pyramidal tract. These 2 tracts share some crucial features. First, they undergo a phase of axo-nal overproduction (exuberance) and partial elimination in
development (Innocenti et al. 1977; Galea and Darian Smith
1995; reviewed in Innocenti and Price 2005; Luo and O’Leary
2005) and require experience for their maintenance and
matu-ration. Second, both tracts consist of axonal populations of dif-ferent origin which, in the case of CC, also differ in diameter
and hence conduction velocity (Caminiti et al. 2009, 2013;
Tomasi et al. 2012).
The pyramidal tract originates from multiple areas, not only
from the primary motor cortex (a4) on precentral gyrus (Van
Crevel and Verhaart 1963; Coulter and Jones 1977; Nudo and Masterton 1990;Luppino et al. 1994;Rouiller et al. 1996;Dum and Strick 1991,2002;He et al. 1995). Nevertheless the axonal properties of these projections are uncharted to the exception
of electrophysiological investigations aimed at defining the conduction properties of a4, supplementary motor area (SMA)
and ventral premotor projections (Maier et al. 2002; Firmin
et al. 2014). Unfortunately the electrophysiological investiga-tions match the anatomical data only in part (Discussion).
In this study we performed a detailed analysis of cortico-descending projections (CDP) of different origin in the monkey using histological method and dMRI, ex vivo. The goals were to characterize CDP in terms of axonal composition and to com-pare advantages and disadvantages of the histological versus imaging approaches.
The definition of CDP, particularly when obtained non-invasively by imaging, will benefit diagnosis and therapy of neurological conditions, including traumatic or vascular brain insults and degenerative diseases. It will also benefit the attempts to regenerating corticospinal tract (CST) after lesion or the production of robotic limbs improving or supplementing biological motion.
Materials and Methods
Light MicroscopyInjection Sites
Data were obtained in 7 macaca fascicularis and 2 macaca mulatta monkeys injected in a4 (5 cases); premotor a6, F4 and F7 (1 case each); Supplementary motor area (SMA, 1 case); somatosensory a2 (1 case); parietal cortex PEa/AIP (2 cases) (STable 1) The mon-keys came from the SAPIENZA laboratory in Rome (7 cases) or from the Swiss primate center in Fribourg (2 cases). All the ani-mals were injected with Biotinylated Dextran Amine (BDA). The surgical procedures, care of the animals and histological pro-cessing of the Rome and Fribourg monkeys were described
pre-viously (Rouiller et al. 1996; Tomasi et al. 2012; Fregosi et al.
2017). A selection of injection sites is shown in Figure1. Notice
that all injection sites where equivalent in terms of volumes and locations in the gray matter.
Injections in a4 differed across animals. In CCT2 only 1 injection was placed in a4, on the convexity of precentral gyrus, in its dorsal part. In CCT5 2 injections were placed one on the convexity of the precentral gyrus the other extending into the anterior bank of the central sulcus, both dorsally. CCT9 received 4 injections 2 on the convexity and 2 in the anterior bank of central sulcus, at an intermediate dorso-ventral posi-tion. CCT12 received 4 injections 2 of which on the convexity and 2 on the anterior bank of the precentral sulcus of which 2 medial and 2 lateral. In M93-80 the injection spanned both the rostral and the caudal a4 at an intermediate mediolateral loca-tion on the postcentral gyrus.
Measuring and Sampling
Coronal sections of the brain and transverse sections of the spi-nal cord were used. Although in some animals injections were placed in different areas, this generated no ambiguities since the projections could be followed all the way from the site of injections to the distal ic and below. All measurements were
performed at high power (10μm = 35 mm on screen = 35 000
μm; i.e., 3500×). In the initial work whole axonal segments were faithfully charted following irregularities of the axonal profile. The software used (Neurolucida and Neuroexplorer; MBF Biosciences, Williston VT) provided among other parameters, the diameter at the origin of the segment and its mean diame-ter. This type of measurement is extremely time consuming and it cannot be applied to transversally cut axons. Mean
diameter is also affected by swellings along the axons and by apparent thinning of the axon in the depth of the section, due to incomplete penetration of the reagent. Therefore axon seg-ments were measured at their extremity at the surface of the
section byfitting a circle of identical diameter to the profile. If
the measurement appeared unreliable because the sectioning went through a swelling or the axons appeared damaged by cutting, the nearest even, or intact part of the segment was measured.
Synaptic boutons were alsofitted by circles and were
classi-fied as terminal when clearly separated from the parent axons by a short side branch or passing, when consisting of swellings
along the axon (as inInnocenti and Caminiti 2017).
One of the goals of sampling was to avoid measuring the same axons twice. Different sampling strategies were per-formed on longitudinally and transversally cut axons. In the first case, when the density of labeled axons was high enough one or more samples were taken at different proximo-distal locations along the tract. When the density of axons was not
high enough axons were sampled at the same location in sub-sequent sections, assuming that the same axons would not tra-verse the same location in subsequent sections. In the case of
transversally cut axons a grid consisting of 100μm squares was
superposed on the region to be sampled and within the grid all axons were measured in randomly selected 2–4 squares.
To estimate axon diameters in the internal capsule
horizon-tal 50μm sections were cut in 1 hemisphere of the macaque
CCT 10. The sections were stained with the Gallyas method for
myelin (as inInnocenti et al. 2002) and 10, 500μm squares were
evenly spaced from posterior to anterior, in the posterior limb of the internal capsule. Within these squares axons were
mea-sured in 3 samples. Thefirst sample was in the center of the
500μm square, the second on the upper left corner of the same
square and the third at a location which contained the highest proportion of well-preserved axons.
Unless otherwise stated BDA measurements are not cor-rected for shrinkage.
Electron Microscopy
Two macaca fascicularis monkeys (EM1 and EM2; STable 1) were anaesthetized with Valium: 1 mg/kg followed by Ketamine
1.5 mL (5 mg/kg) + Domitor 0.3 mL (20–30 μg/kg). They were
intracardially perfused with 0.5 L of 0.9% NaCl in PBS 0.15 M (pH 7.4) with heparin followed by 2 L of 2% paraformaldehyde and 2.5% glutaraldehyde in 0.9% NaCl in 0.15 M PBS. The brains and
spinal cords were removed after 1 h of fixation in situ and
stored overnight in the samefixative. The hemispheres were
then separated and the relevant blocks of tissue vibratome
sec-tioned at 80μm. Tissue slices were stained with 1% osmium
tetroxide and 1.5% potassium ferrocyanide in 0.1 M cacodylate buffer, followed by osmium tetroxide alone in the same buffer. They were then further stained with uranyl acetate in water, dehydrated, and embedded in the Durcupan resin. Thin, 50 nm thick sections were cut with a diamond knife and mounted onto formvar coated slot grids and imaged at 1400× in a trans-mission electron microscope (Tecnai Spirit, FEI Company).
Sections were photographed at 1400× at the cervical and at the thoracic levels in the posterior quadrant of the lateral col-umn, at the location traversed by corticospinal axons in the
BDA material. Photographs were taken in 100μm square frames
spaced 100μm apart. Within these frames axons were
sub-sampled in 31μm squares. Only axons with well-preserved
myelin sheath were measured; their profiles being approxi-mated to circles, one measuring the inner (d) and the other the outer (D) diameter (SFig. 1). About 234 axons were measured at the cervical level and 240 at the thoracic level. Sampling and measuring was performed with Neurolucida (above).
Unless otherwise stated EM measurements are not corrected for shrinkage.
Diffusion MRI (dMRI)
One perfusion fixed healthy adult vervet monkey brain
(Chlorocebus sabeus) and one macaque (Macaca fascicularis) were
used for this study (STable 1). The first animal was obtained
from the Behavioral Science Foundation, St. Kitts and was socially housed in enriched environments. The experimental protocol was reviewed and approved by the Institutional Review Board of the Behavioral Science Foundation acting under the auspices of the Canadian Council on Animal Care. The second animal was from the Department of Physiology and Pharmacology of the University of Rome SAPIENZA.
Figure 1. Photomicrographs of injection sites overlaid on section outlines for 8 of the 11 monkeys used in this study. In each case animal code and location of injection are shown.
Acquisition
The monkey magnetic resonance images (MRI) were acquired with a 4.7 Tesla Agilent MRI scanner using quadrature RF vol-ume coil (Rapid) and maximum gradient strength of 600 mT/m.
The setup followed the preparation stages inDyrby et al. (2011)
where freefixative was washed out to increase T2-relaxation
using phosphate buffered saline (PBS). The brain was placed in a sealed plastic bag with minimal PBS surrounding the brain tissue. Before scanning, the brain was stabilized to room tem-perature, and placed in the middle of the volume coil using a
mechanically stable setup. While scanning, a conditionedflow
of air around thefixed brain ensured constant temperature. A
diffusion weighted imaging (DWI) pre-scan of at least 6 h ensured removal of any short-term mechanic instabilities (Dyrby et al. 2011). Single shell whole-brain DWI was acquired in 0.5 mm isotropic image resolution with a Pulse Gradient Spin Echo (PGSE) sequence and single line read-out. The acquisition for both ex vivo monkey brains included a single shell with 128 non-collinear directions obtained from the Camino diffusion
toolkit [http://cmic.cs.ucl.ac.uk/camino/]. Due to different duty
cycle limitations, the b-value used for the vervet was 7500 s/mm2
and for the macaque 6500 s/mm2(delta= 9.5 ms, DELTA = 16 ms,
TR= 6500 ms, TE = 35 ms, matrix = 128 × 256) using a gradient
strength of 300 mT/m and 280 mT/m. Whole-brain coverage was ensured acquiring 86 and 95 axial slices, and with 4 and 2 repeats for the Vervet and Macaque, respectively. Visual inspection of the ex vivo monkey DWI datasets revealed no need for further motion correction between the repeated measurements that were averaged offline to increase SNR. The raw ex vivo diffusion MRI dataset of the Vervet monkey brain can be downloaded from
http://dig.drcmr.dk. Tractography
Diffusion tensor imaging reconstruction was performed using
Dipy (www.dipy.org) (Garyfallidis et al. 2014) using a weighted
least-square method and corresponding fractional anisotropy
(FA) and colored FA maps. Then,fiber orientations distribution
function (fODF) reconstruction of maximal spherical harmonics
order 8 with constrained-spherical deconvolution (Tournier
et al. 2007;Descoteaux et al. 2009), streamline-based probabilis-tic tractography was launched with 10 seeds per voxel in a thresholded FA mask at 0.2, maximum angle of curvature of 20 degrees, fODF amplitude threshold of 0.1, and min/max
stream-line length criteria of 30/120 mm, as implemented in Girard
et al. (2014) and publicly available in Dipy (www.dipy.org) (Garyfallidis et al. 2014). We reconstructed tractograms for 4 dif-ferent step sizes 0.05, 0.1, 0.25, and 0.5 mm, respectively, to cover all possible ranges of optimal step size parameters. This is because highly curved fascicles and straight fascicles may need different optimal step sizes to recover them. These 4
trac-tograms were assembled (Takemura et al. 2016) to create
approximately 6 million streamlines (1.5 million streamlines per tractogram). Then, using an atlas (Paxinos et al. 2000) and
the MI-Brain visualization software (Rheault et al. 2016;www.
imeka.ca/mi-brain), ROIs were manually drawn in the internal capsule (IC), cerebral peduncle and the cortical sites and at cor-tical locations where BDA injections were placed (a2, a4 ante-rior, a4 posteante-rior, F7, PEa-AIP, and SMA) using both the
anatomical b= 0 image from the DWI acquisition and the
col-ored FA map. These manually drawn ROIs served as inclusion
selection regions to select each fiber bundle of interest. An
exclusion ROI was used in the opposite hemisphere to remove streamlines crossing the sagittal midline (SFig. 5).
Statistics
Differences in the diameter of axons were evaluated with anal-ysis of variance and t-test in Excel 2013. We used the t-test sta-tistics since it is reported to be robust even in the case of deviation from normal distributions, while the alternative (Wilcoxon–Mann–Whitney test) might return doubtful
differ-ences between means (www.thestatsgeek.comand references
therein).
Results
Histological Tract Tracing
Even a cursory observation shows clear differences in the
diameter of the axons of different origin (Fig.2). Below we
pro-vide a detailed, quantitative analysis of the projections issued from the different areas.
Projections from a4
Projections could be studied in 5 animals (CCT2,5,9,12 and M93-80). All animals had been injected in cytoarchitectonically defined a4; CCT2 and 5, dorsally, CCT9 and M93-80 more trally on precentral gyrus. CCT12 received 2 dorsal and 2 ven-tral injections. In only 2 animals (M93-80 and CCT12) the material allowed following axons from the injection site to the spinal cord. In the others the study had to stop at the cerebral peduncle, just above the pons here from referred to as the dis-tal internal capsule (disdis-tal ic).
Axons followed the expected course (Ralston and Ralston
1985;Lacroix et al. 2004). They were sparsely distributed in the internal capsule, crossed the pons in separate bundles which converged into the pyramids then crossed incompletely at the cervical levels with the bulk descending in the posterior
quad-rant of the contralateral lateral funiculus (Fig.3).
In all brains axons were sampled and measured in the ipsi-lateral, distal ic, just above the cerebral peduncle. In M93-80
(Figs3and5) axons were also sampled at the level of the pons,
of the pyramid and at the cervical contralateral lateral funicu-lus. In CCT12 they were sampled at distal ic, at the pyramid
and in the lateral funiculus (Fig.5).
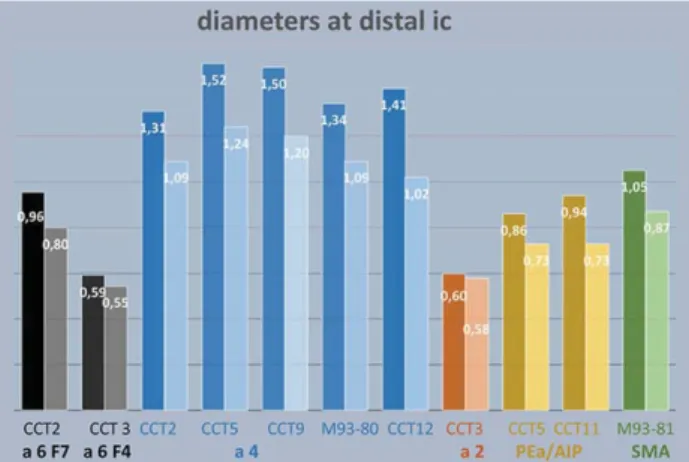
At distal ic axons diameters ranged between 1.52μm,
(median 1.24) in CCT5 and 1.31μm (median 1.09) in CCT2. The
Figure 2. Photomicrographs of axonal segments labeled from BDA injections in (A) premotor cortex area F7; (B) motor cortex a4; (C) somatosensory cortex a2; (D) parietal cortex PEa/AIP. Calibration bar is 200μm.
statistical analysis showed no significant differences between the animals with ANOVA although some emerged with paired
t-tests, albeit uncorrected for multiple comparisons (Fig. 4;
Table1). A tendency to thicker axons appeared when the
poste-rior subdivision of a4 (Rathelot and Strick 2009) was injected.
In the M93-80 the axons kept approximately the same
diam-eter from proximal to distal locations (Fig.5). Mean axon caliber
was 1.34μm (median 1.09) at the distal ic, 1.38 μm (median 1.16)
at the pons, 1.36μm (median 1.09) at the pyramid, and 1.27 μm
(median 1.09) at the cervical lateral funiculus (no differences in
Anova). In CCT12 (Fig. 5) there were highly significant (P <
0.00001; t-test 2 tailed) differences between distal ic (1.4μm;
median 1.02), and the cervical lateral funiculus (1.18μm;
median 1.09). In this animal the distribution of axon diameters
showed a decrease in the number of axons thicker than≥2 μm
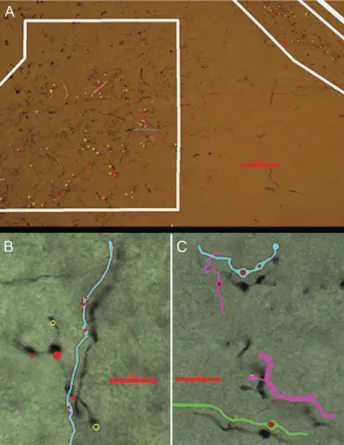
Figure 3. Profiles of axons diameters labeled by BDA injected in motor a4 in ani-mal M93-80 were measured (golden circles) on transverse section at levels (insets) of distal ic (A), pons (B), pyramid (C) and cervical spinal cord (D). In D axons were sampled in mediolateral rows, spaced 100μm apart. Calibration bars are 500μm in A and D, 1000 μm in B and C. Red segments in A and yellow squares in B and C define the regions sampled.
Figure 5. Constancy of axon diameters of BDA labeled axons from a4, parietal PEa/AIP and SMA, at different rostro-caudal levels. For full statistics see STable 2. The values (inμm) at each level are in the colored boxes.
Figure 4. Mean (dark columns) and median (light colums) axon diameter of all projections at the level of distal ic. Notice that axons from CCT2 a6/F7 might be partially contaminated by axons from a4.
Table 1 Diameter of axons from motor cortex a4
CCT2 CCT5 CCT9 M93-80 CCT12 Mean 1.31 1.52 1.49 1.34 1.41 Standard Error 0.06 0.07 0.10 0.04 0.05 Median 1.09 1.24 1.20 1.09 1.02 Mode 0.87 1.02 0.70 0.80 0.58 Standard Deviation 0.72 0.86 1.03 0.77 1.01 Sample Variance 0.51 0.73 1.07 0.59 1.03 Kurtosis 2.23 3.20 2.35 2.53 3.64 Skewness 1.39 1.69 1.53 1.61 1.76 Range 3.78 4.43 4.70 4.07 6.25 Minimum 0.29 0.51 0.40 0.44 0.36 Maximum 4.07 4.94 5.10 4.51 6.61 Sum 216.34 244.16 168.70 613.96 506.12 Count 165 161 113 457 359
http://doc.rero.ch
from 34.7% (at distal ic) to 19% (cervical). The most probable explanation is that between ic and the cervical cord a fraction of large axons stopped or gave raise to thinner collaterals. To test where this may have occurred 489 axons were measured at
the pyramidal decussation. The average thickness was 1.18μm
(median 0.94), similar to what found at the cervical level but significantly different from those at distal ic.
It appears that although CCT12 and M93-80 had similar axon diameters at the distal ic, CCT12 had significantly (P < 0.02; t-test 2 tailed) thinner axons than M93-80 at the cervical level. The cause for these differences is unexplained.
In CCT2 thinner axons were previously (Innocenti et al.
2013) measured at their entrance in the internal capsule at the
level of n caudatus (mean 0.74μm median 0.60), probably
because they comprised, among others, thinner axons directed
to the thalamus (mean 0.6μm median 0.5).
Projections from Parietal Cortex
Projections could be studied in 2 animals CCT5, injected in PEa and in CCT11 whose injection extended from PEa to AIP,
defined according toPaxinos et al. (2000). In CCT11 axons could
be followed all the way to the cervical spinal cord, in CCT5 the material stopped at the distal ic.
The spinal projection from parietal cortex was recently
described mainly by functional criteria (Rathelot et al. 2017).
Wefind that the course of the projection resembles that from
a4 with the difference that axons seem to be confined to the lateral part of the pyramid (SFig. 3). The axons are fewer than in the projection from a4. They also decrease from proximal to distal, suggesting that many of them stop rostral to the pyramid. Indeed heavy terminations were seen in the pons; they were in several small clusters distributed in pontine nuclei adjacent to the bundles of the corticospinal axons (SFig. 2).
Both in CCT5 and 11 axons were sampled and measured at
the level of distal ic (Fig.4). In CCT11 they were also sampled
and measured at the levels of pons, pyramid, and cervical cord
(Fig.5).
At distal ic comparable axon diameters were found in CCT5
(mean 0.86μm, median 0.73) and in CCT11 (mean 0.94 μm,
median 0.73). In CCT11 axon size remained unchanged from proximal to distal (Anova): at pons (mean 0.86, median 0.73), pyramid (mean 0.92, median 0.73), and at the cervical level
(mean 0.86, median 0.8) (Fig.5; STable 2).
Projections from Other Areas
Projections from SMA were studied in M93-81. Average axon
diameter was 1.05μm at ic (median 0.87) and remained
unchanged at the cervical level (mean 1.02μm, median 0.87;
Figs4and5, STable 2).
Projections from premotor cortex a6 could be studied in CCT2, injected in F7 and CCT3, injected in F4 and those from
area 2 in CCT3 (Fig.4). In all these animals the material allowed
projections to be followed only as far as distal ic. Axons from
area 2 were on average 0.56μm (median 0.58). Axons from
dor-sal premotor cortex, F7 were 0.96μm (median 0.80). Those from
ventral premotor cortex, F4 were 0.59μm on average (median
0.55). Notice that axons labeled from F7 may have been con-taminated by axons from a4 which was also injected in that animal since the 2 sets of projections partially intermingle.
Overall, the differences in axon diameters at the level of
dis-tal ic are striking (Fig.4). The thickest axons clearly originate in
a4, followed by parietal areas, premotor cortex and area 2.
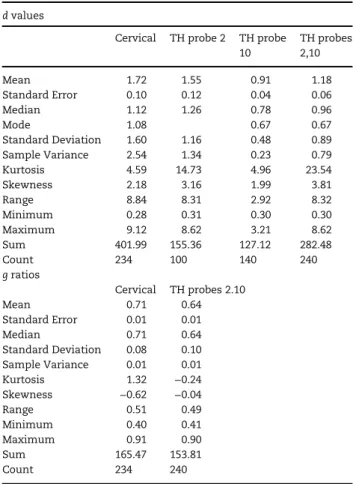
Electron Microscopy
The internal diameter (d) of axons measured in the posterior quadrant of the lateral column at the cervical level were
1.72μm on average (median 1.12; Table 2). These values are
close to the range measured in BDAfilled axons originating in
a4 (above). Thinner axons were measured at the thoracic level
(mean= 1.18 μm; 0.96 median) and the differences are highly
significant at t-test for unequal variances. This is surprising since we expected thicker diameters at more distal cord seg-ments, to compensate for the longer conduction distances.
Thisfinding needs confirmation since tissue preservation was
better at the cervical than at the thoracic level. g ratios were also different at the cervical (0.71, mean and median) than at the thoracic level (0.64, mean and median), which might be due to the somewhat looser myelin sheath in the latter.
Synaptic Boutons
To determine if the size of synaptic boutons relates to axon diameter in corticospinal projections, as this is true for the
cal-losal projections between a4 of the 2 hemispheres (Innocenti
and Caminiti 2017) the size of synaptic boutons established at the cervical level was compared for projections originating in a4 and in SMA. Boutons were classified as terminal when clearly separated from the parent axons by a short side branch
or passing, when consisting of swellings along the axon (Fig.6;
Table3).
The projection from a4 in M93-80 terminated in 2 separate
clusters (SFig. 3), a lateral and slightly oval one 700× 850 μm in
diameter and a medial elongated one 400× 90 μm in Rexed’s
Table 2 Diameters in posterolateral quadrant of lateral column (em) d values
Cervical TH probe 2 TH probe 10 TH probes 2,10 Mean 1.72 1.55 0.91 1.18 Standard Error 0.10 0.12 0.04 0.06 Median 1.12 1.26 0.78 0.96 Mode 1.08 0.67 0.67 Standard Deviation 1.60 1.16 0.48 0.89 Sample Variance 2.54 1.34 0.23 0.79 Kurtosis 4.59 14.73 4.96 23.54 Skewness 2.18 3.16 1.99 3.81 Range 8.84 8.31 2.92 8.32 Minimum 0.28 0.31 0.30 0.30 Maximum 9.12 8.62 3.21 8.62 Sum 401.99 155.36 127.12 282.48 Count 234 100 140 240 g ratios Cervical TH probes 2.10 Mean 0.71 0.64 Standard Error 0.01 0.01 Median 0.71 0.64 Standard Deviation 0.08 0.10 Sample Variance 0.01 0.01 Kurtosis 1.32 −0.24 Skewness −0.62 −0.04 Range 0.51 0.49 Minimum 0.40 0.41 Maximum 0.91 0.90 Sum 165.47 153.81 Count 234 240
http://doc.rero.ch
laminae VI–VIII and IX. A total 236 boutons were measured, of which 103 terminal boutons and 133 passing boutons.
The projection from SMA was sparser than that from a4 and
terminated in an oval territory 1100× 650 μm across in Rexed’s
laminae VII and IX, slightly more ventral, than the projection from a4 (SFig. 3). A total 286 boutons were measured, of which 106 terminal and 180 passing.
A4 which sends thicker axons than SMA to the cord (see
above) also had larger boutons (mean 1.07μm, median 1.02)
than SMA (mean 0.88μm, median 0.87). This difference is
sig-nificant at <0.00001 for all boutons together, as well as sepa-rately for passing and terminal boutons, while the difference between passing and terminal boutons for each projection is
not (SFig. 4 and Table3).
Computed Conduction Velocities
To compute conduction velocities the diameter of axons was increased by 30%, to compensate for the previously estimated (Innocenti et al. 2013) average histological shrinkage of our BDA material. It is not certain that this correction is necessary. The
issue was already raised byHursch (1939). He reported
histolog-ical processing shrinkage of 23.6% in peripheral nerve axonal bundles but only 10% was attributed to axons. We are not aware of comparable work in CNS axons. Therefore it is possi-ble that our correction artefactually increases the conduction velocity of CDP axons affecting the comparison between the anatomical and physiological assessment of conduction veloc-ity (Discussion). The BDA method visualizes the inner diameter of axons (d). The outer diameter D was considered by taking
into account the average g ratio (g= d/D). Therefore velocity
was calculated as V= (5.5/g) * d, with g = 0.7 as inTettoni et al.
(1996).
Conduction velocities computed from axon diameters at dis-tal ic showed the differences between axons of different origin
which could be predicted from their diameters (Fig.7). Average
Figure 6. Boutons sampled in Rexed lamina VII (golden circles superposed on axonal segments, within white polygons) in (A). Calibration bar 100μm. High power views of passing (red dots) and terminal (golden circles) boutons super-posed on axonal segments (drawn by NL and shifted from the photomicro-graphs). About 10μm in (B) and (C).
Table 3 Boutons analysis area 4 all SMA all a4 term SMA term a4 passing SMA passing Mean 1.07 0.88 1.13 0.94 1.03 0.85 Standard Error 0.02 0.02 0.03 0.02 0.03 0.02 Median 1.02 0.87 1.09 0.87 0.94 0.80 Mode 0.94 0.73 1.16 0.73 0.94 0.65 Standard Dev 0.32 0.26 0.29 0.22 0.34 0.28 Sample Variance 0.10 0.07 0.08 0.05 0.12 0.08 Kurtosis 0.81 0.12 0.62 −0.53 1.00 0.39 Skewness 0.74 0.54 0.90 0.38 0.81 0.74 Range 1.89 1.46 1.31 1.01 1.89 1.46 Minimum 0.51 0.36 0.65 0.44 0.51 0.36 Maximum 2.40 1.82 1.96 1.45 2.40 1.82 Sum 253.15 253.64 116.07 99.41 137.08 153.21 Count 236 286 103 106 133 180
Figure 7. Upper panel: mean (dark columns) and median (light colums) conduc-tion velocities for axons of different origin (color coded as in Fig.4). Lower panel: frequency of conduction velocities in axons from motor a4, SMA and pre-motor area F4. Notice that conduction velocities are increased by the addition of a fraction of faster conducting axons while the mode of the distribution remains similar. Axon diameters were increased assuming a 30% histological shrinkage (discussed in Results).
velocities from a4 ranged between 15.5 m/s (median 12.7) in CCT5 to 13.3 m/s (median 11.1) for CCT2. The second fastest axons originated from SMA (10.8 m/s; median 8.9). The slowest axons were from a6/F4 (6 m/s; median 5.9) and from area 2 (6.1 m/s; median 5.9). Anova showed significant differences across animals and indeed we found significant differences between a4 axons in each animal and all the other origins. Velocities of SMA axons were significantly different from those of all other animals/origins, to the exception of axons of parie-tal origin in CCT11 and of area 6/F7 origin. The velocity of axons from a6/F4 was significantly different from those of all other
animals/origins, except those from a2 (Table4).
To estimate the delays generated in the projections by the different conduction velocities we assumed that the conduc-tion velocities remained constant, as axon diameters predicts, over long distances. Therefore we computed the delays over the length of the tracts, estimated by tractography (below), as well as over a standard distance of 10 cm, approximately corre-sponding to the trajectory from cortex to the spinal cord
(Fig.8). This calculation returned delays of about 6 ms for area
4 axons and of 16–18 ms for axons from F4 and area 2.
Diffusion Tractography
The goal of this study was to validate the accuracy of results obtained from tractography against the histological ones as well as to use tractography to harvest data which could not easily be obtained from tracer experiments. This approach gen-erated streamlines originating in area F7, SMA, a4 (which was subdivided in an anterior and posterior portion according to
Rathelot and Strick 2009), a2 and PEa-AIP. The projections repli-cated the histological data but were not devoid of expected artefacts. First, false positives were generated, that is, lines which took aberrant trajectories. Some of these
stream-lines were eliminated, but a few were left in Figure9, in the
projections from a4 and F7. Second, false negatives were gener-ated by the tendency of streamlines to aim preferentially to the crown of gyri, disregarding projections originating from the
bank of sulci. This is known as the gyral bias (Jbabdi and
Johansen-Berg 2011;Thomas et al. 2014). These are visible in
Figure9in the projections from a4 caudal and PEa-AIP. These
artefacts prevent relating the number of streamlines to the number of axonal projections. Modifications of the MI-Brain software aimed at eliminating the above mentioned artifacts are underway.
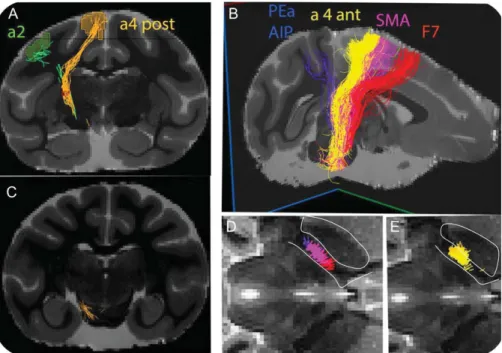
We were interested in the topographical relations of the pro-jections from different areas all along their course, in particular in the internal capsule, which could not be obtained from tracer injections in different animals. This corticotopy is somewhat
neglected in the classical literature (but seeArcher et al. 2017
for results in humans and the very recent work of Morecraft et al. 2013 in the macaque) although the somatotopy of the pro-jections is textbook knowledge. Axons from lateral representa-tions in a4 (head or thumb) course anteriorly, near the genu of ic, while more medial locations (the foot) course caudally in the
posterior limb of ic (Dawnay and Glees 1986). Tractography
(Fig. 9D,E) restituted the corticotopy, that is, projections from
more anterior areas (F7) were represented rostrally in the poste-rior limb of ic and projections from more caudal areas (PEa-AIP)
Figure 8. Upper panel. Thickness of arrows is proportional to median axon thickness, length of arrows correspond to that of streamlines from cortical ROIs to distal ic; numbers are the conduction delays in ms over the same distance. The scale bar relates to length of the arrows, thickness of the axons and con-duction velocity for a segment of the corresponding length and thickness; Lower panel delays over 10 cm.
Table 4 Velocities AT distal IC
MOTOR area 4 PARIETAL PREM F7 PREM F4 SMA area 2
CCT2 CCT5 CCT9 CCT12 M93-80 CCT5 CCT11 CCT2 CCT3 M93-81 CCT3 Mean (m/s) 13.39 15.49 15.25 14.40 13.72 8.79 9.58 9.80 6.01 10.75 6.12 Standard Error 0.57 0.69 0.99 0.55 0.37 0.38 0.43 0.42 0.12 0.38 0.29 Median 11.13 12.67 12.26 10.42 11.13 7.46 7.46 8.17 5.92 8.89 5.92 Mode 8.89 10.42 7.15 5.92 8.17 5.21 5.21 5.92 5.21 7.46 5.92 Standard Deviation 7.32 8.75 10.55 10.35 7.87 3.66 6.45 5.14 2.24 6.62 2.63 Sample Variance 53.61 76.60 111.35 107.20 61.87 13.42 41.65 26.40 5.04 43.88 6.92 Kurtosis 2.23 3.20 2.35 3.64 2.53 1.51 2.86 3.90 1.30 31.20 5.86 Skewness 1.39 1.69 1.53 1.76 1.61 1.31 1.68 1.63 1.01 4.31 1.84 Range 38.61 45.25 48.01 63.84 41.57 17.06 31.97 32.69 11.85 69.76 14.81 Minimum 2.96 5.21 4.09 3.68 4.49 4.49 2.96 2.25 2.25 2.96 2.25 Maximum 41.57 50.46 52.09 67.52 46.07 21.55 34.93 34.93 14.10 72.73 17.06 Count 165 161 113 359 457 91 226 147 326 301 83
http://doc.rero.ch
were represented caudally. There was a high degree of overlap between the various projections. In particular, between a2 and PEa-AIP as well as between SMA and a4. Anterior and posterior a4 projections were also overlapping albeit with a tendency for a more caudal location of the latter.
The tractography described above was performed in a vervet monkey which had been scanned ex vivo and used in previous
work (Innocenti et al. 2016). The histological material where
axon diameters could be measured, was obtained in macaque monkeys. Therefore, to avoid possible species differences, trac-tography was repeated in 1 macaque, seeding the same loca-tions as in the vervet. The results are comparable (SFig. 6); in particular, similar corticotopy was observed in the ic.
Axon Diameters Distribution in ic
All samples of myelinated axons in the posterior limb of ic showed a trend in axon diameter distribution with thicker
axons posteriorly and thinner ones anteriorly (Fig.10).
By superposing the axonal samples to the distribution of
streamlines from tractography (Fig. 10) it appeared that the
thickest axons corresponded to streamlines from a4, with the thickest axons corresponding to posterior a4, while thinner axons were found anteriorly, in sectors traversed by stream-lines from SMA and F7. Thinner axons were also found in the most posterior sector, traversed by streamlines from PEa and
AIP (compare Figs9and10).
Discussion
This study is part of a broader project in which, using the mon-key as a model, we aim to generate a dynamic picture of the “connectome” of the brain. This we do by considering the diam-eter and length of axons which ddiam-etermine their conduction velocity and connectional delays as well as synaptic size which
impacts connectional strength (Caminiti et al. 2009; Tomasi
et al. 2012;Innocenti et al. 2014,2016;Innocenti and Caminiti
2017). It should be stressed that these features may not be
invariable in the adult brain since examples exist of adult plas-ticity of myelin sheaths and axon diameters (reviewed in
Innocenti et al. 2016). Furthermore, the remaining corticospinal connections might react to the lesion of one or more of them, a
Figure 9. Streamlines in the vervet monkey from: a4 posterior and a2 (A and C; ROIs for both bundles are shown) PEa and AIP, a4 anterior, SMA and dorsal premotor F7 on parasagittal 3D views (B). The topographical relations of the bundles is shown in horizontal sections of internal capsule in (D) and (E); n caudatus and ic are outlined.
Figure 10. Upper panel. Outlines of transverse view of the internal capsule showing samples of myelinated axons in 10, antero-posterior 500μm squares, one of which (with mean diameter 1.0μm) enlarged in the inset (see text for sampling strategy). In the inset, mean diameters are shown separately as well as together in the 3 samples; yellow-orange box corresponds to the location of dMRI bundles from a4 (Fig.8). Bottom panel. Superposition of the histological samples and of the topography of dMRI bundles originating in posterior and anterior a4. Calibration bars are 1 mm.
matter of great clinical interest (Borra et al. 2010). Changes seem to include the increase of caliber of spared a4 axons after
hemisection of the spinal cord in the monkey (Rosenzweig
et al. 2010).
Two complementary sets of data were used, namely histo-logical data obtained mainly by tract tracing with axonally transported BDA and tractography with dMRI. The goal was to compare the 2 sets of data including the advantages and disad-vantages of each approach.
Comparisons with Previous Work
Thefiber composition of the CST, in particular the projections
originating in the motor cortex, is a classical neuroanatomical
issue. Häggqvist (1937; quotation of older literature therein)
reported the composition of myelinatedfibers in the pyramidal
tract in 1 normal human subject and in 4 normal rhesus
mon-keys. The frequency of axon diameters peaked around 1μm
and progressively fell to 19–21 μm in the human case, and to
13μm in the monkey. The distribution of axon diameters
pro-vided by Häggqvist was confirmed by more recent work (Murray and Coulter 1981;Firmin et al. 2014; this paper) and it stresses the point that the pyramidal tract contains numerous thin axons, some of which, we show, of origins other than the motor cortex, a4. The existence of a descending projection from
a6/F7 confirms previous findings byGlickstein et al. (1985)who
retrogradely traced a very broad distribution of projections to the pons including the whole of premotor cortex. The injection
site in CCT2 was almost certainly in F7, according toPaxinos
et al. (2000)atlas and to the cytoarchitectonic criteria ofMatelli et al. (1991). In addition we detected an increase in myelin den-sity from F7 to F2. Unfortunately, our material allowed to follow the projection only as far as the distal ic.
This paper seems to be thefirst to examine systematically
the axonal composition of the projections from different corti-cal areas although corticospinal axons of different diameter and areas of origin where reported in the cat with degeneration
methods (Van Crevel and Verhaart 1963).Jones and Wise (1977)
reported, in the monkey, different soma size of corticospinal, corticopontine and corticobulbar projecting neurons in a4, 3a, 3b, and 1–2. Assuming the existence of a linear relation between axon diameter and soma size as found for the callosal
projections (Tomasi et al. et al. 2012), Jones and Wise’s work
also predicts differences in axon diameters with thicker axons originating from a4 and thinner ones from the other areas. Electrophysiological evidence also indicates faster projections
from a4 than from SMA or ventral premotor area F5 (Maier
et al. 2002,2013;Firmin et al. 2014) albeit with the limitations discussed below.
We gathered direct information on the axon diameter com-position of the different CDPs. In some cases the projections could be followed to the spinal cord although in others the analysis stopped at the distal ic and therefore includes axons presumably terminating in the pons or at the medullar level. Unexpectedly, no significant changes could be detected in the
composition of axon diameters at different levels (Fig.5). These
results imply that proximally ending axons are not thinner than the more distally ending ones, suggesting that informa-tion from cortex reaches more proximal targets (including motor neurons) ahead of the more distal ones in agreement with the estimates of corticospinal conduction in humans (Imajo et al. 2017). In that study the normative values for cen-tral conduction to the adductor digiti minimi motor neurons were
5.2± 08 ms and 11.8 ± 1.3 ms to abductor allucis. These values
are shorter than what could be predicted from our monkey data where we calculated about 6 ms for conduction over a 10 cm distance. This suggests that humans have faster corti-cospinal axons than monkeys as it is also the case for callosal
connections (Caminiti et al. 2009) and as suggested by
Häggqvist’s (1937) data mentioned above. In addition, the electrophysiological measurements might have emphasized fast-conducting axons as further discussed below.
Our EM diameter estimates are slightly higher than those of
Firmin et al. (2014) at the lateral funiculus of the spinal cord
(mean 0.91μm, median 0.68 μm). We obtained 1.72 (mean; 1.12
median) at the cervical, level, close to our LM estimates. The
differences withFirmin et al. (2014)might be due to different
shrinkage or because their sample included thinner axons from other areas, in particular premotor, SMA, area 2 and parietal cortex.
The Anatomical/Electrophysiological Discrepancy
It should be stressed that both in this study and inFirmin et al.
(2014)the shrinkage of the histological material might be con-sidered, which we have previously estimated to be in the order
of 30% (Innocenti et al. 2014), similar to what was reported in a
comparison of freeze versus aldehydefixation (Korogod et al.
2015). Therefore we corrected for shrinkage when computing
conduction velocities although this might not be necessary as mentioned in results. Nevertheless even accounting for 30% shrinkage we derived conduction velocities definitely lower
than those estimated electrophysiologically.Firmin et al. (2014)
calculated conduction velocities from delays of antidromically activated CST neurons and reported velocities above 5 m/s, with a strong bias towards fast-conducting axons between 10 and 100 m/s peaking at around 50 m/s. Instead for a4 we calcu-lated velocities between 3 and 67.6 m/s peaking between 6 and 10 m/s, in different animals therefore biased towards slowly conducting axons.
The surprising lack of slowly conducting axons in the electrophysiological estimates is well-known and is usually
ascribed (Murray and Coulter 1981;Firmin et al. 2014) to
micro-electrode bias towards large cell bodies, which also give rise to thicker axons. This bias might indeed exist and it is likely to apply even more seriously to the estimates obtained from
axo-nal (rather than somatic) recording (Maier et al. 2012, 2013).
Unfortunately this explanation could imply, by extrapolation,
that the wholefield of electrophysiological recordings is biased
towards large cell bodies. In other words more than half a cen-tury of electrophysiological recordings might have told us only a small fraction of what the brain does.
However, a different explanation seems possible. The lack of response from smaller neurons with thinner and more slowly conducting axons could be due to the activation of recurrent inhibitory circuits engaged by the faster conducting axon, which would effectively prevent the antidromic activa-tion of smaller neurons. The recurrent activaactiva-tion of inhibitory interneurons by layer 5 pyramidal cells was observed in the
somatosensory cortex of the rat (Silberberg and Markram 2007)
and is mediated by Martinotti cells with GABA as neurotrans-mitter. The recurrent inhibition started by a few layer 5 cells can powerfully inhibit all neighboring cells within a territory at
least as large as a cortical column (Silberberg and Markram
2007; Berger et al. 2010). This hypothesis could perhaps be tested by repeating the antidromic invasion experiment in the presence of GABA antagonists near the cortical recording.
Another discrepancy between electrophysiological and anatomical data is that we could never calculate conduction
velocities as high as 95 m/s (Firmin et al. 2014) presumably
corresponding to axon diameters between 16 and 17μm. Our
thickest axons were below 10μm even after correcting for a
30% shrinkage, in a total of 1258 axons measured in 5 animals. We might have missed the apparently extremely rare very thick axons. Alternatively factors other than diameter might affect conduction velocity leading to super-fast axons. One factor could be the thickness of the myelin sheath because the g ratio (d/D), enters in the usually accepted equation of
con-duction velocity V= (5.5/g) * d. Another factor could be the
dis-tance between Ranvier nodes, which is classically believed to scale linearly with axon diameter and g ratio but with
varia-tions across axons (Ibrahim et al. 1995).
In examining diameters and conduction velocities of CDP axons across cortical areas we observed that axon diameters are increased only in certain CNS tracts. As previously noticed
(reviewed in Innocenti et al. 2016) this is done by adding a
fraction of large axons while leaving the modal distribution of axon diameters practically the same. This appears to be a strategy where development and evolution concur to produce diversity at the cellular neuronal level although the ultimate consequences of such a strategy remain unclear (discussed in
Innocenti et al. 2016).
Histology versus dMRI
Anatomical tract-tracing techniques have a long history going back to the anterograde tracing with radioactive aminoacids and to the introduction of Horse Radish Peroxidase (HRP) for
retrograde tracing (reviewed inZaborszky et al. 2006). These
techniques are usually assumed to provide the“ground truth”
for the dMRI tractography. Nevertheless these techniques suf-fer of intrinsic limitations as well. An important limitation is, of course, invasivity which, for ethical and other reasons limits the applications to certain animal species and obviously to humans. The other is the potential selectivity of the method whereby some projections may not be visible. In high resolu-tion anterograde tracing with BDA and optical microscopy, small axons notably the unmyelinated ones, fall below the
threshold for optical resolution, around 0.2μm, under optimal
conditions. While this limitation can, in principle, be circum-vented with EM or scanning EM such an approach is very labo-rious and of limited applicability. Some well-known drawbacks of dMRI tractography as a way to estimate connections in the
CNS (Jones 2010; Jones et al. 2013; Maier-Hein et al. 2017;
Daducci et al. 2016) were confirmed in the current study of cortico-descending projections. Essentially dMRI tractography generates both false positive and false negative results. Some of these drawbacks might be corrected by considering possibly useful similarities in the assemblage of connections with trac-tography and in development.
The easiest false positives to identify are the bizarre trajecto-ries of streamlines which form loops or grossly deviate from the bulk of the streamlines. This violates the tendency of developing axons to bundle together or with other axons. Connections between brain sites which are known not to be connected can also be identified and eliminated. Nevertheless some of the unexpected connections might actually be true. This is particu-larly tantalizing when tractographing the human brain, beyond the reassuring boundaries of the histological ground-truth
pro-vided by the well documented monkey neuroanatomy (Markov
et al. 2014). How can unexpected connections be validated?
In the developing brain“exuberant” axonal projections are
initially generated and later eliminated (Innocenti et al. 1977;
Galea and Darian Smith 1995; reviewed inInnocenti and Price 2005;Luo and O’Leary 2005;Innocenti 2017). The elimination of the exuberant projections is under the control of functional cri-teria as proven by experimental manipulations which alter the normal selection process by altering brain function (reviewed inInnocenti and Price 2005; see alsoMartin 2004). We suggest that functional criteria could be used to accept or reject unex-pected connections revealed by tractography. Some of us have used these criteria to accept the existence of an interhemi-spheric parieto-striatal connections in humans which is less evident or absent in the monkey but which might be involved
with language (Innocenti et al. 2016). Indeed connections
deal-ing with language are easier to accept in humans although
they might be missing in primates (Rilling et al. 2008).
False negative connections with tractography, such as the underrepresentation of streamlines connecting the banks or fundi of gyri, rather than their crowns might also be improved by using information on axonal guidance in development. The
recently proposed surfaceflow algorithm (St-Onge et al. 2015)
seems to go in that direction since it guides the growth of streamlines along an anisotropic substrate consisting of radial trajectories reminiscent of radial glia or corticofugal axons whose role in guiding developing axons has been documented (Norris and Kalil 1991;Molnar et al. 1998).
Notwithstanding the above mentioned difficulties, the advantage of dMRI tractography versus histology is clearly the
ease by which multiplefiber tracts can be revealed in 1 brain
and their topographical relations be studied. Each of these tracts would be extremely time consuming to visualize by his-tological techniques. Moreover the reconstructions would be sketchy and not error-free. And it would be difficult or impossi-ble to visualize more than 1 or 2 tracts in one animal.
The topography of projections in the internal capsule obtained by combining dMRI and histology is interesting. The internal capsule, as the corpus callosum, is essentially a slit through which axons originating over the whole hemisphere are coursing. The topography is similar in the 2 tracts. Axons originating in anterior (i.e., premotor) cortex course anteriorly in the posterior limb of ic, while axons of caudal (i.e., parietal) origin course posteriorly albeit with significant overlaps. As in the corpus callosum, the thickest axons, originating in a4, are
roughly in the middle (see alsoArcher et al. 2017). While this
antero-posterior corticotopy in both tracts is intuitively mean-ingful the mediolateral corticotopy is not and would require further studies. While this work was being refereed an excel-lent paper was published (Morecraft et al. 2013) detailing, with anterograde transport methods, the topography of orofacial and hand/arm pathways in M mulatta. The study traced the rel-ative position of axons originating in ventral premotor, cingu-late, SMA, and M1 in the internal capsule. The topography found resembles ours in showing projections from the premo-tor cortex anteriorly and those from M1 more posteriorly in the posterior limb of the internal capsule; further they also found anterior cingulate projections in the rostralmost position, near the genu of anterior capsule.
Functional Considerations
From the anatomical point of view it seem clear that the corti-cospinal projection, although it originates from at least 7 areas: dorsal and ventral premotor, area 4, SMA, area 2, parietal and cingulate areas is heavily dominated by area 4. This area sends
the highest density of corticospinal axons (Maier et al. 2002). Area 4 axons are also the thickest and therefore the fastest; they probably establish the largest and presumably most
pow-erful (Innocenti and Caminiti 2017) synaptic boutons in the
spi-nal cord. Electrophysiological investigations comparing the projections to spinal cord from premotor, versus a4 similarly
stress the predominance of the latter (Zinger et al. 2013).
Disregarding the fact that the different components of CST
are involved in different functions (Lemon and Griffith 2005)
and activate different sets of spinal interneurons (Ralston and
Ralston 1985;Moreno-López et al. 2016), considerations on the timing of corticospinal activation suggests 2 scenarios in motor control.
If the different cortical areas were tofire simultaneously,
co-activating the corticospinal projections in synchrony a signal
from a4 should be the first to reach the spinal cord where it
would powerfully activate motor neurons and interneurons. The motor command might later be checked by inputs from the other corticospinal projections as well as by slower axons from a4. Thus the earlier command from a4 might be corrected at the spinal level by further corticospinal information.
However, the following scenario seems more plausible. The motor command originating from the parietal and premotor areas is conveyed to the spinal cord by slow axons conducting at 7.5–9.7 m/s and simultaneously to a4 by cortico-cortical and/ or cortico-thalamo-cortical projections. The delays generated by these connections are unknown although we estimated the delay between parietal area PEc to premotor F2 to be in the
order of 3.4 ms (Innocenti et al. 2013). The delays generated in
the projections from parietal and premotor cortex to a4 might be compensated by the fastest a4 projection to the spinal cord. Indeed we calculated that over a 10 cm distance projections from a4 would gain 3–10 ms over those from parietal and pre-motor cortex. Therefore, the input from the different cortical areas might arrive synchronously at the spinal cord and be most effective when the message carried by the axons of dif-ferent cortical origin is coherent in terms of the movement parameters (speed, direction, muscular composition, etc.) it encodes.
The 2 scenarios may not be mutually exclusive, but a combi-nation of both might be implemented during the execution of different motor tasks. Indeed, while this paper was being
pro-cessed a study byMiri et al. (2017)in mice stressed theflexible
engagement of fast-conducting pathways from motor cortex depending on the task. Notwithstanding the differences in the organization of motor pathways in mice and monkey those findings suggest a flexible interplay of the fast and slow cortical descending projections we have described in the generation of movement.
Conclusions
Contemporary neurosciences are focusing on the relevance of white connections in the computational operations performed by the brain. We provide new interpretations for i) the well-known different anatomical and electrophysiological estimates of conduction velocity; ii) why conduction delays are probably an essential component of the cortical motor command and iii) how histological and dMRI tractography can be integrated.
Supplementary Material
Supplementary material is available at Cerebral Cortex online.
Funding
Supported by: (RC) PRIN 2015 (protocol # 2015AWSW2Y_002) MIUR Italy. (MD) Institutional Chair in NeuroInformatics and NSERC Discovery Grant. (ER) Swiss National Science Foundation grants, 110005, 132465, 144990, 149643, grant Sinergia SNF CRSII3_160696; and Swiss Primate Competence Centre for
Research (SPCCR:www.unifr.ch/spccr). (J-PT) Center for Biomedical
Imaging (CIBM) of the Geneva-Lausanne Universities and EPFL, the Leenaards and Louis-Jeantet Foundations, the Swiss National Science Foundation grant 31003 A_157063.
Notes
Conflict of Interest: None declared.
References
Archer DB, Vaillancourt DE, Coombes SA. 2017. A template and probabilistic atlas of the human sensorimotor tracts using diffusion MRI. Cereb Cortex. doi:10.1002/hbm.23681Published ahead of print.
Barazany D, Basser PJ, Assaf Y. 2009. In vivo measurements of axon diameters in the corpus callosum of rat brain. Brain. 132:1210–1220.
Berger TK, Silberberg G, Perin R, Markram H. 2010. Brief bursts self-inhibit and correlate the pyramidal network. PLoS Biol. 8:1–13.
Borra E, Belmalih A, Gerbella M, Rozzi S, Luppino G. 2010.
Projections of the handfield of the macaque ventral
premo-tor area F5 to the brainstem and spinal cord. J Comp Neurol. 518:2570–2591.
Caminiti R, Carducci F, Piervincenzi C, Battaglia-Mayer A, Confalone G, Visco-Comandini F, Pantano P, Innocenti GM. 2013. Diameter, length, speed, and conduction delay of cal-losal axons in macaque monkeys and humans: comparing data from histology and magnetic resonance imaging diffu-sion tractography. J Neurosci. 33:14501–14511.
Caminiti R, Ghaziri H, Galuske R, Hof PR, Innocenti GM. 2009. Evolution amplified processing with temporally dispersed slow neuronal connectivity in primates. Proc Natl Acad Sci USA. 106:19551–19556.
Coulter JD, Jones EG. 1977. Differential distribution of
corticosp-inal projections from individual cytoarchitectonicfields in
the monkey. Brain Res. 129:335–340.
Daducci A, Palú AD, Descoteaux M, Thiran JP. 2016.
Microstructure informed tractography: pitfalls and open challenges. Front Neurosci. 10:1–13.
Dawnay NAH, Glees P. 1986. Somatotopic analysis offibre and
terminal distribution in the primate corticospinal pathway. Dev Brain Res. 26:115–123.
Descoteaux M, Deriche R, Knösche TR, Anwander A. 2009. Deterministic and probabilistic tractography based on
com-plexfibre orientation distributions. IEEE Trans Med Imaging.
28:269–286.
Dum RP, Strick PL. 1991. The origin of corticospinal projections from the premotor areas in the frontal lobe. J Neurosci. 11: 667–689.
Dum RP, Strick PL. 2002. Motor areas in the frontal lobe of the primate. Physiol Behav. 77:677–682.
Dyrby TB, Baaré WFC, Alexander DC, Jelsing J, Garde E, Søgaard LV. 2011. An ex vivo imaging pipeline for producing high-quality and high-resolution diffusion-weighted imaging datasets. Hum Brain Mapp. 563:544–563.
Dyrby TB, Søgaard LV, Hall MG, Ptito M, Alexander DC. 2013. Contrast and stability of the axon diameter index from microstructure imaging with diffusion MRI. Magn Reson Med. 70:711–721.
Firmin L, Field P, Maier MA, Kraskov A, Kirkwood PA, Nakajima K, Lemon RN, Glickstein M. 2014. Axon diameters and
con-duction velocities in the macaque pyramidal tract.
J Neurophysiol. 112:1229–1240.
Fregosi M, Contestabile A, Amadjida A, Rouiller EM. 2017. Corticobular projectiosns from distinct motor cortical areas to the reticular formation in macaque monkeys. Eur J Neurosci. 45:1379–1395.
Galea MP, Darian-Smith I. 1995. Postnatal maturation of the direct corticospinal projections in the macaque monkey. Cereb Cortex. 5:518–540.
Garyfallidis E, Brett M, et al. 2014. Dipy, a library for the analysis of diffusion MRI data. Front Neuroinform. 8:1–14.
Gasser HS 1945. Mammalian Nervefibers. Nobel lecture.
Girard G, Whittingstall K, Deriche R, Descoteaux M. 2014. Towards quantitative connectivity analysis: reducing tracto-graphy biases. Neuroimage. 98:266–278.
Glasser MF, Smith SM, Marcus DS, Andersson JLR, Auerbach EJ, Behrens TEJ, Coalson TS, Harms MP, Jenkinson M, Moeller S, et al. 2016. The human connectome project’s neuroimaging approach. Nat Neurosci. 19:1175–1187.
Glickstein M, May JG III, Mercier BE. 1985. Corticopontine projec-tion in the macaque: the distribuprojec-tion of labelled cortical cells after large injections of horseradish peroxidase in the pontine nuclei. J Comp Neurol. 235:343–359.
He SQ, Dum RP, Strick PL. 1995. Topographic organization of corticospinal projections from the frontal lobe: motor areas on the medial surface of the hemisphere. J Neurosci. 15: 3284–3306.
Hursch JB. 1939. Conduction velocity and diameter of nerve fibers. Am J Physiol. 127:131–139.
Häggqvist G. 1937. Faseranalytische studien über die pyrami-denbahn. Acta Psychiatr Neurol. 12:457–466.
Ibrahim M, Butt AM, Berry M. 1995. Relationship between mye-lin sheath diameter and internodal length in axons of the anterior medullary velum of the adult rat. J Neurol Sci. 133: 119–127.
Imajo Y, Kanchiku T, Suzuki H, Yoshida Y, Funaba M, Nishida N, Fujimoto K, Taguchi T. 2017. Effects of differences in age and body height on normal values of central motor conduc-tion time determined by F-waves Effects of differences in age and body height on normal values of central motor con-duction time determined by F-waves. J Spin Cord Med. 4: 181–187.
Innocenti GM. 1995. Exuberant development of connections and its possible permissive role in cortical evolution. TINS. 18:397–402.
Innocenti GM. 2017. Evolutionary-developmental aspects of cor-tical connectivity. In: Kaas J, editor. Evolution of Nervous Systems. Vol 3. 2ed. Oxford: Elsevier. p. 113–121.
Innocenti GM, Caminiti R. 2017. Axon diameter relates to syn-aptic bouton size: structural properties define computation-ally different types of cortical connections in primates. Brain Struct Funct. 222:1169–1177.
Innocenti GM, Carlén M, Dyrby TB. 2016a. The diameters of cor-tical axons and their relevance to neural computing. Axons Brain Architecture. 317–335.
Innocenti GM, Dyrby TB, Andersen KW, Rouiller EM, Caminiti R. 2016b. The crossed projection to the striatum in two species
of monkey and in humans: behavioral and evolutionary sig-nificance. Cereb Cortex. 27:3217–3230.
Innocenti GM, Fiore L, Caminiti R. 1977. Exuberant projection into the corpus callosum from the visual cortex of newborn cats. Neurosci Lett. 4:237–242.
Innocenti GM, Manger PR, Masiello I, Colin I, Tettoni L. 2002. Architecture and callosal connections of visual areas 17, 18, 19 and 21 in the ferret (Mustela putorius). Cereb Cortex. 12: 411–422.
Innocenti GM, Price DJ. 2005. Exuberance in the development of cortical networks. Nat Rev Neurosci. 6:955–965.
Innocenti GM, Vercelli A, Caminiti R. 2013. The diameter of cor-tical axons depends both on area of origin and termination. Cereb Cortex. 24:2178–8218.
Innocenti GM, Vercelli A, Caminiti R. 2014. The diameter of cor-tical axons depends both on the area of origin and target. Cereb Cortex. 24:2178–2188.
Jbabdi S, Johansen-Berg H. 2011. Tractography: where do we go from here? Brain Connect. 1:169–183.
Jones DK. 2010. Challenges and limitations of quantifying brain connectivity in vivo with diffusion MRI. Imaging Med. 2: 341–355.
Jones DK, Knösche TR, Turner R. 2013. White matter integrity, fiber count, and other fallacies: the do’s and don’ts of diffu-sion MRI. NeuroImage. 73:239–254.
Jones EG, Wise SP. 1977. Size, laminar and columnar distribu-tion of efferent cells in the sensory-motor cortex of Monkeys. J Comp Neurol. 175:391–438.
Korogod N, Petersen CCH, Knott GW. 2015. Ultrastructural anal-ysis of adult mouse neocortex comparing aldehyde
perfu-sion with cryofixation. eLife. 4:1–17.
Lacroix S, Havton LA, McKay H, Yang H, Brant A, Roberts J, Tuszynski MH. 2004. Bilateral corticospinal projections arise from each motor cortex in the macaque monkey: a quanti-tative study. J Comp Neurol. 473:147–161.
Lemon RN, Griffiths J. 2005. Comparing the function of the cor-ticospinal system in different species: organizational differ-ences for motor specialization? Muscle Nerve. 32:261–279. Luo L, O’Leary DDM. 2005. Axon retraction and degeneration in
development and disease. Annu Rev Neurosci. 28:127–156.
Luppino G, Matelli M, Camarda R, Rizzolatti G. 1994.
Corticospinal projections from mesial frontal and cingulate areas in the monkey. NeuroReport. 5:2545–2548.
Maier MA, Armand J, Kirkwood PA, Yang H-W, Davis JN, Lemon RN. 2002. Differences in the corticospinal projection from primary motor cortex and supplementary motor area to macaque upper limb motoneurons: an anatomical and electrophysiological study. Cereb Cortex. 12:281–296. Maier MA, Kirkwood PA, Brochier T, Lemon RN. 2013.
Responses of single corticospinal neurons to intracortical stimulation of primary motor and premotor cortex in the
anesthetized macaque monkey. J Neurophysiol. 109:
2982–2998.
Maier-Hein KH, Neher PF, Houde JC, Côté MA, Garyfallidis E, Zhong J, Chamberland M, Yeh FC, Lin YC, Ji Q, et al. 2017. Tractography-based connectomes are dominated by false-positive connections. Nat Commun. 8:1349. doi:10.1038/ s41467-017-01285-x.
Markov NT, Ercsey-Ravasz MM, Ribeiro Gomes AR, Lamy C, Magrou L, Vezoli J, Misery P, Falchier A, Quilodran R, Gariel MA, et al. 2014. A weighted and directed interareal connec-tivity matrix for macaque cerebral cortex. Cereb Cortex. 24: 17–36.
Martin JH. 2004. Corticospinal system development depends on motor experience. J Neurosci. 24:2122–2132.
Matelli M, Luppino G, Rizzolatti G. 1991. Architecture of superior and mesial area 6 and the adjacent cingulate cortex in the Macaque Monkey. J Comp Neurol. 462:445–462.
Miri A, Warriner CL, Seeley JS, Elsayed GF, Cunningham JP, Churchland MM, Jessel TM. 2017. Behaviorally selective engagement of short-latency effector pathways by motor cortex. Neuron. 95:683–696.
Molnar Z, Adams R, Blakemore C. 1998. Mechanisms underlying the early establishment of thalamocortical connections in the rat. J Neurosci. 18:5723–5745.
Morecraft RJ, Ge J, Stilwell-Morecraft KS, McNeal DW,
Pizzimenti MA, Darling WG. 2013. Terminal distribution of the corticospinal projection from the arm/hand region of the primary motor cortex to the cervical enlargement in Rhesus Monkey. J Comp Neurol. 521:205–4235.
Moreno-López Y, Olivares-Moreno R, Cordero-Erausquin M, Rojas-Piloni G. 2016. Sensorimotor integration by corticosp-inal system. Front Neuroanat. 10:24. doi:10.3389/fnana.2016. 00024eCollection 2016 Mar 9. 10:24.
Murray EA, Coulter JD. 1981. Organization of corticospinal neu-rons in the monkey. J Comp Neurol. 195:339–365.
Norris CR, Kalil K. 1991. Guidance of callosal axons by radial glia in the developing cerebral cortex. J Neurosci. 11:3481–3492. Nudo RJ, Masterton RB. 1990. Descending pathways to the
spi-nal cord, III sites of origin of the corticospispi-nal tract. J Comp Neurol. 296:559–583.
Paxinos G, Huang XF, Toga AW. 2000. The rhesus monkey brain. London (England): Academic Press.
Ralston DD, Ralston HJ. 1985. The terminations of corticospinal tract axons in the macaque monkey. J Comp Neurol. 242: 325–337.
Rathelot J-A, Dum RP, Strick PL. 2017. Posterior parietal cortex contains a command apparatus for hand movements. Proc Natl Acad Sci USA. 114:4255–4260.
Rathelot J-A, Strick PL. 2009. Subdivisions of primary motor cor-tex based on cortico-motoneuronal cells. Proc Natl Acad Sci USA. 106:918–923.
Rheault F, Houde J-C, Goyette N, Morency F, Descoteaux M. 2016. “MI-Brain, a software to handle tractograms and perform interac-tive virtual dissection.” Proceeding of: Breaking the Barriers of Diffusion MRI (ISMRM workshop). Lisbon, Portugal.
Rilling JK, Glasser MF, Preuss TM, Ma X, Zhao T, Hu X, Behrens TE. 2008. The evolution of the arcuate fasciculus revealed with comparative DTI. Nat Neurosci. 11:426–428.
Rosenzweig ES, Courtine G, Jindrich DL, Brock JH, Ferguson R, Strand SC, Nout YS, Roy RR, Miller DM, Beattie S, et al. 2010. Extensive spontaneous plasticity of corticospinal projec-tions after primate spinal cord Injury. Nat Neurosci. 13: 1505–1510.
Rouiller EM, Moret V, Tanne J, Boussaoud D. 1996. Evidence for direct connections between the hand region of the supple-mentary motor area and cervical motoneurons in the macaque monkey. Eur J Neurosci. 8:1055–1059.
Silberberg G, Markram H. 2007. Disynaptic inhibition between neocortical pyramidal cells mediated by martinotti cells. Neuron. 53:735–746.
St-Onge E, Girard G, Whittingstall K, Descoteaux M 2015. Surface tracking from the cortical mesh complements
diffu-sion MRI fiber tracking near the cortex. Proceeding of:
International Society of Magnetic Resonance in Medicine (ISMRM). Toronto, Canada.
Takemura H, Caiafa CF, Wandell BA, Pestilli F. 2016. Ensemble tractography. PLoS Comput Biol. 12:e1004692.
Tettoni L, Lehmann P, Houzel J-V, Innocenti GM. 1996. Maxim, software for the analysis of multiple axonal arbors and their simulated activation. J Neurosci Meth. 67:1–9.
Thomas C, Ye FQ, Irfanoglu MO, Modi P, Saleem KS, David A, Leopold DA, Pierpaoli C. 2014. Anatomical accuracy of brain connections derived from diffusion MRI tractography is inherently limited. Proc Natl Acad Sci USA. 111:16574–16579. Tomasi S, Caminiti R, Innocenti GM. 2012. Areal differences in diameter and length of corticofugal projections. Cereb Cortex. 22:1463–1472.
Tournier J-D, Calamante F, Connelly A. 2007. Robust
determina-tion of thefibre orientation distribution in diffusion MRI:
Non-negativity constrained super-resolved spherical decon-volution. Neuroimage. 35:1459–1472.
Van Crevel H, Verhaart WJC. 1963. The “exact” origin of the
pyramidal tract. J Anat. 97:495–515.
Zaborszky L, Wouterlood FG, Lanciego JL. 2006. Neuroanatomical tract-tracing 3. Springer. p. 691.
Zinger N, Harel R, Gabler S, Israel Z, Prut Y. 2013. Functional
organization of informationflow in the corticospinal
path-way. J Neurosci. 33:1190–1197.