© by Oldenbourg Wissenschaftsverlag, München
Gas chromatography of indium in macroscopic and carrier-free
amounts using quartz and gold as stationary phases
By A. Serov1,2, R. Eichler1,2,∗, R. Dressler1, D. Piguet1, A. Türler1,2, A. Vögele1, D. Wittwer1,2 and H. W. Gäggeler1,2 1
Laboratory for Radiochemistry and Environmental Chemistry, Paul Scherrer Institute, 5232 Villigen, Switzerland 2 Departement for Chemistry and Biochemistry, University Bern, 3012 Bern, Switzerland
(Received March 15, 2010; accepted in final form September 6, 2010)
Indium / Indium hydroxide / Adsorption / Thermochromatography / Sublimation
Summary. The chemical investigation of E113 is likely to become soon feasible. The determination of chemical prop-erties of carrier-free amounts of the lighter homologues of element 113, especially indium and thallium, allows design-ing experimental set-ups and selectdesign-ing experimental conditions suitable for performing these studies. Here, we present inves-tigations of the interaction of indium species with quartz and gold surfaces. Deposition temperatures as well as enthalpies of adsorption were determined for indium Tdep= 739 ±20◦C (−∆Hads(In) = 227 ±10 kJ mol−1) and for indium hydroxide
Tdep= 250 ± 20◦C (−∆Hads(InOH) = 124 ± 10 kJ mol−1) re-spectively, on quartz. In case of adsorption of indium on a gold surface only a lower limit of the deposition tem-perature was established Tdep> 980◦C (−∆Hads(In) ≥ 315 ± 10 kJ mol−1). Investigations of macroscopic amounts of indium in thermosublimation experiments at similar experimental con-ditions were instrumental to establish a tentative speciation of the observed indium species.
1. Introduction
Transactinide elements (the elements having Z> 103), ar-tificially produced in heavy-ion-induced nuclear fusion re-actions, have been known for several decades. During this period a significant effort improving production techniques (accelerators, ion sources, new target-projectile combina-tions, new target setups) as well as developing new detection systems allowed to synthesize and to identify new elements with Z up to 118 [1]. Physical experiments revealed these elements being characterized typically by short half-lives and low production rates on a one-atom-at-a-time level. These facts significantly complicate the determination of chemical properties of transactinides. It should be mentioned that from the variety of available chemical methods only few are suit-able for the investigation of the chemical behavior of trans-actinides. Nowadays, mainly techniques based on the follow-ing three separation methods are applied: 1) gas adsorption thermochromatography or isothermal chromatography, 2) li-quid phase ion-exchange and extraction chromatography, and 3) electrochemical deposition (see for review [2,3]).
*Author for correspondence (E-mail: [email protected]).
Since the 1960’s several successful experiments with elements Rf, Db, Sg, Bh, Hs, and Cn have been performed [4–14]. The given references represent an important subset of all available experiments on the chemistry of these elements. A comprehensive overview can be found in references [2] and [3]. The deduced chemical properties were mostly in good agreement with the hypothesis that the transactinide element should behave chemically similar to its lighter ho-mologues in the corresponding group of the periodic table. Recently, first experiments with element 114 have been per-formed [15,16]. For a successful design of chemical experi-ments with transactinides the chemical investigations of their lighter homologues in carrier-free amounts were shown to be instrumental. Currently, experiments with element 113 are under development. We report here on gas-phase adsorption thermochromatographic investigations of the interaction of carrier-free113m
In as a homologue of element 113 with quartz and gold surfaces. First thermochromatography experiments with carrier-free amounts of indium in quartz columns [17] revealed a deposition pattern with one maximum at tem-peratures of 320◦C which was attributed to volatile metallic indium. We show here new data on the deposition behavior of elemental indium and its hydroxide. Carrier-added ex-periments were performed for comparison. The microscopic model of gas adsorption chromatography, implemented into a Monte-Carlo simulation code [18], yielded the standard ad-sorption enthalpy at zero surface coverage (∆Hads) of113mIn species on both surfaces. From the experiments with added indium carrier sublimation data could be evaluated using the thermosublimation approach [19]. As summarized in Table1 literature data related to the formation and to the volatil-ity of chemical species existing in the In-O-H2O system are very scarce. These literature data (Table1) were used for the identification of metallic indium. No corresponding literature data are available for InOH. Therefore, a tentative speciation was made from analogy assumptions in group 13 and new sublimation data have been deduced.
2. Experimental
2.1113mIn production
A tracer for indium was prepared using the 113Sn (T 1/2=
115 d)/113mIn (T
Table 1. Thermodynamics data for potentially volatile indium species in different carrier gases
(taken from [20] if not indicated otherwise).
Species Melting Boiling ∆Hsubl, De ∆Hf298
point,◦C point,◦C kJ mol−1 kJ mol−1 kJ mol−1
In(s) 156.6 [21] 2072 [21] 243.3 [21] 0 0 242.6 [22] In2(g) 380.9 [21] 24 392 360± 20a In2O3(s) 1910 > 3300 531 −925.3 −925.7 [22] −925.8 [21] In2O(g) 774.04 −55.0 −65.7 [22] In2O(s) 325 > 700 InO(s) 387.0 [21] InO(g) 76 167.3 (387.0) InOH(g) 160± 15a −112.968 ∆H0 f = −104.65 [23] In(OH)3(s) 340 −760.023 ∆H0 f = −552.6 [23] In(OH)2(g) ∆Hf0= −243.4 [23] a: This work.
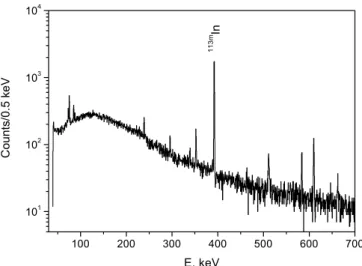
Fig. 1. Gamma spectrum of neutron irradiated natural tin.
that purpose 0.5 g of nat
Sn (99.9995% purity, Fluka) was irradiated at the neutron activation facility (SINQ-NAA) at the Paul Scherrer Institute for 2 h at a neutron flux of 1013s−1cm−2. The analysis of the gamma spectra from neu-tron irradiated natSn shows that the mainly produced iso-topes are113 Sn,113m In,111 In,114m In,117m Sn,122 Sb, and125 Sb (Fig.1). The presence of 111In and 122Sb can be explained by macroscopic amounts of indium and antimony contam-inations in the metallic tin sample. The amount of anti-mony in the tin was estimated to about 100 ppm. It was found by neutron activation analysis that the upper limit of
macroamounts of indium in the original tin sample is about 10 ppm.
2.2 Sample preparation for thermosublimatography
The irradiated sample was dissolved in a minimum amount of HClconc. Several milliliters of 30% H2O2 were added to oxidize present Sn2+ and the contamination Sb3+. The ob-tained solution containing Sn4+ and Sb5+ was deposited onto a column packed with anion-exchange resin (Dowex 1× 8 200–400 mesh). Using 1 M HCl as an eluent, the separation of113mIn from its parent113Sn and from the an-timony contamination was achieved. The separation was monitored by gamma spectroscopy. The first eluted frac-tions contained the macroscopic amounts of indium (sev-eral micrograms) marked with 114m
In and 113m
In. These fractions were transformed into the oxide by addition of concentrated HNO3, followed by evaporation to dryness and by a final heating to 500◦C in air. Finally, 10 mg of natural indium metal were added. This controlled car-rier addition was needed because the total indium amount has to be known fairly well for the data analysis from thermosublimatograpy experiments. The indium oxide and indium metal mixture were transferred into a small tan-talum tube and served for the thermosublimatography ex-periments (see Sects.2.4 and 3.1.1). For the experiments with oxidizing carrier gases the indium oxide was de-posited on a quartz wool plug, which served directly as a source for the experiments. The 10 mg of natural indium metal were added directly into the column prior to the experiments.
Fig. 2. Gamma spectrum of an eluted113mIn sample.
2.3 Sample preparation for thermochromatography
Method 1
The column with the deposited irradiated tin sample was carefully washed with 1 M HCl, until full elimination of 114mIn from the generator. The absence of 114mIn in the gamma spectra of the final eluates was taken as an indi-cation of the full separation of macroscopic amounts of indium from the tin. Based on the gamma spectra of the eluate (Fig.2) the main remaining activity can be assigned to 113mIn, as the permanently produced decay daughter of 113
Sn. No gamma lines from117m
Sn or122
Sb were observed anymore, confirming also the efficient separation of anti-mony from indium. The separation factor based on compar-ison of the activity of 114m
In (indicator for macroamounts of indium) in the irradiated sample and in the eluate can be estimated as > 105
. The eluted carrier-free 113m InCl3 was transformed into oxide by addition of concentrated HNO3, followed by evaporation to dryness and by heat-ing to 500◦C in air. Subsequently, the sample was trans-ferred into a small tantalum tube serving directly as a source for thermochromatographic investigations. For the experi-ments with oxidizing carrier gases the sample was dried on quartz wool and was used without tantalum directly as a source.
Method 2
The irradiated tin sample was heated in a constant flow of dry hydrogen (flow rate= 25 ml min−1) for several hours to the temperature of 1000◦C. At these conditions the macro-scopic amounts of indium are entirely removed from the sample. The separation factor based on comparison of the activity of114m
In (indicator for macroamounts of indium) in the irradiated sample before and after heating can be esti-mated as > 103. Subsequently, this pre-cleaned tin sample containing113
Sn was placed into a tantalum tube and could be used directly in the experiments generating permanently fresh carrier–free113m
In. This generator method turned out to be advantageous since after only one single purification the irradiated solid tin sample was ready for multiple ther-mochromatographic experiments.
For the experiments with oxidizing carrier gases the elemental tin sample was used without tantalum directly as a source.
2.4 Thermosublimatography and thermochromatography experiments
The thermosublimation experiments and the thermochroma-tography experiments were carried out in a similar manner.
The experimental set-up used both for the thermosubli-matography and for the thermochrothermosubli-matography is schemat-ically shown in Fig.3. The empty chromatographic quartz column or the quartz column covered inside by a thin gold foil was located inside of a hermetically sealed Inconel® steel tube. The carrier gas inlet and outlet were connected by Swagelok® components. Such a system is effective to maintain high carrier gas purities during the experiment by excluding diffusion of oxygen and water into the mobile phase. Additionally, at the beginning of the column a Ta foil was placed acting as a getter for remaining traces of water and oxygen as this zone was heated up to T = 1000◦C prior to the experiment. The second Ta-getter was located down-stream adjacent to the sample at about 980◦C to ensure the metallic state of113mIn. The experiments with solid metallic tin as a sample have been performed using a gradient furnace from HTM Reetz GmbH with Tmax= 1300◦C, whereas in case of eluted113mIn the gradient furnace was self-made and started from T = 1000◦C at otherwise similar experimental conditions. The experiments were performed as described by the following procedure:
– The 113m
In containing sample as obtained from the preparative steps described in Sect.2.1 was positioned inside the start oven at the startup of the experiment; – After the temperature gradient was established, this oven
was heated up rapidly within about 5 min to T= 1000◦C. To investigate chemical properties of different indium species in several experiments various carrier gases and carrier gas mixtures were used.
– In case of oxidizing carrier gases the Ta getters were omitted and the tin metal was positioned in an alumina tube inside of the quartz column. This approach was needed because at oxidizing conditions the macroscopic amount of tin oxide was reacting with the quartz surface of the column, which leads to glass formation and a sub-sequent column failure.
– After the end of the experiment the column was removed from the temperature gradient oven through the cold end.
Fig. 3. Thermochromatography set-up. 1 – carrier gas (Ar, H2, O2or
mixtures with water); 2 – start oven (1000/1300◦C); 3 –113mIn source
either on a tantalum foil, or on a quartz wool surface, or inside of irradiated metallic tin in Al2O3; 4 – getter oven (1000◦C); 5 – Ta
chips; 6 – gradient oven; 7 – chromatographic column (quartz/gold), inner diameter 4 mm; 8 – cooling system (up to liquid nitrogen 77 K temperature).
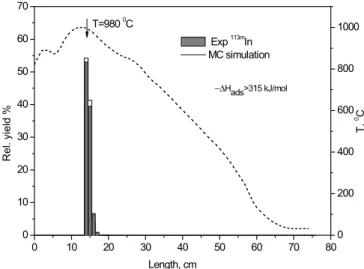
Table 2. Experimental conditions.
Initial sample Carrier Column Flow Experiment Starting Most
description gas rate, duration, temperature, probable
ml min−1 min ◦C species
Thermosublimation experiments
Sn-irradiated/Al2O3 H2 Quartz 15 120 1300 In, InOH, InO
Sn-irradiated/Al2O3 O2 Quartz 25 120 1300 In(OH)3, In2O3
Sn-irradiated/Al2O3 O2/H2O Quartz 25 120 1300 In(OH)3, In2O3
In-eluted/Ta Ar Quartz 50 60 1000 In, InOH, InO
Thermochromatographic experiments
In-eluted/Ta Ar Quartz 50 60 1000 In, InOH, InO
In-eluted/Quartz Wool O2 Quartz 50 60 1000 InOH, InO
Sn-irradiated/Al2O3 H2 Quartz 15 120 1300 In, InOH, InO
Sn-irradiated/Al2O3 O2 Quartz 25 120 1300 InO, In(OH)3
Sn-irradiated/Al2O3 O2/H2O Quartz 25 120 1300 InO, In(OH)3
In-eluted/Ta Ar Gold 50 60 1000 In, InOH
A screening of the activity distribution along the col-umn was performed by a dose meter to roughly identify the position of the indium activity in the column. Subse-quently these positions were measured by gamma spec-troscopy using a lead collimator (window size 1× 1 cm2
, lead thickness 0.7 cm) in front of a standard HPGe-γ-detector with 2.13 keV resolution at 1.33 MeV in con-junction with an acquisition and analysis system based on Canberra’s Genie2k®.
All experiments with different carrier gases (see Table2) were performed with macroamounts as well as with carrier-free amounts at otherwise the identical experimental condi-tions. The experiments with gold as stationary phase were performed only with carrier-free amounts of indium. Here, the gradient part of the column was entirely covered inside with rolled gold foils.
3. Results and discussion
3.1 Experiments with inert and reducing carrier gas
3.1.1 Thermosublimatography
Based on the scarcely available thermodynamic data (see Table1) the expected chemical states of indium at the cor-responding experimental conditions are indicated in Table2. The experiment performed with pure dry H2as a carrier gas and starting from metallic tin results in deposition of carrier-added indium at Tdep= 945◦C with∆Hsubl= 360 ± 20 kJ mol−1. This value is in good agreement with the value for the formation of the diatomic indium species In2in the gas phase ∆Hsubl(In2) = 380 kJ mol−1 [26]. Therefore, we assume that at these conditions the metallic state is the most stable one.
Starting from the oxide form and using argon as a car-rier gas the deposition of an indium species was observed at 350± 20◦C. Using the thermosublimation model [19] from our experiments the sublimation enthalpy could be estimated as∆Hsubl= 160 ± 15 kJ mol−1. This observed de-position temperature is in reasonable agreement with the previously published data [17], where deposition tempera-tures of Tdep= 295 ± 30◦C are reported for macroscopic
in-dium on quartz surfaces. This deposition peak was assigned to metallic monoatomic indium in [17]. However, the ab-sence of an extensive drying system should be considered when evaluating the speciation of indium in these studies. The authors of [17] used H2SO4 (conc)as a water catching sub-stance and no other precautions in order to remove oxygen traces were made. At such experimental conditions the for-mation of InOH rather than metallic indium can be expected. Another argument is that in experiments performed at simi-lar experimental conditions with carrier-added thallium [25] the formation of TlOH has been observed. An increase of the stability of InOH compared to TlOH is expected in com-parison to the corresponding elemental states. Therefore, the low temperature deposition peak is tentatively attributed to indium monohydroxide. This presumption was confirmed during a validation procedure as described in Sect.3.4. 3.1.2 Thermochromatography
A thermochromatogram of carrier-free indium in a quartz column using argon as a carrier gas and introducing sam-ples prepared from the liquid phase separation process is shown in Fig.4. The deposition temperatures Tdep= 320 ± 10◦C are in excellent agreement with the previously ob-tained Tdep= 330±30◦C [17]. Using the Monte-Carlo simu-lation method [18] the enthalpy of adsorption was deter-mined as−∆Hads(113mInOH) = 143 ± 10 kJ mol−1(Fig.4).
Using irradiated tin as a source of carrier-free 113mIn and pure and dry hydrogen as a carrier gas as well as 1300◦C starting temperature two different deposition tem-peratures were observed: T1= 739 ± 20◦C and T2= 250 ± 20◦C (Fig.5). The second peak seems to originate from the same compound as shown in Fig.4, whereas the first peak we attribute tentatively to a deposition of elemental indium. Using the Monte Carlo model [18] the adsorption enthalpy of carrier-free metallic 113mIn on quartz was de-termined as−227 ± 10 kJ mol−1 (Fig.5). This observation was confirmed in additional experiments. Using pure hy-drogen as carrier gas ensures the low oxidation states for indium. Therefore, we prefer the determined adsorption en-thalpy from this measurement for InOH on quartz surfaces (−∆Hads(113mInOH) = 124 ± 10 kJ mol−1).
Fig. 4. Thermochromatogram of113mInOH on quartz surface (grey bars,
left hand axis) using as carrier gas 50 ml min−1 argon. The solid line indicates the result of the Monte-Carlo simulation of the expected deposition pattern for InOH with an adsorption enthalpy of −143 ± 10 kJ mol−1. The temperature gradient is shown (dashed line, right hand axis).
Fig. 5. Experimental thermochromatograms of carrier-free 113mIn
species on quartz surface (grey bars, left hand axis) using as carrier gas 15 ml min−1H2. The solid line indicate the results of Monte-Carlo
sim-ulations of the expected deposition patterns for indium and InOH with an adsorption enthalpy of−227±10 kJ mol−1and−124±10 kJ mol−1, respectively. The temperature gradient is shown (dashed line, right hand axis).
3.2 Experiments with oxidizing carrier gas
3.2.1 Thermosublimatography and thermochromatography
In the experiments with pure O2and O2/H2O as carrier gases both carrier-added and carrier-free amounts of indium did not form any oxide or hydroxide species volatile either at 1000◦C from a quartz wool plug or from Al2O3at 1300◦C (see Table2). This observation might be explained by a high reactivity of the oxide or oxohydroxide species of indium in its oxidation state three with quartz and alumina at the experimental conditions with a formation of non-volatile glasses. This behavior was not observed for thallium, whose oxidation state 3+ is less stable that of indium [25]. Hence, we suggest that this approach could be an excellent tool for the preparative separation of indium from thallium. This ob-served difference between indium and thallium can also be applied to design a test experiment for the stability of the
trivalent oxidation state of the elements of group 13, includ-ing the transactinide element 113.
3.3 Thermochromatography of113mIn in gold columns
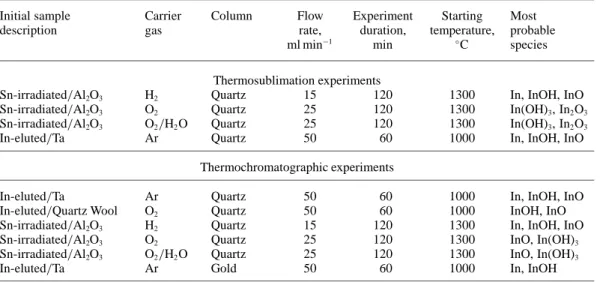
The thermochromatography experiments of indium on gold surfaces revealed that 113m
In was entirely deposited on the first four centimeters of the gold surface, at Tdep= 980◦C. Due to the low melting point of gold, the gold coverage of the quartz column could be installed only at tempera-tures of about 980◦C and lower. Hence, the observed position temperature was established as a lower limit de-position temperature of single atoms of 113mIn on gold. A lower limit value for −∆Hads of single atomic indium on gold surfaces could be determined as 315± 10 kJ mol−1 (Fig.6). This value is in good agreement with data pre-dicted by using the Eichler–Miedema adsorption model [28] (−∆HadsAu(In) = 313.8 kJ mol−1).
3.4 Validation of the presumed speciation
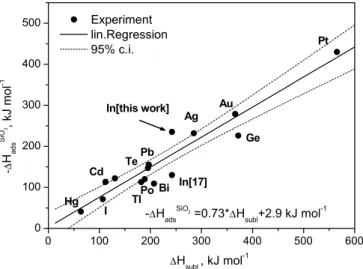
To validate the suggested speciation of the observed indium depositions (In and InOH) correlation plots between macro-scopic (∆Hsubl) and microscopic (∆Hads) properties were used (see Figs. 7and8). The data obtained in our experi-ments for InOH are in reasonable agreement with the expec-tations, thus corroborating the assignment. The adsorption enthalpy of elemental indium on quartz is about 45 kJ mol−1 higher than the expected value from the correlation (see Fig.7). This discrepancy might indicate a surface reaction involved in the chromatographic transport of elemental in-dium over quartz surfaces. However, the thermosublimation experiments clearly revealed the metallic state for indium at the corresponding experimental conditions. Further work is needed to resolve this problem. This unexpected effect shows even more the importance of such studies with the carrier-free amounts of the lighter elements of group 13 in preparation of the design of experiments with element 113.
Fig. 6. Thermochromatogram of113mIn (grey bars, left hand axis) on
gold surface using as carrier gas 50 ml min−1 argon. The solid line shows the result of the Monte-Carlo simulation of the expected de-position pattern for indium on gold with an adsorption enthalpy of −315 ± 10 kJ mol−1. The temperature gradient is shown (dashed line,
Fig. 7. Correlation of the adsorption enthalpy∆Hads of elements on
quartz surfaces with the macroscopic property sublimation enthalpy
∆Hsubl[22]. The value for indium obtained in this work is highlighted.
Fig. 8. Correlation of the adsorption enthalpy∆Hads of oxidic
com-pounds on quartz surfaces with the macroscopic property sublimation enthalpy∆Hsubl[22]. The position of InOH within this correlation plot
was obtained in this work.
4. Conclusions
Experiments with macroscopic amounts of indium revealed the deposition temperatures of In2 and InOH. Sublimation data have been estimated for these species, ∆Hsubl(In2) = 360± 20 kJ mol−1 and ∆Hsubl(InOH) = 160 ± 15 kJ mol−1. Data obtained for the sublimation enthalpy for In2 are in good agreement with the literature data [20]. Sublimation data for InOH have been deduced for the first time.
At carrier-free conditions it was observed that atomic indium is volatile revealing a deposition temperature on the quartz surface of Tdep= 739 ± 20◦C (−∆Hads= 227 ± 10 kJ mol−1) whereas InOH is deposited at T= 250 ± 20◦C (−∆Hads= 124 ± 10 kJ mol−1). The deposition of indium on gold surface indicates a much stronger interaction com-pared to quartz in good agreement with the prediction from [28]. A lower limit deposition temperature was estab-lished as Tdep> 980◦C, with a limit of adsorption enthalpy of−∆Hads> 315 ± 10 kJ mol−1.
Based on deposition temperatures of the homologues of element 113 on quartz and on the gold surface from this work and for thallium from [25] it can be expected that E113 will reveal a lower deposition temperature in its elemental state compared to indium and thallium on both stationary surfaces, if the trend within the group 13 persists. The same trend should be expected in the case of deposition of the heavier group 13 monohydroxides on quartz surfaces [25]. Predictions obtained from quantum chemical calculations of E113 adsorption [27] corroborate these suggestions. An ac-curate prediction of the element 113 volatility in elemental state or as hydroxide remains difficult, though.
Acknowledgment. This work was supported by the Swiss National
Sci-ence Foundation (grant: 200020-117671/1).
References
1. Oganessian, Yu. Ts.: Heaviest nuclei from48Ca-induced reactions.
J. Phys. G 34, R165–R242 (2007).
2. Schädel, M. (ed.): The Chemistry of Superheavy Elements. Kluwer Academic Publishers, Springer (2003).
3. Schädel, M.: Chemistry of superheavy elements. Angew. Chem. Int. Ed. 45, 368 (2006).
4. Zvara, I., Tschuburkov, Y. T., Zaletka, P., Zvarova, T. S., Sha-laevski, M. R., Shilov, B. V.: Chemical properties of element 104. Atom. Energ. 21, 83 (1966).
5. Zvara, I., Chuburkov, Y. T., Caletka, R., Shalaevsky, M. R.: Chem-ical experiments with element 104. Sov. Radiochem. 11, 161 (1969), translated from Radiokhimiya 11, 163 (1969).
6. Kadkhodayan, B., Türler, A., Gregorich, K. E., Nurmia, M. J., Lee, D. M., Hoffman, D. C.: The heavy element volatility instru-ment (HEVI). Nucl. Instrum. Methods A 317, 254 (1992). 7. Kadkhodayan, B., Türler, A., Gregorich, K. E., Baisden, P. A.,
Czerwinski, K. R., Eichler, B., Gäggeler, H. W., Hamilton, T. M., Jost, D. T., Kacher, C. D., Kovacs, A., Kreek, S. A., Lane, M. R., Mohar, M. F., Neu, M. P., Stoyer, N. J., Sylwester, E. R., Lee, D. M., Nurmia, M. J., Seaborg, G. T., Hoffman, D. C.: On-line gas chromatographic studies of chlorides of rutherfordium and ho-mologs Zr and Hf. Radiochim. Acta 72, 169 (1996).
8. Schädel, M., Brüchle, W., Dressler, R., Eichler, B., Gäggeler, H. W., Günther, R., Gregorich, K. E., Hoffman, D. C., Hübener, S., Jost, D. T., Kratz, J. V., Paulus, W., Schumann, D., Timokhin, S., Trautmann, N., Türler, A., Wirth, G., Yakushev, A.: Chemical properties of element 106 (seaborgium). Nature 388, 55 (1997). 9. Schädel, M., Brüchle, W., Schausten, B., Schimpf, E., Jäger, E.,
Wirth, G., Günther, R., Kratz, J. V., Paulus, W., Seibert, A., Thör-le, P., Trautmann, N., Zauner, S., Schumann, D., Andrassy, M., Misiak, R., Gregorich, K. E., Hoffman, D. C., Lee, D. M., Syl-wester, E. R., Nagama, Y., Oura, Y.: First aqueous chemistry with seaborgium (element 106). Radiochim. Acta 77, 149 (1997). 10. Türler, A., Brüchle, W., Dressler, R., Eichler, B., Eichler, R.,
Gäggeler, H. W., Gärtner, M., Glatz, J. P., Gregorich, K. E., Hübe-ner, S., Jost, D. T., Lebedev, V. Ya., Pershina, V. G., Schädel, M., Taut, S., Timokhin, S. N., Trautmann, N., Yakushev, A. B.: First measurement of a thermochemical property of a seaborgium com-pound. Angew. Chem. Int. Ed. 38, 2212 (1999).
11. Eichler, R., Brüchle, W., Dressler, R., Düllmann, Ch. E., Eich-ler, B., GäggeEich-ler, H. W., Gregorich, K. E., Hoffman, D. C., Hübe-ner, S., Jost, D. T., Kirbach, U. W., Laue, C. A., Lavanchy, V. M., Nitsche, H., Patin, J. B., Piquet, D., Schädel, M., Shaughnessy, D. A., Strellis, D. A., Taut, S., Tobler, L., Tysganov, Y. S., Tür-ler, A., Vahle, A., Wilk, P. A., Yakushev, A. B.: Chemical charac-terization of bohrium (element 107). Nature 407, 63 (2000). 12. Düllmann, Ch. E., Dressler, R., Eichler, B., Gäggeler, H. W.,
Glaus, F., Jost, D. T., Piguet, D., Soverna, S., Türler, A., Brüch-le, W., Eichler, R., Jäger, E., Pershina, V., Schädel, M., Schausten, B., Schimpf, E., Schött, H.-J., Wirth, G., Eberhardt, K., Thörle, P., Trautmann, N., Ginter, T. N., Gregorich, K. E., Hoffman, D. C., Kirbach, U. W., Lee, D. M., Nitsche, H., Patin, J. B., Sudowe, R., Zielinski, P. M., Timokhin, S. N., Yakushev, A. B., Vahle, A.,
Qin, Z.: Chemical investigation of hassium (element 108). Nature
418, 859–862 (2002).
13. Eichler, R., Aksenov, N. V., Belozerov, A. V., Bozhikov, G. A., Chepigin, V. I., Dressler, R., Dmitriev, S. N., Gäggeler, H. G., Gorshkov, V. A., Haenssler, F., Itkis, M. G., Lebedev, V. Y., Lau-be, A., Malyshev, O. N., Oganessian, Yu. Ts., Petruschkin, O. V., Piguet, D., Rasmussen, P., Shishkin, S. V., Shutov, A. V., Svirikhin, A. I., Tereshatov, E. E., Vostokin, G. K., Wegrzecki, M., Yeremin, A. V.: Chemical properties of element 112. Nature 447, 72–75 (2007).
14. Eichler, R., Aksenov, N.V, Belozerov, A. V., Bozhikov, G. A., Chepigin, V. I., Dressler, R., Dmitriev, S. N., Gäggeler, H. G., Gorshkov, V. A., Haenssler, F., Itkis, M. G., Lebedev, V. Y., Lau-be, A., Malyshev, O. N., Oganessian, Yu. Ts., Petruschkin, O. V., Piguet, D., Rasmussen, P., Serov, A. A., Shishkin, S. V., Shutov, A. V., Svirikhin, A. I., Tereshatov, E. E., Vostokin, G. K., Weg-rzecki, M., Yeremin, A. V.: Thermochemical and physical proper-ties of element 112. Angew. Chem. Int. Ed. 47(17), 3262–3266 (2008)
15. Wittwer, D., Abdullin, F. Sh., Aksenov, N. V., Albin, Yu. V., Bo-zhikov, G. A., Dmitriev, S. N., Dressler, R., Eichler, R., Gäggeler, H. W., Henderson, R. A., Hübener, S., Kenneally, J. M., Lebe-dev, V. Ya., Lobanov, Yu. V., Moody, K. J., Oganessian, Yu. Ts., Petrushkin, O. V., Polyakov, A. N., Piguet, D., Rasmussen, P., Sagaidak, R. N., Serov, A., Shirokovsky, I. V., Shaughnessy, D. A., Shishkin, S. V., Sukhov, A. M., Stoyer, M. A., Stoyer, N. J., Tere-shatov, E. E., Tsyganov, Yu. S., Utyonkov, V. K., Vostokin, G. K., Wegrzecki, M., Wilk, P. A.: Gas phase chemical studies of su-perheavy elements using the dubna gas-filled recoil separator – stopping range determination. Nucl. Instrum. Methods B 268(1), 28 (2010).
16. Eichler, R., Aksenov, N. V., Albin, Yu. V., Belozerov, A. V., Bo-zhikov, G. A., Chepigin, V. I., Dmitriev, S. N., Dressler, R., Gäg-geler, H. W., Gorshkov, V. A., Henderson, R. A., Johnsen, A. M., Kenneally, J. M., Lebedev, V. Ya., Malyshev, O. N., Moody, K. J., Oganessian, Yu. Ts., Petrushkin, O. V., Piguet, D., Popeko, A. G., Rasmussen, P., Serov, A., Shaughnessy, D. A., Shishkin, S. V., Shutov, A. V., Stoyer, M. A., Stoyer, N. J., Svirikhin, A. I., Tere-shatov, E. E., Vostokin, G. K., Wegrzecki, M., Wilk, P. A.,
Witt-wer, D., Yeremin, A. V.: Indication for a volatile element 114. Radiochim. Acta 38, 133–139 (2010).
17. Eichler, B.: Investigation of distribution of nuclear reaction prod-ucts in carrier-free form by thermochromatography method in the hydrogen stream. Dubna Report P12-6662, 3 (1972).
18. Zvara, I.: Simulation of thermochromatographic processes by the Monte Carlo method. Radiochim. Acta 38, 95 (1985).
19. Eichler, B., Zude, F., Fan, W., Trautmann, N., Herrmann, G.: Volatilization and deposition of ruthenium oxides in a temperature gradient tube. Radiochim. Acta 56, 133 (1992).
20. Online database “Thermo-constants for elements and substances”, http://www.chem.msu.su/cgi-bin/tkv.pl?show=welcome.html, in Russian (2010).
21. Barin, I., Knacke, O.: Thermochemical Properties of Inorganic
Substances. Springer, New York (1973).
22. Barin, I.: Thermochemical Data of Pure Substances. 3rdEdn.,
VCH-Verlagsgesellschaft, Weinheim (1995).
23. Skulan, A. J., Nielsen, I. M. B., Melius, C. F., Allendorf, M. D.: BAC-MP4 predictions of thermochemistry for gas-phase indium compounds in the In-H-C-O-Cl system. J. Phys. Chem. A 110, 281 (2006).
24. Adape, M. H., Potchen, E. J.: A simplified method for laboratory preparation of organ specific indium 113m compounds. Korean J. Nucl. Med.. 3(1), 13 (1969).
25. König, S., Gäggeler, H. W., Eichler, R., Haenssler, F., Soverna, S.: The production of long-lived thallium isotopes and their ther-mochromatographic studies on quartz and gold. In: PSI Annual Report 2005, (2005).
26. Wagman, D. D., Evans, W. H., Parker, V. B., Hallow, I., Bai-ley, S. M., Schumm, R. H.: Selected Values of Chemical Ther-modynamic Properties National Bureau of Standards, Technical Notes No 1(1965), Ks 2(1966), Ns 3(1968), Ns 270-4(1969), Washington, USA.
27. Pershina, V., Anton, J., Jacob, T.: Electronic structures and prop-erties of MAu and MOH, where M= Tl and element 113. Chem. Phys. Lett. 480, 157 (2009).
28. Eichler, B.: Adsorption of Metals on Metal Surfaces and the Pos-sibility of its Application in Nuclear Chemistry. Report Zfk-396, Rossendorf (1979).
![Table 1. Thermodynamics data for potentially volatile indium species in different carrier gases (taken from [20] if not indicated otherwise).](https://thumb-eu.123doks.com/thumbv2/123doknet/14896888.651954/2.892.58.568.106.551/table-thermodynamics-potentially-volatile-species-different-carrier-indicated.webp)