Abstract
Background Excessive gambling is a prominent Public Health problem with high prevalence rates in many countries. Substance abuse and other co-morbidities often constitute a major health hazard for the person which gambles with a loss of material and social resources, as well as being a major concern for his or her significant others. The present study updates and extends prevalence data to include work published between 2000 and 2005 in English and other European languages.
Methods In a three-step search and exclusion process, studies with current adult prevalence rates were gathered.
Results Almost all studies fulfil basic research standards. The weighted mean prevalence rates for excessive gambling (problem and pathological) are 3.0% for the South Oaks Gambling Survey (problem 1.2%; pathological 1.8%), 3.3% for the Canadian Problem Gambling Index (problem 2.4%; pathological 0.8%) and 3.1% for the DSM-IV (problem 1.9%; pathological 1.2%).
Conclusion The prevalence rates are comparable and relatively stable between countries and across survey instruments, and do not differ from earlier reviews. The regular epidemiological monitoring of excessive gambling remains a major Public Health issue although the distinction between pathological and problem gambling is not appropriate for epidemiological research. Further studies are needed with respect to concomitant lifestyle characteristics.
Keywords Gambling Æ Problem gambling Æ Pathological gambling Æ Excessive gambling Æ Prevalence
S. Stucki Æ M. Rihs-Middel (&)
Centre du Jeu Excessif (CJE), University Hospital, Rue Saint-Martin 7, 1003 Lausanne, Switzerland
e-mail: [email protected] S. Stucki
Department of Psychology, University of Bern, Bern, Switzerland DOI 10.1007/s10899-006-9031-7
O R I G I N A L P A P E R
Prevalence of Adult Problem and Pathological
Gambling between 2000 and 2005: An Update
Stephanie Stucki Æ Margret Rihs-Middel
Received: 25 July 2006 / Accepted: 30 October 2006 / Published online: 11 January 2007
Introduction
More liberal gaming laws and practice in countries such as Canada, the United States, Australia and Switzerland (Rihs et al., 2006; Cox, Yu, Afifi, & Ladouceur,
2005; Raylu & Oei,2002; Bondolfi, Osiek, & Ferrero,2000; Korn & Shaffer,1999) might lead to an increase in the prevalence of gambling problems. Many people gamble from time to time in their lives without any problems. However, some people exhibit what is called excessive gambling, i.e., problem or pathological gambling behaviour which negatively influences their lives and the lives of significant others and creates major health costs for the community (Shaffer & Kidman,2004; Raylu & Oei, 2002; Korn & Shaffer, 1999). Current prevalence rates of excessive gambling reported among adults are comparable to other health problems, e.g., alcohol or a lack of physical activity (Schofield, Mummery, Wang, & Dickson, 2004). Certain sociodemographic factors appear to be of key importance. For example, males are generally more likely to show excessive gambling than females (Rihs et al., 2006; Welte, Barnes, Wieczorek, Tidwell, & Parker,2002; Cunningham-Williams, Cottler, Compton, & Spitznagel,1998; Volberg, 1994). The rates of excessive gambling are also higher among special target groups, for example prisoners (problem gambling 15–22%, pathological gambling 7–20%) (Abbott & McKenna,2000; Abbott, McK-enna, & Giles, 2000) or psychiatric patients (Shaffer, Hall, & Vander, 1999; Blas-zczynski & Steel,1998; Crockford & El-Guebaly,1998; Cunningham-Williams et al.,
1998; Miller & Westermeyer,1996; Lesieur & Blume, 1990). Substance abuse ap-pears to be a common co-morbid problem (Miller & Westermeyer,1996); particu-larly alcohol (Welte et al., 2001; Bondolfi, Osiek, & Ferrero,2000; Slutske et al.,
2000; Smart & Ferris, 1996) and, less frequently illegal drug use (Cunningham-Williams & Cottler,2001).
Pathological gambling is included as an impulse-control disorder in the fourth edition of the Diagnostic and Statistical Manual of Mental Disorders (DSM-IV) (American Psychiatric Association, 1994): ‘‘The essential feature of pathological gambling is persistent and recurrent maladaptive gambling behaviour that disrupts personal, family or vocational pursuits.’’ (p. 615). Problem gambling is often con-sidered to be a less severe form of pathological gambling (Volberg,2001a,b). In this study we will consider problem and pathological gambling as two distinct categories of increasing severity and will call both behaviours excessive gambling.
To date several surveys of prevalence and incidence rates have been published, most of them conducted in English speaking countries, but there is no recent sum-mary of the international literature available. Two meta-analyses have been pub-lished, covering studies conducted in the United States and Canada through June 1999 (Shaffer & Hall,2001, Shaffer, Hall, & Vander,1999). The authors classify the included studies on three levels: level 1 includes persons who do not experience any gambling problems (non-problem and non-gamblers), level 2 consists of persons with a sub-clinical level of gambling problems (e.g., problem, at-risk, potential patho-logical, in transition), and level 3 comprises persons with disordered gambling (e.g., pathological). They show mean prevalence rates for adults of 1.46% and 1.14% (update) for past year level 3 gambling and of 2.54% and 2.8% (update) for past year level 2 gambling. A comparison between the first study and the update showed an increase in level 3 gambling whereas level 2 gambling remained stable. The authors explain this with the interaction between personality and social setting: More adults
gamble, often not in an adjusted way, because of increased gambling opportunities and the social acceptance of gambling (Shaffer & Hall,2001). The prevalence rates among adolescents, college students and prisoners remained stable, however at a higher level compared to the general adult populations.
The aim of the present study is to present an update of recent international research (published between January 2000 and June 2005) with respect to excessive gambling prevalence rates among adults. The main objective of this study is to evaluate variation and stability across prevalence measures.
Method
Studies were sought in the databases Medline, PsycINFO, Pubmed, Web of Science and scholar.google. Databases were searched using the following key words: ‘‘gambling, gaming, prevalence, incidence, pathological gambling, problem gam-bling, excessive gamgam-bling, and disordered gambling.’’ The studies had to meet the following criteria: (a) published between January 2000 and 15. July 2005, (b) men-tions prevalence rates of adults (age ‡ 15), (c) menmen-tions prevalence rates in the abstract, (d) the measured rate was past year prevalence (lifetime prevalence studies were excluded; two studies were included that only approximated ‘‘past year’’) and (e) the main results of the study included information required for the current update Importantly, the databases were searched with the same terms in German, French, Italian, and Spanish, as well as English. Additional published prevalence studies were sought through the internet (especially including government websites) and through expert recommendations. The reference lists of the studies obtained were further searched for other relevant studies. Different studies presenting the same survey were included only once.
As mentioned, two studies used shorter timeframes than past year prevalence. They were treated as past year prevalence because the differences between the past time were relatively small (Abbott, Volberg, & Ronnberg,2004), nevertheless, they represent a more conservative estimate (Shaffer & Hall,2001). When the timeframe of measurement was not mentioned, a lifetime prevalence approach was assumed, and the study was excluded from the current review. The first step yielded a total of 59 studies.
In a second step, studies concerned exclusively with special groups (n = 18) such as the elderly, young adults and students, prisoners, casino patrons, persons with a regular or frequent gambling behaviour and drug dependants were excluded for the purpose of the present analysis.
In a third step, several studies were excluded due to the following criteria: (a) a sample of less than 500 persons (1 study), (b) either problem or pathological gam-bling mentioned (2 studies), (c) methodological problems (3 studies) and (d) follow-up with a subgrofollow-up of a previous published study, due to selection bias (2 studies). In some studies two or more instruments were compared (4 studies). They were included just once, considering first the SOGS (South Oaks Gambling Screen), then the CPGI (Canadian Problem Gambling Index), then the DSM-IV (fourth edition of the Diagnostic and Statistical Manual of Mental Disorders). One study compared two populations using two different instruments. In this case, both samples were included and treated as two separate studies.
In a further step, basic quality criteria for the remaining thirty-three (20 SOGS, 9 CPGI, 4 DSM) articles were assessed using three criteria.
• Adequate description of a research question, description of the topic, definition of the most important terms
• Selection procedure, instruments, descriptive statistics
• Adequate reporting of the (quantitative) results, implications or conclusions (e.g., problems such as selection bias)
The criteria were selected according to basic research standards. For our purpose a stricter rating was not advisable due to the fact, that many studies were not published in journals, but rather on government websites. Scores of 1 or 0 were used, 1 = criteria fulfilled, 0 = criteria not mentioned or insufficient (per criteria one point is possible). Two studies could not be rated, due to a language problem (Norwegian) and because of difficulties in obtaining the full text.
Results
Most studies were published in English (n = 29; 88%), 19 (58%) were conducted in North America, 7 (21%) in Europe, 4 (12%) in Australia or New Zealand, and 2 (6%) in Asia. Most studies were published on government websites (n = 21; 64%), with others in journals (n = 6; 18%), three in books (9%) and two were press re-leases (6%). Most of the studies (n = 29; 88%) were based on telephone interviews with the interviewees randomly sampled. In some cases (n = 22; 67%) stratified sampling quotas were used (the most common were sex, age, and area). For gen-eralisation purposes, some of the studies used after data collection weighting pro-cedures (n = 20; 61%): ‘‘By adding up the weights for the different categories of these variables, exactly the right number of men and women, the right age distri-bution, and so on in the sample compared with the population are generated.’’ (p. 252; Volberg, Abbott, Ronnberg, & Munck,2001). Weighting procedures are par-ticularly important in order to take into account the situation of the general popu-lation from which the sample was drawn.
Overall, elementary quality standards were met. Almost all of the studies (n = 28; 85%) reported basic information about the method, results, and further conclusions. One study obtained a score of two because the instruments used were not described adequately. The other study with a low rating was not fully accessible. The rating is therefore based on the summary only.
Abstracts or executive summaries, biases (e.g., selection bias) or other problems, which occurred in conducting the studies were often not described or not described adequately. More stringent criteria would obviously offer a finer grained differen-tiation among the studies.
Normally either the SOGS, the CPGI, or the DSM-IV is used for classifying respondents’ gambling behaviour as problematic or pathological. Sometimes two or all three measures were used. The SOGS normally employs a classification system in which people with problem gambling are those who score 3 or 4 on the SOGS (potential pathological gambling, potential problem gambling, problem gambling, or possible problem gambling) and pathological gambling or probable pathological gambling receives a score of 5 or more (Lesieur & Blume,1987). The studies using the CPGI classify persons with a score from 3 to 7 as ‘‘moderate problem gambling’’
and a score of 8 or higher as ‘‘severe problem gambling.’’ The studies using the DSM-IV apply the normal classification for pathological gambling. People meeting 5 out of 10 criteria are labelled as practising pathological gambling. In more recent studies, people with a score of 3 or 4 have been labelled practising problem gambling or potential pathological gambling. Normally the mean number of people with problem gambling and the mean number with pathological gambling are summed to achieve a mean rate of excessive gambling (problem + pathological = excessive). This can result in rounding errors.
The results are presented in three tables, based on the screening instrument used. Table1shows the results of studies using the SOGS (Biganzoli, Capelli, Capitanucci, Smaniotto, & Alippi,2004; Ladouceur et al.,2004; Schofield et al., 2004; Lund & Nordlund2003; Ministry of Public Safety and Solicitor General,2003; Orford et al.,
2003; Volberg, 2003; Shapira, Ferguson, Frost-Pineda, & Gold, 2002; Vogel & Ardoin, 2002; Volberg, 2002; Australian Institute for Gambling Research, 2001; Ferris & Wynne, 2001; Gullickson & Hartmann,2001; Volberg2001a,b; Volberg
2001a,b; Volberg, Abbott, Ronnberg, & Munck, 2001; Welte, Barnes, Wieczorek, Tidwell, & Parker,2001; Abbott & Volberg,2000; Bondolfi; Osiek, & Ferrero,2000; Molo Bettelini, Alippi, & Wernli,2000).
The studies found prevalence rates for excessive gambling between 0.6% and 6.4% (weighted mean 3.0%, un-weighted mean 2.7%). Almost two thirds of the gambling rates can be found between 1% and 3%. Problem gambling rates range from 0.4% to 3.6% (weighted mean 1.2%, un-weighted mean 1.6%). Prevalence rates for pathological gambling range from 0.2% to 3.5% (weighted mean 1.8%, un-weighted mean 1.2%), although the next lower value below 3.5% is 1.91%. The weighted mean of pathological gambling is—contrary to the un-weighted mean and against expectations—higher than the estimate for problem gambling. This is a result of several large scale studies which also showed higher prevalence rates for patho-logical as compared to problem gambling, thus distorting the overall weighted mean (Australian Institute for Gambling Research,2001).
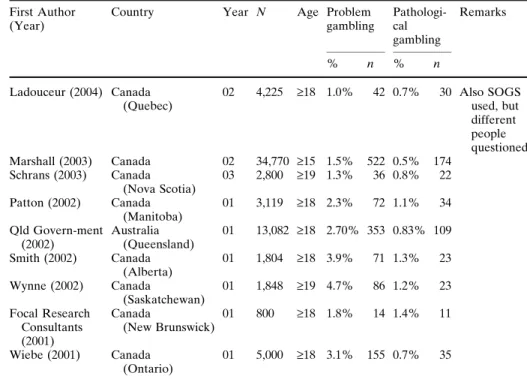
Table2 shows the results of studies using the CPGI (Ladouceur et al., 2004; Schrans & Schellinck, 2004; Marshall & Wynne, 2003; Patton, Brown, Dhaliwal, Pankratz, & Broszeit,2002; Queensland Government,2002; Smith & Wynne,2002; Wynne,2002; Focal Research Consultants,2001; Wiebe, Single, & Falkowski-Ham,
2001).
The studies reported prevalence rates for excessive gambling between 1.7 % and 5.9% (weighted mean 3.3%). Problem gambling ranges from 1.0% to 4.7% (weighted mean 2.4%). Prevalence rates for pathological gambling range from 0.5% to 1.4% (weighted mean 0.8%). Eight of the nine studies were conducted in Canada and one in New Zealand.
Table3shows the results of studies using the DSM-IV (Ministry of Community Development YaS,2005; Boardman, Jones, Perry, & Wood,2003; Go¨testam & Jo-hansson,2003; Wong & So,2003).
The studies show prevalence rates for excessive gambling between 0.6% and 5.8% (weighted mean 3.1%). Problem gambling rates range from 0.45% to 4.0% (weighted mean 1.9%). Prevalence rates for pathological gambling range from 0.15% to 2.1% (weighted mean 1.2%). Only four studies fulfilled our inclusion criteria.
Ta ble 1 Prev alence rates of prob lem and path ological gamblin g 2000 –2005 sei zed with the SOGS Fir st Auth or (Year) Country Year N Age Pro blem gam-blin g Path olog ical gamb ling Re marks % n % n B iganzoli (2004) Italy (Pav ia) 03/04 1,09 3 18–7 4 0.7% 8 0.4% 4 La douce ur (200 4) Canada (Que bec) 02 4,60 3 ‡ 18 0.9% 41 0.9% 41 Also CPGI use d, bu t diffe rent peop le qu estion ed Sch ofield (200 4) New Z ealan d (Que enslan d) 00 1,02 9 ‡ 18 1.7% 17 1.7% 17 La st mon th prevalen ce Lu nd (200 3) Norway – 5,23 9 ‡ 15 0.4% 21 0.2% 10 Also NOD S use d MPS SG (200 3) Canada (Briti sh Col umbia ) 0 2 2,50 0 ‡ 18 2.8% 70 1.1% 28 Also CPGI use d O rford (200 3) UK – 7,68 0 ‡ 16 1.2% 92 0.8% 62 Also DSM used Volb erg (2003) USA (Arizona) 02/03 2,75 0 ‡ 18 1.6% 44 0.7% 19 Also NOD S use d Sh apira (2002) USA (Florid a) 01 1,50 4 ‡ 18 2% 30 – – Also NOD S use d, only exces sive gamb ling Voge l (200 2) USA (Louisi ana) 02 1,35 3 ‡ 18 2.87 % 3 9 1.58 % 2 1 Volb erg (2002) USA (Nevada) 00/01 2,21 7 ‡ 18 2.9% 64 3.5% 78 Also NOD S use d A IGR (200 1) Australi a 0 1 276, 777 ‡ 18 1.21 % 3355 1.91 % 5297 Ferr is (2001) Canada 00 3,12 0 ‡ 18 1.3% 41 1.3% 41 C ompariso n SOGS, C PGI, DSM -IV G ullickson (200 1) USA (Michi gan) 01 1,21 1 ‡ 18 1.8% 22 1.0% 12 Volb erg (2001) Sweden 97/98 7,13 9 15–7 4 1.4% 100 0.6% 43 Volb erg (2001) USA (North Dakota) 00 5,00 2 ‡ 18 0.7% 35 1.4% 70 Also NOD S use d Volb erg (2001) USA (Oreg on) 00 1,50 0 ‡ 18 1.4% 21 0.9% 14 Wel te (200 1) USA 99/00 2,63 8 ‡ 18 3.6% 95 1.9% 50 Also DSM used A bbott (200 0) New Z ealan d 9 9 6,45 2 ‡ 18 0.8% 52 0.5% 32 Past 6-month pre valen ce B ondolfi (200 0) Switzerland – 2,52 6 ‡ 18 2.2% 55 0.8% 20 Mol o B ettelin i (2000) Switzerland (Te ssin) 98 1,04 4 ‡ 18 0.6% 6 0.6% 6 SOGS = South Oaks G ambli ng Scre en (proble m 3 and 4, path olog ical ‡ 5) D SM-IV = Diagno stic and Stati stical M anual IV (prob lem 3 and 4, patholo gica l ‡ 5) C PGI = C anadian Probl em Gamb ling Index (moder ate prob lem gambli ng 3–7, seve re prob lem gamb ling ‡ 8) NOD S = Natio nal Opinio n Resear ch Centre Scre en (prob lem 3 and 4, path ological ‡ 5) MPS SG = Ministry of Public Safe ty and Solicito r Gen eral A IGR = Austra lian Institute for G ambling Resear ch
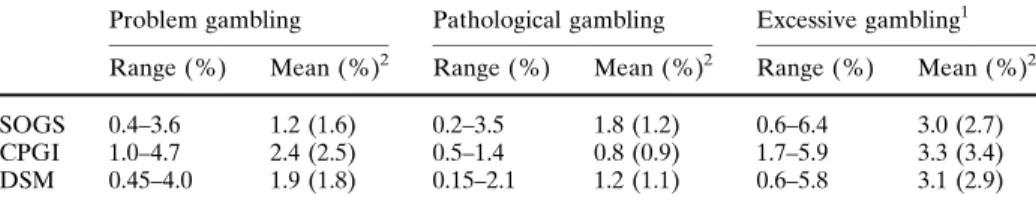
Altogether, the prevalence rates for excessive gambling range, independent of the instrument used, between 0.6% to 6.4% (weighted mean 3.0%), within which problem gambling ranges from 0.4% to 4.7% (weighted mean 1.4%) and patho-logical gambling from 0.15% to 3.5% (weighted mean 1.6%).
Several tendencies between regions of the world can be observed, although statistical comparisons were not performed due to small numbers of studies per
Table 2 Prevalence rates of problem and pathological gambling 2000–2005 seized with the CPGI First Author
(Year)
Country Year N Age Problem
gambling Pathologi-cal gambling Remarks % n % n Ladouceur (2004) Canada (Quebec) 02 4,225 ‡18 1.0% 42 0.7% 30 Also SOGS used, but different people questioned Marshall (2003) Canada 02 34,770 ‡15 1.5% 522 0.5% 174 Schrans (2003) Canada (Nova Scotia) 03 2,800 ‡19 1.3% 36 0.8% 22 Patton (2002) Canada (Manitoba) 01 3,119 ‡18 2.3% 72 1.1% 34 Qld Govern-ment (2002) Australia (Queensland) 01 13,082 ‡18 2.70% 353 0.83% 109 Smith (2002) Canada (Alberta) 01 1,804 ‡18 3.9% 71 1.3% 23 Wynne (2002) Canada (Saskatchewan) 01 1,848 ‡19 4.7% 86 1.2% 23 Focal Research Consultants (2001) Canada (New Brunswick) 01 800 ‡18 1.8% 14 1.4% 11 Wiebe (2001) Canada (Ontario) 01 5,000 ‡18 3.1% 155 0.7% 35
CPGI = Canadian Problem Gambling Index (moderate problem gambling 3–7, severe problem gambling ‡ 8)
SOGS = South Oaks Gambling Screen (problem 3 and 4, pathological ‡ 5) Qld Government = Queensland Government
Table 3 Prevalence rates of problem and pathological gambling 2000–2005 seized with the DSM-IV First author
(Year)
Country Year N Age Problem
gambling Pathologi-cal gam-bling Remarks % n % n MCYS (2005) Singapore 04/05 2,004 ‡18 2.0% 40 2.1% 42 Boardman (2003) USA (Kentucky) 03 1,253 ‡18 0.7% 9 0.5% 6 Go¨testam (2003) Norway 97 2,014 ‡18 0.45% 9 0.15% 3 Wong (2003) China (Hong Kong) 01 2,004 15–64 4.0% 81 1.8% 37
DSM-IV = Diagnostic and Statistical Manual IV (problem 3 and 4, pathological ‡ 5) MCYS = Ministry of Community Development
region (n < 5 in several cells). Most of the studies were performed in North America, just two in Asia, conducted in two big cities. Moreover such comparisons are complicated by the fact that different survey instruments were used. In Asia we found the highest rates of excessive gambling. North America tends to report higher prevalence rates than Australia and New Zealand, while European countries report the lowest rates. Excessive gambling in the western states of Canada is somewhat higher than the rates in the eastern states.
Discussion
Some problems are persistent across studies. Our main objections concern: • Varying timeframes between the studies: gambling behaviour reported may be
past year, past six months or past month (for methodological reasons, studies with a lifetime approach have been excluded). The different timeframes com-plicate systematic reviews for many studies or renders them impossible alto-gether.
• Lack of accessibility of studies: for example two-third (91 out of 139) of the studies included in a recent meta-analysis were only accessible through personal contact (Shaffer & Hall,2001). This might indicate publication bias, because of the possibility that not all available publications were identified.
• Selection bias: women are more frequently at home than men (and therefore available for telephone interview); and in Canada two out of three persons with pathological gambling did not have a telephone (Lepage, Ladouceur, & Jaques,
2000).
• Sampling bias: telephone surveys exclude particular groups, for example people in institutions such as prisons or hospitals; or people nowadays are using cell phones instead of conventional telephone networks; in addition there is under sampling of ethnic or cultural groups because of language and communication difficulties; finally, as with many disorders, there is a low response rate among those at the high end of the disorder (Rihs et al.,2006).
All these methodological problems would be minimised by following general guidelines for research and publication. Furthermore meta-analysis and knowledge acquisition would be facilitated. For example, bias problems can be reduced by
Table 4 Range and weighted mean of problem, pathological and excessive gambling seized with the SOGS, CPGI and DSM-IV
Problem gambling Pathological gambling Excessive gambling1 Range (%) Mean (%)2 Range (%) Mean (%)2 Range (%) Mean (%)2
SOGS 0.4–3.6 1.2 (1.6) 0.2–3.5 1.8 (1.2) 0.6–6.4 3.0 (2.7)
CPGI 1.0–4.7 2.4 (2.5) 0.5–1.4 0.8 (0.9) 1.7–5.9 3.3 (3.4)
DSM 0.45–4.0 1.9 (1.8) 0.15–2.1 1.2 (1.1) 0.6–5.8 3.1 (2.9)
1 Problem and pathological gambling together
2 In briks un-weighted mean % of problem and pathological gambling are not necessarily summing
up to excessive gambling, first due to rounding errors, and second due to the fact, that the study with the highest problem gambling rate is not necessarily responsible for the highest pathological gam-bling rate
following adequate sampling and weighting procedures, which were followed by several of the included studies. For an adequate measurement of excessive gambling and to pursue future analyses, appropriate screening instruments are necessary. The use of the SOGS for the general population was criticised during the past years because of its foundation on clinical subpopulations, conceptualised along the lines of the DSM (Wiebe, Single, & Falkowski-Ham, 2001), and the production of too many false positives (Focal Research Consultants,2001). With the inclusion of more social and environmental factors related to excessive gambling, the CPGI tries to go a step further, towards a comprehensive instrument for the use in the general population (Ferris & Wynne,2001). The DSM tends to yield lower rates for path-ological gambling than the other instruments (Ladouceur et al., 2004), which underscores the hypothesis that excessive gambling might be a greater problem still in the Asian countries. Whether the CPGI can take over in the future remains an open question. To date it is mainly used in Canada and is not validated for different cultures and languages. It is necessary to await the validation of the CPGI for different regions and languages before deciding which instrument is the best appli-cable for epidemiological research. For the moment very little speaks against the use of the SOGS in epidemiological studies. Its use in previous studies facilitates cross-cultural comparisons. In general, for broad screenings with the general population, a short and easy to administer instrument, which is validated with large samples, appears to be necessary.
The prevalence rates remain relatively stable across countries, authors, strategy and time, as others have shown (Shaffer & Hall, 2001; Shaffer, Hall, & Vander,
1999). As shown above, the mean prevalence rates (un-weighted) for studies in North America conducted with different instruments are for problem gambling 2.8% (2.54% for the update) and for pathological gambling 1.14% (1.46% for the update) (Shaffer & Hall,2001; Shaffer, Hall, & Vander,1999). A comparison of five different surveys conducted between 1991 and 2000 with the SOGS exhibit prevalence rates for problem gambling from 0.8% to 3.6% and for pathological gambling from 0.5% to 2.3% (Abbott, Volberg, & Ronnberg, 2004). Another summary using data gathered between 1991 and 1999 using the SOGS shows prevalence rates for path-ological gambling between 0.4% and 2.9% (Hing & Breen, 2002). In the future, larger population wide comparative studies are needed. Also cultural differences between continents, between countries and within countries need to be addressed.
A further detailed analysis of the data is necessary in order to explain stable prevalence rates in changing times. Predictions for future developments are difficult. Prevalence rates can increase, remain stable or decrease (Shaffer & Hall, 2001; Shaffer, Hall, & Vander, 1999). For adults, an increase in past year gambling prevalence could be demonstrated, but only with respect to pathological gambling: ‘‘As gambling became more socially accepted and accessible during the past two decades, this population segment started to gamble in increasing numbers. (...) Newly exposed to the gambling experience, some adults in the general population are having difficulty adjusting and, unlike members of other population segments who already evidenced gambling problems, are beginning to encounter increasing gambling-related difficulties’’ (p. 171; Shaffer & Hall, 2001). So this finding would point to the fact that it was not possible for persons with problem gambling behaviour to stop it or continue it in a controlled manner. Rather it became path-ological. But for some people, excessive gambling is just a temporary problem for a relatively limited time period after which they stop gambling without special
support. This process might be supported by changed gambling laws and practices (e.g., self-exclusion at casinos), which is well supported by measures of structural prevention which have been shown effective in areas such as alcohol or tobacco use (Rihs-Middel, Roberts, & Winer, 2006). An increased availability of gambling opportunities normally goes with an increase in prevalence rates (Abbott, Volberg, & Ronneberg, 2004). Due to scarce treatment opportunities and the lack of ade-quate prevention programmes gamblers remain in the excessive categories, which increases prevalence rates when new people become excessive gamblers. More effective treatment opportunities and reinforced prevention efforts by the govern-ment could lower or stabilise the rates.
Moreover a differentiation between research within the general population and clinical subpopulations is necessary. The distinction between pathological and problem gambling makes sense for a clinical approach. There will always be people that suffer from their gambling behaviour and need help and support. A differential allocation of resources according to the severity of the problem is necessary. For Public Health concerns, however, it is more appropriate to concentrate on excessive gambling rates. The distinction between problem and pathological gambling is less evident from an epidemiological viewpoint. Some studies yielded higher prevalence rates for problem gambling as compared to pathological gambling; several studies showed higher prevalence rates for pathological gambling than for problem gam-bling, and some studies showed equal rates for both prevalence measures. According to our findings it appears that for epidemiological studies and for screening purposes the distinction between gambling and excessive gambling is sufficient and a further distinction between problem and pathological gambling should be reserved for more detailed clinical analysis. It goes without saying that a shorter screening instrument could be useful in allowing for the integration of gambling assessment into routine health surveys consistent with approved quality standards.
Acknowledgments The present study has benefited from the support of many people and institu-tions. We wish to thank Jacques Besson, Laurence Aufre`re, and Olivier Simon from the Centre for Excessive Gambling. Our gratitude is extended to Ronnie and Charles Blakeney, for their helpful comments and to all the others who contributed to this text for their valuable support. The authors received financial support for completing this study from the Department of Psychiatry of the University Hospital, Lausanne, Switzerland.
References
Abbott, M., & McKenna, B. G. (2000). Gambling and problem gambling among recently sentenced women prisoners in New Zealand. The Department of Internal Affairs. Available from: URL: www.dia.govt.nz.
Abbott, M. W., & Volberg, R. A. (2000). Taking the pulse on gambling and problem gambling in New Zealand: A report on phase one of the 1999 national prevalence survey. The Department of Internal Affairs. Available from: URL: www.dia.govt.nz.
Abbott, M., McKenna, B. G., & Giles, L. C. (2000). Gambling and problem gambling among recently sentenced males in four New Zealand prisons. The Department of Internal Affairs. Available from: URL: www.dia.govt.nz.
Abbott, M. W., Volberg, R. A., & Ronnberg S. (2004). Comparing the New Zealand and Swedish national surveys of gambling and problem gambling. Journal of Gambling Studies, 20(3), 237– 258.
American Psychiatric Association. (1994). Diagnostic and Statistical Manual of Mental Disorders. Fourth Edition. Washington, DC.
Australian Institute for Gambling Research (AIGR). (2001). Survey of the nature and extent of gambling and problem gambling in the ACT. The ACT Gambling and Racing Commission. Available from: URL: www.gamblingandracing.act.gov.au.
Biganzoli, A., Capelli, M., Capitanucci, D., Smaniotto, R., & Alippi, M. (2004). Indagine sui com-portamenti di gioco d’azzardo in provincia di Pavia. Il gioco nel territorio. [An investigation into pathological gambling. Epidemiological study of gambling attitudes and prevalence of patho-logical gambling in the Pavia province (Italy)]. Casa Editrice DREAM.
Blaszczynski, A., & Steel, Z. (1998). Personality disorders among pathological gamblers. Journal of Gambling Studies, 14(1), 51–71.
Boardman, B., Jones, J., Perry, J., & Wood, M. (2003). Compulsive gambling in Kentucky. Legli-sative Research Commission. Available from: URL: www.lrc.ky.gov.
Bondolfi, G., Osiek, C., & Ferrero, F. (2000). Prevalence estimates of pathological gambling in Switzerland. Acta Psychiatrica Scandinavica, 101(6), 473–475.
Cox, B. J., Yu, N., Afifi, T. O., & Ladouceur, R. (2005). A national survey of gambling problems in Canada. Canadian Journal of Psychiatry, 50(4), 213–217.
Crockford, D. N., & El-Guebaly, N. (1998). Psychiatric comorbidity in pathological gambling: A critical review. Canadian Journal of Psychiatry, 43(1), 43–50.
Cunningham-Williams, R. M., Cottler, L. B., Compton, W. M., & Spitznagel, E. L. (1998). Taking chances: Problem gamblers and mental health disorders. Results from the St. Louis epidemio-logic catchment area study. American Journal of Public Health, 88(7), 1093–1096.
Cunningham-Williams, R. M., & Cottler, L. B. (2001). The epidemiology of pathological gambling. Seminars in Clinical Neuropsychiatry, 6(3), 155–166.
Ferris, J., & Wynne, H. (2001). The Canadian Problem Gambling Index: Final report. Canadian Centre for Substance Abuse. Available from: URL: www.ccsa.ca.
Focal Research Consultants. (2001). Survey of gambling and problem gambling in New Brunswick. New Brunswick Department of Health and Wellness. Available from: URL: www.gnb.ca. Go¨testam, K. G., & Johansson, A. (2003). Characteristics of gambling and problematic gambling in
the Norwegian context. A DSM-IV based telephone interview study. Addictive Behaviors, 28(1), 189–197.
Gullickson, A. R., & Hartmann, D. (2001). A survey of gambling behaviors in Michigan, 2001. Report to The Michigan Department of Community Health. The Michigan Department of Community Health. Available from: URL: www.wmich.edu.
Hing, N., & Breen, H. (2002). A profile of gaming machine players in clubs in Sydney, Australia. Journal of Gambling Studies, 18(2), 185–205.
Korn, D. A., & Shaffer, H. J. (1999). Gambling and the health of the public: Adopting a Public Health perspective. Journal of Gambling Studies, 15(4), 289–365.
Ladouceur, R., Jacques, C., Chevalier, S., Se´vigny, S., Hamel, D., & Allard, D. (2004). Pre´valence des habitudes de jeu et du jeu pathologique au Que´bec en 2002 [Prevalence of gambling habits and problem gambling in Que´bec 2002]. Que´bec et Montre´al: Universite´ Laval et Institut na-tional de sante´ public du Que´bec.
Lepage, C., Ladouceur, R., & Jacques, C. (2000). Prevalence of problem gambling among com-munity service users. Comcom-munity Mental Health Journal, 36(6), 597–601.
Lesieur, H. R., & Blume, S. B. (1987). The South Oaks Gambling Screen (SOGS)— -A new instrument for the identification of pathological gamblers. American Journal of Psychiatry, 144(9), 1184–1188.
Lesieur, H. R., & Blume, S. B. (1990). Characteristics of pathological gamblers identified among patients on a psychiatric admissions service. Hospital & Community Psychiatry, 41(9), 1009– 1012.
Lund, I., & Nordlund, S. (2003). Pengespill og pengespillproblemer i norge [Gambling and problem gambling in Norway]. Oslo: SIRUS. Available from: URL: http://www.sirus.no.
Marshall, K., & Wynne, H. (2003). Fighting the odds. Perspectives on labour and income. Statistic Canada, 12(4), 5–13.
Miller, M. A. R. M., & Westermeyer, J. M. (1996). Gambling in Minnesota. American Journal of Psychiatry, 153(6), 845.
Ministry of Public Safety and Solicitor General. (2003). British Columbia problem gambling prev-alence study. Ministry of Public Safety and Solicitor General. Available from: URL: www.pssg.gov.bc.ca.
Ministry of Community Development YaS. (2005). More than half of Singapore gambles; But only 2 in 100 at risk of gambling addiction. Ministry of Community Development. Available from: URL: www.mcys.gov.sg.
Molo Bettelini, C., Alippi, M., & Wernli, B. (2000). Il gioco patologico in Ticino: uno studio epi-demiologico [An investigation into pathological gambling]. Mendrisio: Centro di documentazi-one e ricerca OSC.
Orford, J., Sproston, K., Erens, B., White, C., & Mitchell, L. (2003). Gambling and problem gam-bling in Britain. Brunner-Routledge, East Susssex.
Patton, D., Brown, D., Dhaliwal, D., Pankratz, K., & Broszeit, B. (2002). Gambling involvement and problem gambling in Manitoba. Addictions Foundation of Manitoba. Available from: URL: www.afm.mb.ca.
Queensland Government (2002) Queensland Household Gambling Survey 2001. Office of the Government Statistician. Available from: URL: www.nla.gov.au/nla.arc-51569.
Raylu, N., & Oei, T. P. (2002). Pathological gambling. A comprehensive review. Clinical Psychology Review, 22(7), 1009–1061.
Rihs-Middel, M., Roberts, G., & Winer, J. (2006). Experimental studies of acute alcohol intake and aggression: a meta-analysis. (in print).
Rihs, M., Andronicos, M., Stucki, S., Stach, M., Simon, O., Aufre`re, L., et al. (2006). ‘‘Vulne´rabilite´ par rapport au jeu de hasard et d’argent: Implications pour la pre´vention.’’ Recherches de l’OFSP en matie`re de de´pendances 2002-03 - Volume 2/3: Pre´vention. Ed.Office fe´de´ral de la sante´ publique. Bern: Office fe´de´ral de la sante´ publique, 2006. 113–120.
Schofield, G., Mummery, K., Wang, W., & Dickson, G. (2004). Epidemiological study of gambling in the non-metropolitan region of central Queensland. Australian Journal of Rural Health, 12(1), 6– 10.
Schrans, T., & Schellinck, T. (2004). 2003 Nova Scotia gambling prevalence study. Nova Scottia Office of Health Promotion. Available from: URL: www.gov.ns.ca.
Shaffer, H. J., Hall, M. N., & Vander, B. J. (1999). Estimating the prevalence of disordered gambling behavior in the United States and Canada: A research synthesis. American Journal of Public Health, 89(9), 1369–1376.
Shaffer, H. J., & Hall, M. N. (2001). Updating and refining prevalence estimates of disordered gambling behaviour in the United States and Canada. Canadian Journal of Public Health. Revue Canadienne de Sante´ Publique, 92(3), 168–172.
Shaffer, H. J., & Kidman, R. (2004). Gambling and the public health. In J. E. Grant, M. N. Potenza (Eds.), Pathological Gambling. A clinical guide to treatment. Washington, D.C., London, England: American Psychiatric Publishing, Inc.
Shapira, N. A., Ferguson, M. A., Frost-Pineda, K., & Gold, M. S. (2002). Gambling and problem gambling prevalence among adults in Florida. A Report to the Florida Council on Compulsive Gambling, Inc.
Slutske, W. S., Eisen, S., True, W. R., Lyons, M. J., Goldberg, J., & Tsuang, M. (2000). Common genetic vulnerability for pathological gambling and alcohol dependence in men. Archives of General Psychiatry, 57(7), 666–673.
Smart, R. G., & Ferris J. (1996). Alcohol, drugs and gambling in the Ontario adult population, 1994. Canadian Journal of Psychiatry—Revue Canadienne de Psychiatrie, 41(1), 36–45.
Smith, G. J., & Wynne, H. (2002). Measuring gambling and problem gambling in Alberta. Using the Canadian Problem Gambling Index (CPGI). Alberta Gaming Research Institute. Available from: URL: www.uofaweb.ualberta.ca.
Vogel, R. J., & Ardoin P. (2002). Gambling in Louisiana. 2002 Louisiana study of problem gambling. Office for Addictive Disorders. Available from: URL: www.dhh.state.la.us.
Volberg, R. A. (1994). The prevalence and demographics of pathological gamblers: Implications for Public Health. American Journal of Public Health, 84(2), 237–241.
Volberg, R. A. (2001a). Changes in gambling and problem gambling in Oregon: Results from a replication study, 1997 to 2000. Northampton, MA: Gemini Research Inc.
Volberg, R. A. (2001b). Gambling and problem gambling in North Dakota: A replication study, 1992 to 2000. Report to the North Dakota Office of the Governor. Gemini Research. Available from: URL: www.state.nd.us.
Volberg, R. A., Abbott, M. W., Ronnberg, S., & Munck, I. M. (2001). Prevalence and risks of pathological gambling in Sweden. Acta Psychiatrica Scandinavica, 104(4), 250–256.
Volberg, R. A. (2002). Gambling and problem gambling in Nevada. Report to the Nevada Department of Human Resources. Gemini Research. Available from: URL: www.hr.state.nv.us. Volberg, R. A. (2003). Gambling and problem gambling in Arizona. Report to the Arizona Lottery.
Welte, J., Barnes, G. M., Wieczorek, W. F., Tidwell, M. C., & Parker, J. (2001). Alcohol and gambling pathology among U.S. adults: Prevalence, demographic patterns and comorbidity. Journal of Studies on Alcohol, 62(5), 706–712.
Welte, J., Barnes, G. M., Wieczorek, W. F., Tidwell, M. C., & Parker J. (2002). Gambling partici-pation in the U.S. Results from a national survey. Journal of Gambling Studies, 18(4), 313–337. Wiebe, J., Single, E., & Falkowski-Ham, A. (2001). Measuring gambling and problem gambling in Ontario. Responsible Gambling Council. Available from: URL: www.responsiblegambling.org. Wong, I. L., & So, E. M. (2003). Prevalence estimates of problem and pathological gambling in Hong
Kong. American Journal of Psychiatry, 160(7), 1353–1354.
Wynne, H. (2002). Gambling and problem gambling in Saskatchewan. Canadian Centre on Sub-stance Abuse. Available from: URL: www.health.gov.sk.ca.