HAL Id: hal-01244987
https://hal.archives-ouvertes.fr/hal-01244987
Submitted on 16 Dec 2015HAL is a multi-disciplinary open access archive for the deposit and dissemination of sci-entific research documents, whether they are pub-lished or not. The documents may come from teaching and research institutions in France or abroad, or from public or private research centers.
L’archive ouverte pluridisciplinaire HAL, est destinée au dépôt et à la diffusion de documents scientifiques de niveau recherche, publiés ou non, émanant des établissements d’enseignement et de recherche français ou étrangers, des laboratoires publics ou privés.
M. Rajab Pourrahmati, N. Baghdadi, A. Asghar Darvishsefat, M.
Namiranian, V. Gond, Jean-Stéphane Bailly
To cite this version:
M. Rajab Pourrahmati, N. Baghdadi, A. Asghar Darvishsefat, M. Namiranian, V. Gond, et al.. Lorey’s height regression for ICESAT-GLAS waveforms in hyrcanian deciduous forests of Iran. IGARSS 2015, Jul 2015, Milan, Italy. pp.4105-4108, �10.1109/IGARSS.2015.7326728�. �hal-01244987�
LOREY’S HEIGHT REGRESSION FOR ICESAT-GLAS WAVEFORMS IN
HYRCANIAN DECIDUOUS FORESTS OF IRAN
Manizheh Rajab Pourrahmati
*1,2, Nicolas Baghdadi
1, Ali Asghar Darvishsefat
2, Manouchehr
Namiranian
2, Valery Gond
3, Jean Stéphane Bailly
4*1 IRSTEA, UMR TETIS,
34093
Montpellier, France;manizheh.pourrahmati@teledetection.fr; nicolas.baghdadi@teledetection.fr
2 Faculty of Natural Resources, University of Tehran, Karaj, Iran;
mrajabpour@ut.ac.ir; adarvish@ut.ac.ir; mnamiri@ut.ac.ir
3 CIRAD, UPR B&SEF, campus international de Baillarguet, Montpellier, France; valery.gond@cirad.fr 4
AgroParisTech, UMR LISAH, 34093 Montpellier Cedex 5, France, bailly@agroparistech.fr
ABSTRACT
Since Lidar technology provides the most direct measurements of 3D of phenomena, it plays a critical role in a variety of applications. Forest canopy height as a main factor in forest biomass estimation is costly and time consuming to be measured on the ground. This study aims to estimate Lorey’s height “Hlorey” using GLAS data based on regression models. Different metrics like waveform extent “Wext”, trail-edge extent “Htrail” and lead-trail-edge extent “Hlead” were extracted from waveforms and a terrain index “TI” was also calculated using a digital elevation model. Hlorey estimated using multiple regression models were compared to field measurements data. A 5-fold cross validation method was used to validate the results. Best model with lowest AIC (297.440) was resulted using combination of Wext and TI (𝑅𝑎2=0.72; RMSE= 5.04m). The results show capability of ICESat-GLAS to estimate Lorey’s height in sloped area with a simple regression model. It is prospected to reach better result using other statistical methods and also improvement of processing techniques for LiDAR waveforms in the case of sloped terrain.
Index Terms— ICESat-GLAS, Lorey’s height, Waveform
extent, Terrain index, Regression model. 1. INTRODUCTION
Forest height is one of fundamental quantitative parameters in forest biometry. The information about vertical structure of forest is essential for ecosystem health assessment and biodiversity conservation [1]. On the other hand, carbon cycle modeling and
monitoring need to forest biophysical information like height [5]. Improvement in altimetry technology, airborne and consequently spaceborne Lidar, led to collect direct measurements of 3D information over whole countries. Geoscience Laser Altimeter System (GLAS) on board ICESat provides (used because it is down now) vertical profile of laser-illuminated surfaces, so-called waveform [3]. Based on references, vertical difference between the waveform signal start, which assumes to be the canopy top, and the ground peak is defined as canopy height over flat area. But
vertical extent of each waveform increases as a function of terrain slope [6, 11]. Researchers have used GLAS data for estimating different biophysical parameters of forest such as forest height [6, 10, 13], forest volume [12] and biomass [2, 11] in various ecological and structural conditions, mostly over flat or low sloped area. This research aims to investigate how accurate would be GLAS estimation of Lorey’s height over sloped area using regression models.
2. STUDY AREA AND DATASET
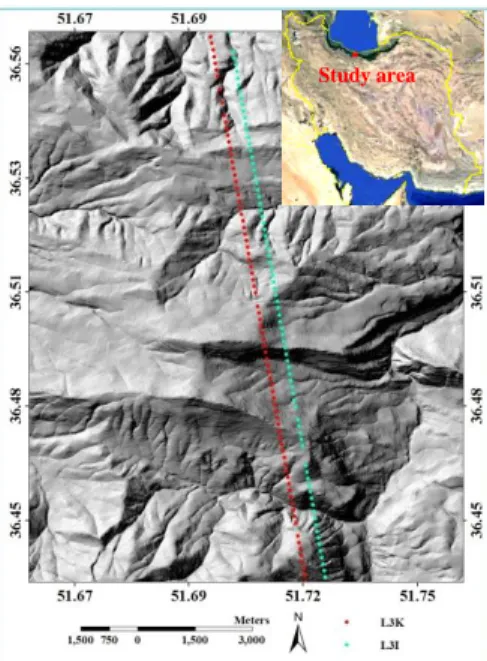
Nowshahr forests in north of Iran between 36.15 to 36.40 degrees North latitudes and 51.18 to 51.56 degrees East longitudes was selected as study area. This area containing broadleaved deciduous species is located mostly over sloped terrain (Figure 1). NASA Distributed Active Archive Center (NSIDC) distributes 15 Level-1 and Level-2 data products from GLAS. Two GLAS products (GLA01 and GLA14) related to October 2007 and 2008 were analyzed to estimate forest Lorey’s height.
Figure 1- Location of study area in Iran (up right image),
and L3K and L3I footprints over a hillshade.
3. FIELD MEASUREMENT
60 GLAS footprints were located on the ground using GPS. Diameter at breast height of all trees greater than 7.5 cm and height of 10 trees were measured within each 70 m diameter circle plot. DBH-height relationships were developed for 6 groups of species to compute height for all trees. Lorey’s height, the basal area weighted height, was calculated in each plot: 𝐇𝐋= ∑𝐧 𝐁𝐀𝐢× 𝐇𝐢 𝐢=𝟏 ∑𝐧𝐢=𝟏𝐁𝐀𝐢 = ∑𝐧 𝐃𝐁𝐇𝐢𝟐× 𝐇𝐢 𝐢=𝟏 ∑𝐧 𝐃𝐁𝐇𝐢𝟐 𝐢=𝟏 (1)
Where, HL, BAi, DBHi and Hi are Lorey’s height
(m), basal area (cm2), diameter at breast height (cm) and height (m) of each tree (i), respectively, and n is total number of trees in each plot.
4. METHODOLOGY 4.1. GLAS data processing
Different filters were performed to remove undesirable waveforms include cloud contaminated, saturated and noisy waveforms [2,6,7,9]. Required information and metrics were extracted from remained waveforms based on metadata of GLA01 and GLA14 products. Waveform extent (Wext) defined as vertical distance between ground return peak and signal start [10], trail-edge extent height (Htrail) and lead-edge extent height (Hlead) were derived from waveforms according
to [2,9]. To take into account ground topography effects on height estimation, Terrain Index (TI) was derived from a digital elevation model (DEM) of 10 meter resolution [6,10,12].
4.2. Estimation of Lorey’s height using regression models
The objective was to find the accuracy of ICESat-GLAS estimated Lorey’s height with regression models over sloped area. The waveform extent increases as a function of slope and the footprint size, and returns from both canopy and ground surfaces can be mixed [8,10]. Hence it is necessary to decrease slope impact on waveform. Researchers tried to reduce the impact of terrain slope through adding complimentary information from a DEM [6,10] or based on information extracted directly from waveforms [11]. In this study multiple regression models were developed using variables including Wext, TI, Htrail and Hlead. Different statistics including mean difference (MD.cv), adjusted R-square (R2a.cv), root mean square error (RMSE.cv), and Akaike information criterion (AIC.cv) were computed between the Lorey’s height predicted from GLAS data and in-situ measured heights after 5-fold cross validation.
5. RESULT
The Performance of regression functions have been presented in table 1. To find best model, the difference between each model’s AIC and minimum value of AICs (Δ= AIC.cv-AIC.cvmin) was calculated.
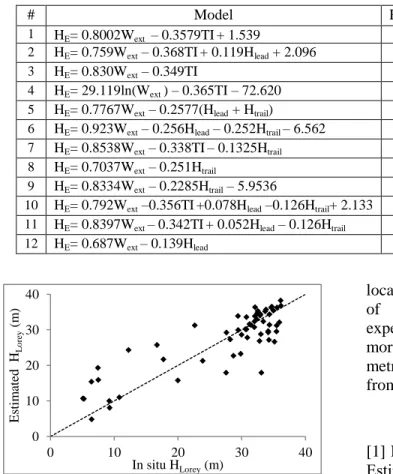
The model with Δ=0 is the best model, and models with Δ≤2 have substantial support, those with 4≤Δ ≤7 have considerably less support and models with Δ >10 have essentially no support to be the best model [4]. Model 4, as the best model (Δ=0) produced highest R2a and lowest RMSE equal to 0.72 and 5.04m, respectively. Figure 2 represents the comparison between estimated height and in situ lorey’s height. As it is seen in the table 2, models with TI produced better result among all models.
Table 1- Performance of regression models
# Model RMSE.cv R2a.cv MD.cv AIC.cv
Δ
1 HE= 0.8002Wext – 0.3579TI+ 1.539 5.39 0.68 0.044 299.256 4.458
2 HE= 0.759Wext – 0.368TI+ 0.119Hlead + 2.096 5.64 0.65 -0.024 300.852 6.054
3 HE= 0.830Wext – 0.349TI 5.27 0.70 -0.183 297.440 2.642
4 HE= 29.119ln(Wext ) – 0.365TI – 72.620 5.04 0.72 0.013 294.798 0.000
5 HE= 0.7767Wext – 0.2577(Hlead + Htrail) 6.74 0.50 0.158 324.455 29.657
6 HE= 0.923Wext – 0.256Hlead – 0.252Htrail – 6.562 6.89 0.47 0.056 326.213 31.415
7 HE= 0.8538Wext – 0.338TI– 0.1325Htrail 5.41 0.68 -0.140 298.026 3.228
8 HE= 0.7037Wext – 0.251Htrail 7.00 0.46 0.174 325.164 30.366
9 HE= 0.8334Wext – 0.2285Htrail – 5.9536 7.03 0.46 0.075 325.370 30.572
10 HE= 0.792Wext –0.356TI+0.078Hlead –0.126Htrail+ 2.133 5.69 0.63 0.015 301.601 6.803
11 HE= 0.8397Wext – 0.342TI+ 0.052Hlead – 0.126Htrail 5.59 0.65 -0.138 299.945 5.147
12 HE= 0.687Wext – 0.139Hlead 6.92 0.48 0.281 327.653 32.855
Figure 2- Estimated Lorey’s height versus In situ Lorey’s
height using model 4
6. CONCLUSIONS
This study has proven the usage of regression models to estimate forest Lorey’s height using ICESat-GLAS data. It became possible to predict the Lorey’s height using a logarithmic regression of Wext and TI variables with an accuracy of 5 m. This result is desirable especially in estimation of forest height in regional and national scales. Better performance of models including TI emphasizes the importance of terrain index in height estimation over steep area. It could be reasonable because the TI has been extracted from fine resolution DEM produced using 1:25000 topographic maps which provides good information about terrain variability. The result of [6] in sites with average slope of 20%, confirms this idea too. As trail and lead-edge extents rely on accurate recognition of ground and canopy top peaks, and this would be more challenging over sloped area [11], regression models based on these metrics have not produced good results. The time interval of 5 years between GLAS data and field measurements, and also the possible error of
locating footprints on the ground could be two sources of error in height estimation. Better results are expected by overcoming these errors. Furthermore, more investigation is needed to find out representative metrics of slope which are more reliable to extract from waveform or other ancillary data.
7. REFERENCES
[1] R.U. Ahmed, “Accuracy of Biomass and Structure Estimates from Radar and Lidar,” Open Access Dissertations, 231pp, 2012.
[2] N. Baghdadi, G. Maire, I. Fayad, J.S. Bailly, Y. Nouvellon, C. Lemos and R. Hakamada, “Testing different methods of forest height and aboveground biomass estimations from ICESat/GLAS data in Eucalyptus plantations in Brazil,” IEEE Journal of Selected Topics in Applied Earth Observations and Remote Sensing, vol. 7, no. 1, pp. 290-299, 2014. [3] A.G. Brenner, R.J. Zwally, C.R. Bentley, B.M. Csatho, D.J. Harding, M.A. Hofton, J.B. Minster, L. Roberts, J.L. Saba, R.R. Thomas and D. Yi3, “Derivation of range and range distributions from laser pulse waveform analysis for surface elevations, roughness, slope, and vegetation heights, Geoscience Laser Altimeter System (GLAS),” Algorithm theoretical basis document, Version 4.1: 92pp, 2003. [4] K.P. Burnham and D.R. Anderson, “Model selection and multimodel inference: A practical information-theoretic approach,” 2nd ed. New York: Springer-Verlag Press, 488pp, 2002.
[5] M. Cairns, J. Barker, R. Shea and P. Haggerty, “Carbon dynamics of Mexican tropical evergreen forests: influence of forestry mitigation options and 0 10 20 30 40 0 10 20 30 40 Esti m ated HL o re y (m ) In situ HLorey (m)
refinement of carbon-flux estimates,” Interciencia, vol. 20, no. 6, pp. 401-408, 1995.
[6] Q. Chen, “Retrieving vegetation height of forests and woodlands over mountainous areas in the Pacific Coast region using satellite laser altimetry,” Remote Sensing of Environment, vol. 114, pp. 1610-1627, 2010.
[7] L.I. Duncanson, K.O. Niemann and M.A. Wulder, “Estimating forest canopy height and terrain relief from GLAS waveform metrics. Remote Sensing of Environment,” vol. 114, pp. 138-154, 2010.
[8] D.J. Harding and C.C. Carabajal, “ICESat waveform measurements of within-footprint topographic relief and vegetation vertical structure,” Geophysical Research Letters, 32: L21S10, 2005. [9] C. Hilbert and Ch. Schmullius, “Influence of surface topography on ICESat/GLAS forest height estimation and waveform shape,” Remote Sensing, vol. 4, pp. 2210-2235, 2012.
[10] M.A. Lefsky, M. Keller, Y. Pang, P.B. de Camargo and M.O. Hunter, “Revised method for forest canopy height estimation from Geoscience Laser Altimeter System waveform,” Journal of Applied Remote Sensing, vol. 1, pp. 1-18, 2007.
[11] M.A. Lefsky, D.J. Harding, M. Keller, W.B. Cohen, C.C. Carabajal, F.D. Espirito-Santo, M.O. Hunter, R. de Oliveira and P.B. de Camargo, “Estimates of forest canopy height and aboveground biomass using lCESat,” Geophysical Research Letters, vol. 32, no. 22, pp. 1-4, 2005.
[12] R. Nelson, K.J. Ranson, G. Sun, D.S. Kimes, V. Kharuk & P. Montesano, “Estimating Siberian timber volume using MODIS and ICESat/GLAS,” Remote Sensing of Environment, vol. 113, pp. 691-701, 2009. [13] J.A.B. Rosette, P.R.J. North and J.C. Suarez, “Vegetation height estimates for a mixed temperate forest using satellite laser altimetry,” International Journal of Remote Sensing, vol. 29, no. 5, pp. 1475-1493, 2008.