HAL Id: hal-02867757
https://hal.archives-ouvertes.fr/hal-02867757
Submitted on 15 Jun 2020
HAL is a multi-disciplinary open access
archive for the deposit and dissemination of
sci-entific research documents, whether they are
pub-lished or not. The documents may come from
teaching and research institutions in France or
abroad, or from public or private research centers.
L’archive ouverte pluridisciplinaire HAL, est
destinée au dépôt et à la diffusion de documents
scientifiques de niveau recherche, publiés ou non,
émanant des établissements d’enseignement et de
recherche français ou étrangers, des laboratoires
publics ou privés.
Performance of topology-based data routing with regard
to radio connectivity in VANET
Chérifa Boucetta, Oumaya Baala, Kahina Ait Ali, Alexandre Caminada
To cite this version:
Chérifa Boucetta, Oumaya Baala, Kahina Ait Ali, Alexandre Caminada. Performance of
topology-based data routing with regard to radio connectivity in VANET. International Wireless
Communica-tions and Mobile Computing Conference, Jun 2019, Tangier, Morocco. �hal-02867757�
Performance of topology-based data routing with
regard to radio connectivity in VANET
Cherifa Boucetta
∗, Oumaya Baala
†, Kahina Ait Ali
‡and Alexandre Caminada
§∗LIPADE, University of Paris Descartes, Sorbonne Paris Cite, Paris, France †FEMTO-ST Institute, Univ. Bourgogne Franche-Comte, CNRS, Belfort, France
‡Orange Applications for Business, Belfort, France §I3S, University Nice Sophia Antipolis, France
Email: cherifa.boucetta@parisdescartes.fr, oumaya.baala@utbm.fr, kahina.aitali@orange.com, alexandre.caminada@utbm.fr
Abstract—Vehicular Ad hoc NETworks (VANETs) are char-acterized by the rapidly changing topology and then a fre-quent network disruption. Hence, connectivity of moving vehicles presents an important challenge that critically influences the data transmission. Furthermore, data delivery ratio depends on routing protocols, applications type as well as environment characteristics. As a matter of fact, real experimentation in vehicular networks are costly and hard to deploy especially on large scale. Consequently, a vehicular mobility simulator is a good compromise to study how efficient are the data transmission mechanisms. In this paper, we comprehensively study the impact of the radio connectivity on data communication in vehicular networks. The analysis were realized based on a vehicular mobility simulator which runs a realistic scenario of mobility traffic in a real urban environment. A simple scenario of a safety application was implemented to examine the behavior of three well-known topology-based routing protocols. For the purpose of the analysis, we varied the simulation setup such as the density and the data traffic rate to determine the impact of the connectivity. The simulation results show that a realistic modelling of radio propagation has an important role in data transmission.
Index Terms—VANET, connectivity graph, mobility modeling, routing protocols, radio propagation.
I. INTRODUCTION
Connected vehicular networks present the future trends for mobility applications and smart transportation in the future Intelligent Transportation Systems (ITS). Indeed, moving ve-hicles communicate and share traffic information in the aim of improving the efficiency of transportation system, the safety and the comfort of the users [1]. They offer a variety of services such as traffic lights management, traffic management, emergencies and accidents, Internet access, and sharing files, etc [3].
In Vehicular networks, continuous connectivity is a big chal-lenge due to vehicles dynamicity, unsteady networks topology and variable density of mobile nodes. In essence, the connec-tion between two vehicles may be interrupted several times during the transmission period which influences the process of exchanging messages between nodes [2]. Specially, in the case of safety applications, the radio connectivity becomes a critical criteria for data dissemination. Unfortunately, one of the major issues is to maintain connectivity and establish routing paths when transmitting data.
Several works have been conducted to address the connec-tivity of vehicular networks. The existing approaches focus on a detailed and accurate modeling of road topology and movement constraints. The authors of [4] considered an urban environment based a real city map for the extraction of the road topology. They defined distinct traffic flow condition to study the average node degree and the transmission range. [5] studies the impact of the road infrastructure, the driver’s behavior, and the dynamic traffic on the evolution of simulation tools. Giordani et all. [9] evaluated the coverage, connectivity and throughput performance in mmWave automotive networks. In the proposed model, vehicles exchange data with mmWave base stations deployed in both sides of a one-dimensional multi-lane highway. Authors in [8] studied the impact of the mobility model on vehicular network topology. They considered a simple grid road topology under various mo-bility models and then examined link duration and network clustering.
Another connectivity model of vehicular communication network was proposed in [10] based on the premise of an-alyzing the traffic on the road. Indeed, the authors assumed that the vehicles speed follows a normal distribution however the headway follows an Erlang distribution. Through the simulation, the optimum communication range was calculated aiming to achieve effective communications between vehicles. [11] proposes an heterogeneous traffic flow based on dual ring connectivity model to enhance both the message dissemination and network connectivity. During messages dissemination, slow speed vehicles are considered on the secondary ring and provide a backup path of communication for high speed vehicles forming the primary ring.
Existing models try to closely represent the movement of vehicles but they ignore the radio propagation which is strongly influenced by the characteristics of the environment. Furthermore, these models should be validated under real city map scenario and evaluated by routing protocols [6]. In this pa-per, we study the performances of topology-based data routing protocols considering a vehicular network connectivity model in a real urban environment. Unlike the previous mentioned models which define the communication range by a simple circle around the transmitter, we use a propagation model that includes the obstacles effect on radio signals. In essence, we
use a C++ GIS (Geographic Information System) application to visualize the connectivity graph. This application represents the city of Belfort in the northeastern France and is imple-mented by our team. We examine then, the behavior of existing topology-based routing protocols, AODV (Ad-hoc On-demand Distance Vector) [12], DSR (Dynamic Source Routing) [14] and OLSR (Optimized Link State Routing Protocol) [13] at different vehicular densities and data traffic rates. The objective is to show that the validity of simulation results depends on the ability of the models to reproduce real-world scenarios. The issued results reflect a real-world environment, a real mobility traffic and obstacles effect.
The rest of this paper is organized as follows: In section II, we briefly describe the mobility model and the propa-gation model proposed in our previous works. We visualize these models under a realistic city map and we determine the connectivity graph. Then, we study the impact of radio connectivity on data dissemination in vehicular network by evaluating topology-based routing protocols. Simulation en-vironment and results are presented in section III. Finally, section IV concludes the paper.
II. CONNECTIVITYGRAPH
One of the notoriously difficult problems in vehicular net-works is to ensure that established routing paths do not break before the end of data transmission. Therefore, it is important to consider a real city map with its terrain characteristics and urban infrastructures.
Fig. 1: Modular architecture for the radio connectivity analysis
The proposed connectivity model is based on a four-module architecture as shown in Figure 1 and described hereafter. The data of each module, except for the radio propagation module, are generated periodically every t seconds (t = 2seconds). Then, this model is tested and evaluated under the application which represents the city of Belfort. In order to reproduce the real environment, the considered city map is divided into equally sized cells. Several data were used to define an attraction weight for each cell including GIS shape files that give the altitude and the type of structure located in the cell and socio-economical information that presents the ability of a cell to attract vehicles. Both mobility and propagation models are based on this grid and consider the attraction information.
A. Mobility module: V-MBMM
The first module, Mobility Module, aims to determine the periodic position of each vehicle in the simulated environment. The result is a file that associates each vehicle with a vector of positions, every t seconds according to the trajectory. This data is used as input to the connectivity graphs module. The mobility model implemented in this module is called V-MBMM (Vehicular Mask-based Mobility Model) [7].
V-MBMM simulates vehicles displacement in urban envi-ronments [16]. The road topology graph is extracted from the real city map where edges correspond to road segments and vertices connect two or more segments. The weight of roads is defined based on their attraction to drivers which is determined based on survey data and urban infrastructures. The attraction coefficient is applied to a Markov chain aiming to make the displacements more realistic.
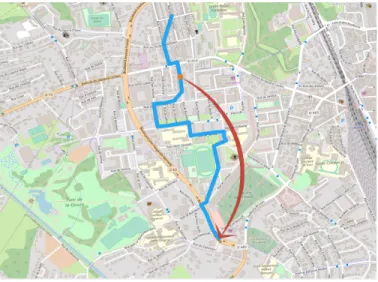
Three key parameters are used in the mobility model: the cell altitude, the type of structure located in each cell and the cell attraction power for vehicles. V-MBMM is studied under the city map of Belfort and the mobility and has been integrated to the C++ application in order to visualize the movement of vehicles. Figure 2 shows an example of the trajectory displacement of one vehicle on the subarea of the map of Belfort downtown.
Fig. 2: Trajectory of a vehicle
B. Radio propagation model: V-PROPAG
The radio propagation module calculates the radio cov-erage area of each vehicle in the network. In this module, two models of radio propagation are implemented: Two-Ray Ground (TRG) the most commonly used model which represents the coverage area of the vehicle by a perfect circle and V-PROPAG (Vehicular Radio Propagation Model) [15] that considers the density of obstacles and the characteristics of the environment (building, forest, mountain...). Hence, V-PROPAG defines three terrain categories used to calculate the signal power of the transmitting and receiving antennas. The first category has the maximum path loss values and
corresponds to a hilly terrain with moderate-to-heavy trees densities. The second category is characterized as either hilly terrain with light tree densities or flat terrain with moderate-to-heavy trees densities and the last category considers a flat terrain with light tree densities and presents the lowest path loss values.
The propagation model parameters are calibrated based on the physical layer characteristics defined in the standard 802.11p which is used in inter-vehicular communication.
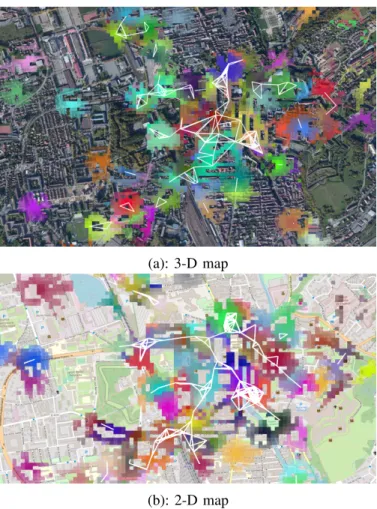
(a): 3-D map
(b): 2-D map
Fig. 3: Coverage area and connectivity graph at time t
As defined in the mobility model and based on the grid cells, the radio connectivity is presented by an undirected graph denoted G(V, E, t) generated every t seconds where V is the set vehicles and E is the set of edges that connect vehicles. For example, if a given vehicle k is in the transmission range of vehicle l or vice-versa, the two vertices vkand vlare connected
by the edge ekl.
Figure 3 shows an example of a connectivity graph vi-sualzed under the C++ application and obtained with 100 vehicles at a given time t. It shows the signal propagation of each antenna calculated by V-PROPAG model, each color corresponds to a vehicle coverage area. The radio connectivity graph is visualized under 3-D and 2-D maps (figures 3(a) and 3(b) respectively).
C. Use case: Dissemination of alert message
The connectivity graph is useful in a large variety of applications such as traffic control or safety application. So that, we can study the influence of connectivity modeling on the data dissemination. In the scenario hereafter, we consider a notification or a warning message in case of road congestion.
Fig. 4: Message dissemination
Figure 4 represents a use case of a traffic control application that disseminates three alert messages and associates one color per message (red, orange and purple). Vehicles with dark colors correspond to source nodes, each one transmitting the message in his neighborhood. In this scenario, the simulation represents a 3-hop propagation. The objective is to disseminate the messages with a delay not exceeding a predefined time which corresponds to the time to live of the message, and a distance below a given range.
III. STUDY OF ROUTING PROTOCOLS: SIMULATIONS AND RESULTS
In the following, we study the radio connectivity in realistic city environment and we evaluate the influence of obstacles on routing information in vehicular networks. To do this, the performance of exiting topology-based routing protocols AODV, DSR and OLSR are evaluated in the context of V-MBMM and V-PROPAG models. We consider two metrics: the packet loss ratio and the percentage of discovered routes. We present and discuss different results hereafter.
We use the previous models V-MBMM to simulate the vehicles’ mobility and V-PROPAG to simulate the radio prop-agation for each vehicle’s antenna. These two models have been integrated into ns-2 simulator to form a complete VANET simulator. The simulator architecture is shown in Figure 5.
The V-MBMM model code has been extended to generate mobility traces compatible with ns-2. The traces are pre-calculated and used as input data for ns-2 to determine the nodes positions and movements. Whereas, the V-PROPAG model uses as input the data of the terrain categories to calculate the attenuation of the signals.
In this study, the mobility is simulated on a 2000m×2000m area for a time period between twelve and twelve fifteen pm
Fig. 5: Architecture of the VANET simulator
and a density of 100, 150 and 200 vehicles. The path loss is calculated for road cells considering obstacles between trans-mitters and receivers, even outside the roads. The number of data traffic sources is varied from 5% to 20%. The transmitted data is of CBR (Constant Bit Rate) type to evaluate the packet delivery ratio and the discovered routes ratio for different routing protocols.
A. Simulation Parameters
The simulation tests were executed on a limited zone from Belfort downtown and considering TRG and V-PROPAG prop-agation models. Two series of experiments were conducted where we varied the density of vehicles and the number of data traffic sources. The duration of each scenario is 300s. The parameters are summarized in Table I.
The setup parameters of both propagation models are given in Table II. TRG represents the transmission range of each ve-hicle by a circle of 200m radius. The second one, V-PROPAG model, considers the obstacles effect on radio signals. We have kept the default values of the 802.11p standard as specified in ns-2.
TABLE I: Simulation parameters
Parameter Value Simulations duration 300s
Area size 2000m × 2000m Number of vehicles 100, 150 and 200 Number of CBR sources 5%, 10%, 15% and 20% of nodes.
Inter packet arrival time 0.5s Packets size 512 bytes OLSR HELLO interval 2s
OLSR TC interval 5s
TABLE II: Simulation parameters of propagation models
Parameter Value Frequency 5.9Ghz Sensibility -85dbm 802.11p(PHY/MAC) Emission power 0.001mW
Bandwidth 10Mhz Propagation model TRG
Frequency 5.9Ghz Sensibility -77dbm V-PROPAG Antenna gain 2dBi
Antenna height 1.5m Emission power 23 dBm
B. Simulation analysis
Our study focuses on two metrics: the packet delivery ratio and the discovered routes ratio.
1) Packet loss ratio: Packet loss is the ratio between the transmitted and the received packets. It is the most representa-tive parameter of the effecrepresenta-tiveness of a routing protocol: The higher the percentage of this metric, the more privileged is the routing protocol. We analyze the causes of data loss in the network to better understand the behavior of each protocol and identify the most appropriate routing protocol for vehicular networks. Four factors are primarily responsible for the loss of data packets:
1) The route to the destination is not known. In this case, the problem may be related to the inability of the routing protocol to find a route before the end of the data time to live.
2) Failure to transmit at channel access level due to colli-sions and multiple simultaneous transmiscolli-sions.
3) Overtaking of the buffering capacity because routes are not yet discovered.
4) The length of the road exceeds the maximum hop number that a packet can cross.
The analysis of the traces generated by the simulator highlights two main causes of data packet loss in vehicular networks which are: (i) the route to the destination is unknown, denoted NRTE (No RouTE), and (ii) the buffer overtaking capacity, denoted IFQ (InterFace Queue). We can observe that OLSR data packets are directly forwarded if the routing table contains a route to the destination or deleted otherwise. As a result, only NRTE is the main cause of loss of data packets. The average values obtained for all the scenarios are calculated for both TRG and V-PROPAG and are presented in Table III. It is clear that the packets loss ratio of every protocol is higher with TRG compared to V-PROPAG. This is because, TRG models the transmission range by an ideal circle and then, considers wrongly a better network connectivity. Con-sequently, TRG offers more probability to establish multi-hop communications. However, V-PROPAG captures obstacles effect on radio signals resulting in less connectivity.
TABLE III: Packet loss Ratio
TRG V-PROPAG AODV DSR OLSR AODV DSR OLSR NRTE 70% 8% 90% 75% 4% 94%
IFQ 19% 82% - 22% 87%
-Comparing the results of AODV with those of DSR, we can see that the packet loss in AODV is mainly due to NRTE and in DSR to IFQ for both propagation models. This is related to the behavior of each protocol and the failure in the route discovery process. In fact, in AODV, a source vehicle that does not receive a response to a route request after a period of time, initiates two more attempts by re-transmitting a RREQ message. In case of failure after three attempts, the source deduces the failure of route discovery (NRTE) and deletes all data packets. After a period of time, it re-executes the
route discovery procedure. IFQ is declared by the node if the RREQ queuing reaches its maximum capacity. The used queuing management is FIFO (First In First Out).
In DSR if no route is discovered after three attempts, the node does not delete the data but keep them in the queue and periodically checks if during the last routing table updates a route to the destination has been defined. In this case, packets will be sent successively and will be removed only if the queuing capacity reaches its maximum capacity, the source declares then, IFQ as a cause of loss. Node deduces NRTE only if it restarts a route discovery procedure and it fails. In both protocols, the NRTEs may also be declared by the intermediate nodes due to the failure of the road repair procedure.
2) Discovered routes: We analyze now the connectivity conditions to find out routes to destinations and determine the ratio of discovered routes. The results obtained with V-PROPAG and TRG are represented by Figures 6, 7 and 8 for vehicles density between 100 and 200. The measured route rate values show that the propagation model has an impact on routing protocols.
The results depict that the connectivity in the network is always better with TRG which is an optimistic model that assumes ideal for propagation. In particular for a low vehicle density, the rate of discovered routes increases (goes from 40% up to 80% with 100 vehicles). For 200 vehicles, the rates are about 100% with AODV and 90% with OLSR.
Using V-PROPAG model, it is clear that in low density (100 vehicles) and low data traffic (5% and 10% of nodes are data sources), AODV finds more routes followed by DSR then OLSR. In AODV and DSR being reactive protocols, nodes build routes based on topology information which are more up-to-date compared to OLSR where the exchange of information is periodic. The validity of the routes in OLSR depends on the values assigned to the frequencies of HELLO and topology control (TC) messages. In addition, since network connectivity is weak, TC packets are not propagated enough throughout the network.
Since OLSR is based on a proactive approach, it has the lowest rates. The results of AODV and DSR are almost identical. Comparing AODV with DSR, AODV finds more routes thanks to its dynamic mechanism for calculating routes step by step.
Compared to the results obtained with V-PROPAG, the discovered routes rates of AODV and OLSR with TRG are higher in all scenarios. DSR has better rates than OLSR only with a density of 100 vehicles because of the priority given to the packets RREQ. However, with 150 and 200 vehicles, DSR loses this priority and control packets become the cause of the performance degradation. The network connectivity is better however the number of re-transmissions of the RREQ packets causes network saturation which prevents the discovery of efficient routes.
With a higher data traffic, OLSR has the lowest rates for the same reasons as previously and the rates obtained with DSR are slightly higher than those of AODV. This is because
DSR gives a higher priority to control packets. In addition, with the number of data source, RREQ and RREP packets are more transmitted in the network. This allows nodes to have a better knowledge about the topology and thus discover more routes. In the case of medium and high density networks, the connectivity is better and more steady routes are discovered by the three protocols.
The key observation from this analysis is that in real-world environment with obstacles and traffic scenarios for mobility the results highlight the impact of the radio propagation models on the simulation. For example, with the TRG model, DSR has the lowest receiving rates and with V-PROPAG, it records the best rates.
IV. CONCLUSION
In this paper, we evaluated the performance of radio con-nectivity and its impact on different routing protocols over vehicular networks in urban environment. The analysis was realized with a network simulator that exploits the traces provided by a mobility model, V-MBMM, and a propagation model, V-PROPAG. The two models are tested and presented under a GIS application written in C++ which represents the city of Belfort in the northeastern France. The evaluation of the impact of radio connectivity was performed under two propagation models: the first one is optimistic, TRG, and assumes an unobstructed flat environment and the second one is V-PROPAG, which reflects environment characteristics by defining three terrain categories according to obstacles density. Then, three popular topology-based routing protocols were selected for the evaluation: two reactive (AODV, DSR) and one proactive (OLSR). We tested these protocols against node density and data traffic rate. We studied the impact of radio connectivity in terms of packet loss and rate of discovered routes. The results showed that the model reflects well the impact of obstacles present in the real environment on the radio waves. Through these results, we can say that proactive protocols are not suitable for vehicular networks. This is because, the routing table maintained by the vehicles when exchanging periodic topology information quickly becomes obsolete.
The study of the performance of topology-based routing protocols was an interesting first step of our approach. Indeed, this class of protocols may seem inappropriate for inter-vehicle communications, but their study has identified radio links properties and operation mechanisms to best respond to challenges in VANET. In further work, we plan to include hybrid criteria that is geographical forwarding or store-carry and forward as they are more suited to frequent network dis-connections. We also envisage a hybrid architecture containing vehicles and UAVs (Unmanned Aerial Vehicles).
REFERENCES
[1] N. Lu, N. Cheng, N. Zhang, X. Shen, and J. W. Mark, ”Connected vehicles: Solutions and challenges”, IEEE Internet Things Journal, vol. 1, no. 4, pp.289-299, August 2014.
[2] F. D. Cunha, L. Villas, A. Boukerche, G. Maia, A. C. Viana, et al. ”Data Communication in VANETs: Survey, Applications and Challenges”. Ad Hoc Networks, Elsevier, 2016, 44, pp.90-103.
(a) AODV (b) OLSR (c) DSR
Fig. 6: Discovered routes ratio for 100 vehicles: V-PROPAG vs TRG
(a) AODV (b) OLSR (c) DSR
Fig. 7: Discovered routes ratio for 150 vehicles: V-PROPAG vs TRG
(a) AODV (b) OLSR (c) DSR
Fig. 8: Discovered routes ratio for 200 vehicles: V-PROPAG vs TRG
[3] Z. Abdennoura, J. Weijia, ”Heterogeneous vehicular communications: A comprehensive study Author links open overlay panel”, Ad Hoc Networks, Elsevier, Vol. 7576, June 2018, pp. 52-79.
[4] H. Conceio M. Ferreira and J. Barros, ”On the Urban Connectivity of Vehicular Sensor Networks”, Proc. 4th IEEE International Conference on Distributed Computing in Sensor Systems (DCOSS’08), pp 112-125, Greece, June, 2008.
[5] P. Manzoni, M. Fiore, S. Uppoor, FJ. M. Domnguez, CM. Tavares De Araujo Cesariny Calafate, JC. Cano Escrib, ”Mobility Models for Vehicular Communications”, Vehicular ad hoc Networks. Standards, Solutions, and Research, Springer, pp. 309-333, 2015.
[6] R. Brendha, V. S. J. Prakash, ”A survey on routing protocols for vehicular Ad Hoc networks”, Advanced Computing and Communication Systems (ICACCS), 4th International Conference on, India, January 2017.
[7] K. Ait Ali, M. Lalam, L. Moalic and O. Baala, ”On the Spatiotemporal Traffic Variation in Vehicle Mobility Modeling”, IEEE Trans. Vehicular Technology, vol. 64, No. 2, pp. 652–667, 2015.
[8] M. Fiore and J. Hrri, The Networking Shape of Vehicular Mobility, Proc of ACM MobiHoc, pp. 261-272, China, May 2008.
[9] M. Giordani; M. Rebato, A. Zanella, M. Zorzi, ”Coverage and connectiv-ity analysis of millimeter wave vehicular networks”, Ad Hoc Networks, vol. 80, pp. 158-171, 2018.
[10] H. Zhao, S. Chen, D. Li and H. Zhu, ”The establishment of the network connectivity model in VANET,” 2016 8th International Conference on
Wireless Communications & Signal Processing (WCSP), Yangzhou, 2016.
[11] T. Umer, M.K. Afzal, E.U. Munir et al., ”A Dual Ring Connectivity Model for VANET Under Heterogeneous Traffic Flow”, Wireless Per-sonal Communications. , Vol. 98, No. 1, pp 105118, January 2018. [12] C. Perkins, E. Belding-Royer, S. Das, ”Ad hoc On-Demand Distance
Vector (AODV) Routing”, RFC 3561, July 2003.
[13] D. Johnson, D. A. Maltz, Y.-C. Hu, ”The Dynamic Source Routing Protocol for Mobile Ad Hoc Networks (DSR)”, IETF Internet Draft, work in progress, draft-ietf-manet-dsr-09.txt, April 2003.
[14] T.H. Clausen and P. Jacquet, ”Optimized Link State Routing (OLSR)”, RFC 3626, October 2003.
[15] K. Ait Ali, O. Baala, A. Caminada, M. Lalam, ”Revisiting vehicular net-work connectivity with radio propagation model”. Telecommunication Systems, Vol. 52, No. 4, pp. 25852597, April 2013.
[16] O. Baala, C. Boucetta, K. Ait Ali, A. Caminada, ”More Insights Into Communication Issues in the Internet of Vehicles”, 15th International Symposium on Pervasive Systems, Algorithms and Networks, I-SPAN 2018, China, October 2018.