HAL Id: hal-01621501
https://hal.archives-ouvertes.fr/hal-01621501
Submitted on 23 Oct 2017
HAL is a multi-disciplinary open access archive for the deposit and dissemination of sci-entific research documents, whether they are pub-lished or not. The documents may come from teaching and research institutions in France or abroad, or from public or private research centers.
L’archive ouverte pluridisciplinaire HAL, est destinée au dépôt et à la diffusion de documents scientifiques de niveau recherche, publiés ou non, émanant des établissements d’enseignement et de recherche français ou étrangers, des laboratoires publics ou privés.
MODELLING: A CASE STUDY ON THE CITY OF
OUAGADOUGOU
Christophe Bouvier, Nanée Chahinian, Marko Adamovic, Claire Cassé, Anne
Crespy, Agnès Crès, Matias Alcoba
To cite this version:
Christophe Bouvier, Nanée Chahinian, Marko Adamovic, Claire Cassé, Anne Crespy, et al.. LARGE-SCALE GIS-BASED URBAN FLOOD MODELLING: A CASE STUDY ON THE CITY OF OUA-GADOUGOU. SimHydro2017, Jun 2017, Sophia-Antipolis, France. �hal-01621501�
LARGE-SCALE GIS-BASED URBAN FLOOD MODELLING: A CASE
STUDY ON THE CITY OF OUAGADOUGOU.
Christophe Bouvier1,*, Nanée Chahinian1, Marko Adamovic1, Claire Cassé2, Anne Crespy1, Agnès Crès1, Matias Alcoba2
1
IRD, UMR HydroSciences Montpellier, 163 rue Auguste Broussonnet CC 57, 34090 Montpellier, France 2
IRD, UMR Géosciences Environnement Toulouse (GET), 14 Avenue Edouard Belin, 31400 Toulouse Toulouse, France
christophe.bouvier@ird.fr, nanee.chahinian@ird.fr, marko.adamovic@hotmail.com, anne.crespy@ird.fr, acres@msem.univ-montp2.fr, claire.casse@get.obs-mip.fr, matias.alcoba@get.omp.eu
KEY WORDS
Flood risks, GIS-based modelling, ATHYS, Urban hydrology, African cities.
ABSTRACT
African cities are prone to recurrent flooding due to unfavorable rainfall conditions, often insufficient drainage infrastructure and fast and poorly controlled urban development. It is thus important to put forward efficient tools to characterize flooding and its consequences over large urban areas, e.g. the entire agglomeration. However, scarce data and long computation time limit the use of classic hydraulic models in such cases and require to propose alternative models. Therefore a GIS-based urban flood model is proposed as a case study in the city of Ouagadougou (Burkina Faso), in order to produce flood mapping at small spatial resolution over the entire conglomeration. Spatial discretization is done using a Digital Terrain Model (DTM) forced by various obstacles (urban blocks) or drainage axis (roads or water collectors). The mesh size is set to 10m to get a good representation of the urban objects and drainage directions. Runoff at the cell scale is calculated using an SCS model, within parameters are linked to the density of the built-up areas and to the type of soil. Runoff is first routed with a Lag and Route model over 1057 catchments which drain nearly 10 ha. The velocity of the model derives from a geomorphological formula involving the slope and the upstream area of each cell. Runoff is then routed in the main hydrological network (i.e. streets and channels) with a Kinematic Wave model. The dimensions of the cross-sections derive from a geomorphological formula, involving slope and upstream areas of the cells. An example of flooded areas is shown, as an application of the models over the entire conglomeration. The model strength resides in its quick implementation at large scale using easily accessible data, and in a fast computation time. The model appears as a valuable tool for decision-makers, real time forecasting and infrastructures management. This modelling approach may be complemented by finer, local scale models which may use the computed fluxes as boundary conditions.
1. INTRODUCTION
Urban growth is an ongoing trend, regardless of economic growth [Burns et al., 2005] [ Poelhekke, 2011][ Maksimovic, 2003] : by 2050 70% of the world population will be living in urban areas [ Maksimovic, 2003]. High urban growth and expansion rates have been reported for sub-Saharan African countries [Fox, 2012]. Socioeconomically disadvantaged people and groups, such as the poor and immigrants, are often consigned to more vulnerable locations [Uitto, 1998] i.e. with either poor infrastructure or a higher exposure to natural hazards. The combination of higher vulnerability and exposure results in disasters of greater magnitude which can only worsen as the number of extreme events (i.e. natural hazards) increase because of global change. Burkina Faso is no exception to this rule. Over the last decade the country had to face
1
recurring floods (in 2009, 2012 and 2016) which left tens of thousands of people homeless [ Karim et al., 2016]: The great flood of 2009 alone, during which 263 mm of water poured over the capital city of Ouagadougou within 12 hours, caused 8 deaths and more than 10 million Euros worth of damages [Janvier et al., 2007]. The city had no early warning system at that time.
Modelling of urban floods is not a straightforward task. The heterogeneity in land use and the presence of preferential flow directions due to man-made structures such as buildings and roads request an appropriate representation of these objects in the model. Sewer systems also need to be included in the model as their influence on overland flow is well documented [Leandro et al., 2016][Fletcher et al., 2013]. However, a detailed description of these objects leads to high calculation times rendering any real-time flood forecasting effort very challenging. The general limits of urban models are the oversimplification of reality, scaling, over parameterization. [Bertrand-Krajewski, 2010] and [O’Loughlin et al., 1996] also note incompatibility problems due to models that are often developed independently and at different spatial scales. They also highlight insufficient and at times erroneous data.
Some authors have attempted to use hybrid models combining hydrological and hydrodynamic modules [ Bellos and Tsakiris, 2016]. Others have used models that were conceived to give a thorough representation of storm water and wastewater dynamics [Petrucci and Bonhomme, 2014],[Zarriello, 1998] and some have resorted to more « process based » models [Rodriguez et al., 2005] (see a review in [Elliot and Trowsdale, 2007] and [Zoppou, 2001]). However, using these models at the scale of large urban conglomerations is often cumbersome.
The objective of this work is to present an operational method that allows the characterization of the urban hydrological fluxes based on DEMs. The method is quick and easy to implement, fully automated and produces detailed results on large areas with low calculation times. This would be the first building block of an early flood warning system. The method is tested on the city of Ouagadougou (Burkina Faso).
2. MATERIALS AND METHODS
2.1 The study site
The study site is the urban catchment corresponding to the conglomerate of Ouagadougou (Fig. 1), a densely populated city with 1915102 inhabitants reported in 2012 [DGESS, 2014] for an area of 2805 km². The urban landscape consists of housing blocks often surrounded by a 1,5 m tall wall with one or two openings on to the street network [Hingray et al., 2000a]. The storm water collection network is composed mostly of concrete, open-air canals and is denser in the city centre than in the outskirts. The uncovered gutters tend to be used as waste disposal grounds [Nikiema, 2007] and the network drainage capacity is often reduced because of clogging by litter. The river Massili crosses the city to the east and three dams named Ouaga 1, 2 and 3 are located in the northern part of the city. The general topography is flat, with elevations ranging between 274 m.a.s.l and 340 m.a.s.l. The dominant soil types are leached ferruginous soils, row mineral soils, hydromorphic soils and solonetz, and all have poor drainage capacity. The combination of all these factors transforms heavy rains into disastrous floods. Ouagadougou is located in the north-soudanian climatic zone and has a single rainy season from May to September. Rainfall events are caused by Mesoscale Convective Systems (MCS) which produce intense and heterogenic rainfall in time and space. The annual rainfall mean recorded over the 2005-2015 period is of 880,5 mm [DGESS, 2014]. No monitoring data is available at the scale of the entire conglomerate, but four small sub-catchments have been monitored by the ORSTOM (Office of Scientific and Technical Research Overseas-currently IRD) from 1977 to 1979 and from 1992 to 1993. Their main characteristics are summarized in table 1. In addition, as part of the Raincell project, a network of 12 tipping-bucket raingauges has been deployed on the catchment by IRD in 2016. A heavy rainfall event was recorded on the 09/08/2016. Rainfall amounts ranged from 43 to 141 mm during 4 hours. The local return period of this event ranges from less than 1 year to more than 50 years [Le Barbé, 1982]. This event is used for flooding simulation over the entire city of Ouagadougou.
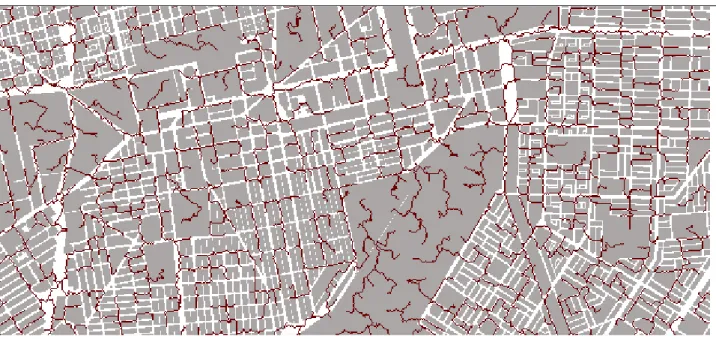
Figure 1. Partial view of the conglomerate of Ouagadougou : built-up areas (in brown) were used to force the natural flow paths. Large zones in white are natural areas. The main channels are located along the widest roads
Catchment Period Lat. (N) Long. (W) Number
events Area (ha) IMP (%) I (m/km) Pmax (mm) St Julien 1979 12°21’44” 1°32’10” 21 48 10 10.5 39 Rue Destenave 1979 12°22’09 1°31’06” 24 173 25 6.9 39 Wemtenga UP 1992-1993 12°21'51" 1°28'41" 23 330 6 10.5 45 Wemtenga DW 1992-1993 12°22'33" 1°28'46" 31 826 10 11 45
Table 1. Main characteristics of the experimental catchments. IMP : built-up area coefficient, I : slope, Pmax : maximal rainfall event during the observation period
2.2 The model
The selected model is part of the ATHYS modelling platform www.athys-soft.org [Bouvier et al., 2010] which has already proved its adaptability to urban settings [Lhomme et al., 2006] and has been further tested on three districts of Ouagadougou [Hingray et al., 2000b]. The main principles of the model are : 1/ building a regular grid of cells for the whole city, including upstream natural or peri-urban catchments.
The cells must be documented in terms of drainage direction, slope, cross-section, land use or soil type according to the type of runoff or routing model that will be used for the cell. The drainage directions are the basic data to get for each cell, and they are calculated using a DEM and extraction procedure of ATHYS. In this application, the Shuttle Radar Topography Mission (SRTM) DEM with 1 arc-second resolution (approximatively 30m) was first resampled at 10m in the UTM projection. Then raster maps of the housing blocks and the storm water network were used to modify the natural flow paths generated using the DME (Fig.2). The built-up areas’ elevation was increased by 10m to mimic their imperviousness to flow and force the drainage directions.
Figure 2. Hydrological streams considered as cells that drain more than 1ha, after being forced by the built-up areas. Note that the flow paths are not forced within a built-built-up area.
2/ interpolating rainfall or other hydro-meteorological data for each cell, at a constant time step (e.g. 5 mn). Rainfall may be provided by local rain gauges or through spatialized monitoring products (radar, satellite, commercial microwave links). Spatial interpolation at the cell scale is performed using the nearest neighbor (Thiessen) method or inverse distance weighting.
3/ using a model to estimate the production of the cell. Different (SCS, Green&Ampt, TopModel, Horton or combinations of reservoirs) models and parameters may be used for each cell based on soil type, land use, built-up areas. However, when information is scarce, it is recommended to use reasonable spatialization of the models and parameters. In this paper, a simple time-derived SCS runoff model has been used, using one parameter S (the maximal water retention of the soil) :
𝑃𝑒(𝑡) = (2 −
𝑃(𝑡)−0.2𝑆𝑃(𝑡)+0.8𝑆) (
𝑃(𝑡)−0.2𝑆𝑃(𝑡)+0.8𝑆)
(1)where Pe(t) denotes the runoff which is produced by the cell at the time t, P(t) the amount of rainfall since
the beginning of the event.
4/ routing the cell production over the whole city. Two routing models can be used:
- a lag and route model for the cells of natural or peri-urban sub-catchments : The main interest of the model is to shorten the computation time in areas which are not subject to flooding hazard. Each cell m produces an elementary hydrograph :
𝑄𝑚(𝑡) = 𝐴. ∫
t𝑡−𝑇𝑚𝑃𝑒(𝜏)𝐾𝑚.
0
𝑒𝑥𝑝 (−
𝑡−𝑇𝑚−𝜏
𝐾𝑚
) 𝑑𝜏
(2)where A is the cell area, Tm the route time, Km the lag time defined as : 𝑇𝑚 = ∑ 𝑉0
𝑙𝑘
𝑘 (3)
𝐾𝑚 = 𝐾𝑜. 𝑇𝑚 (4) where lk denotes the length of each cell k of the trajectory from the cell m to the outlet. In this case the model parameters are a velocity Vo and a diffusion coefficient Ko.
- the kinematic wave in the drainage network i.e. the streets, storm water network and natural river cells. The discharge is computed with the Manning-Strickler formula :
where Kr is the Strickler roughness coefficient, I the slope of the channel, Rh the hydraulic radius, Across the area of the cross-section. It was considered that cross-section had rectangular shape. The Strickler roughness coefficient Kr, the width W and depth D of the channels must be derived from local observations or measurements. When not available, they were considered as parameters to be calibrated.
Cross-sections can be composite, made for example of an open-air channel embedded within a road section, delimited by the walls surrounding the building blocks, a typical feature in Ouagadougou. In case of a rectangular composite cross-section, channel and road sub-sections have different widths (W and W2) and roughness coefficients (Kr and Kr2), while the road sub-section has infinite depth.
2.3 Sampling of cells
As computation time can be very large due the high number of 10m-cells, alternative simulations can be performed by sampling cells.
Cell sampling has been performed so that each sampled cell is the outlet of sub-catchments of equal area (Fig.3). The sampling rate can be one cell out of 2 (out of 5, out of 10 etc…) which will generate sub-catchments that are twice (5 times, 10 times etc…) larger than the elementary cell. The outlets of the sub catchments of equal area A are based on the difference of upstream areas between a couple of upstream-downstream elementary cells [Jenson and Domingue, 1988] : if the difference exceeds A, then the upstream elementary cell of the couple is sampled as the outlet of a sub-catchment of area A. Such sampling equates to sharing the whole area in sub-catchments of the same area. Due to this algorithm, the sampled cells are mostly located along the main hydrological streams, and they have stable and representative slopes, which do not generate any dependency of the simulations on the sampling rate. However, this algorithm is not actually able to design catchments that have the exact desired area, but are rather at least equal to this desired area. There is no consequence on the computation, but the number of sampled cells (i.e. sub-catchments) is generally 2 times higher than it should be.
Figure 3.Sampling of the cells that drain approximatively 1 ha (black circle), and the hydrological network derived from the forced DEM (cells that drain more than 10 cells upstream, i.e. 0.1 ha).
Sampling cells with the LR model consists in selecting the cells located in the center of squared blocks of NxN elementary cells. The area of each sampled cell is multiplied by NxN to respect the actual area of the
catchment, then the produced runoff is routed to the outlet of the catchment by using the elementary topology of the cells.
3. RESULTS
3.1 Model calibration
The calibration of the model was carried out using the rainfall-discharge data monitored by ORSTOM from 1977 to 1979 and 1992 to 1993 available for four small urban catchments (section 2.1). 20 to 30 flood events were recorded on each small catchment. The rainfall amounts of the events range from 10 to 40 mm, and have very short durations (< 3-4 h). There is no base flow contribution in the beginning of the events, due to the predominance of superficial runoff and the fast drainage over small areas. The median runoff coefficients are close to 50% for each catchment. They vary according to the rainfall amount or intensity, and the maximal values reach 70%. The response times of the catchments range from 20 to 50 mn, according to the catchment area.
The SCS-LR and SCS-KW models were both calibrated for each catchment : S and Vo were calibrated for each event for the LR model, and S and Kr for the KW model. For the LR model the Ko parameter has been preset to 0.7. For the KW model, cross-section widths and depths have been preset as W= 1m and D = 2m for the cells which drain more than 10ha, according to field observations. Overland flow (W>>) was assumed for the other cells. The slopes of the cells were set to 0.01 m.m-1 for the cells which drain less than 40ha, 0.003 m.m-1 for the cells which drain more than 40ha.
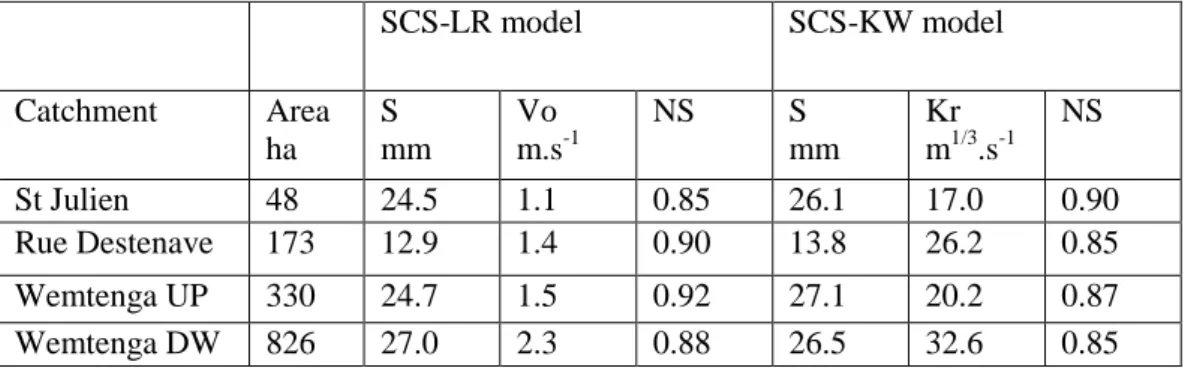
SCS-LR model SCS-KW model Catchment Area ha S mm Vo m.s-1 NS S mm Kr m1/3.s-1 NS St Julien 48 24.5 1.1 0.85 26.1 17.0 0.90 Rue Destenave 173 12.9 1.4 0.90 13.8 26.2 0.85 Wemtenga UP 330 24.7 1.5 0.92 27.1 20.2 0.87 Wemtenga DW 826 27.0 2.3 0.88 26.5 32.6 0.85
Table 2. Calibration of the SCS-LR and SCS-KW models : median values of the parameters and efficiency Our results indicate that (Tab.2, Fig.4) :
The median value of the S parameter of the SCS runoff model is quite stable between catchments, and around 25 mm; except in the Destenave catchment where rating curve errors could explain the lower value (13mm). The calibrated value is typical of the urban areas. However, in Ouagadougou where the density of built-up areas is low (~10% in most of the cases), this value is related to soils with very low infiltration rates, < 5 mm.h-1 after 10-20 mm of rainfall [Bouvier and Desbordes, 1990]. At the event scale, S ranged between 5 and 45 mm (5- 25 mm for Destenave), but no relationship with the antecedent rainfall amount or intensity could explain this variability which is thought to be related to the uncertainty on the rainfall data over the monitored catchments. Thus, a median value S=25 mm could be convenient for each catchment. In addition, S values are independent of the routing model, LR or KW.
The median value of the Vo parameter of the LR model increases with the catchment area. This undesirable scale effect was solved by considering a geomorphological formulation of the velocity, Vo = µ.I0.5.S0.2 , which gave acceptable results for all the catchments with a single value µ = 20 (unit 101.2.m-0.6.s). Median values of µ were 18.5, 23.8, 23.7, 21.2 for respectively St Julian, Destenave, upstream and downstream Wemtenga. At the event scale, µ ranges between 10 to 50. The variation may be due to the uncertainty on the time onset of the measurements (in the 70s and 80s, data recorders were operated manually, and uncertainty about the time onset could be some tenths of minutes). Thus, a median value µ = 20 is supposed to be convenient for all the events.
The median value of the Kr parameter for each catchment ranged between17 for the smallest catchment to 33 m1/3.s-1 for the largest one. Like Vo, this routing parameter undergoes a scaling effect, probably due to the fact that the cross-section dimensions (W=1, D=2 when A > 10ha) should increase with the upstream area. Nevertheless, it was not possible to find a uniform pattern of the cross-section dimensions in order to have a similar Kr for all the catchments, because of multiple possibilities in the choice of cross-section shapes, dimensions and roughnesses.
For each catchment, the Nash median values ranged between 0.85 and 0.93. The calibrated LR model scores slightly better than KW, except for the St Julien catchment.
Figure 4. S, µ, Kr and NS event values for the St Julian catchment. Left : SCS-LR model. Right : SCS-KW model
3.2 Flooding simulation
Using the heavy rainfall recorded on the 09/08/2016 a flooding simulation over the entire city of Ouagadougou was carried out. The simulation was performed in the following steps :
First, the whole conglomeration (including upstream natural catchments) was distributed into small catchments, in order to apply the SCS-LR on these units. A set of 1057 urban sub-catchments of approximately 10 ha was delimited (Fig.5). The SCS-LR model was then used with S = 25 mm and µ = 20, to provide an elementary hydrograph at the outlet of each sub-catchment.
0 5 10 15 20 25 30 35 40 45 0 0.1 0.2 0.3 0.4 0.5 0.6 0.7 0.8 0.9 1 1 2 3 4 5 6 7 8 9 10 11 12 13 14 15 16 17 18 19 20 21 22 S ( m m ), µ N ash N° event Nash S µ 0 5 10 15 20 25 30 35 40 0.00 0.50 1.00 1.50 2.00 2.50 1 2 3 4 5 6 7 8 9 10 11 12 13 14 15 16 17 18 19 20 21 22 S ( m m ), K r (m 1 /3 .s -1) N ash N° event Nash S Kr
Figure 5.Coupling the Lag and route model over the 10 ha sub-catchments (in color) to the Kinematic Wave over the cells that drain more than 10 ha i.e. the hydrological network (in white).
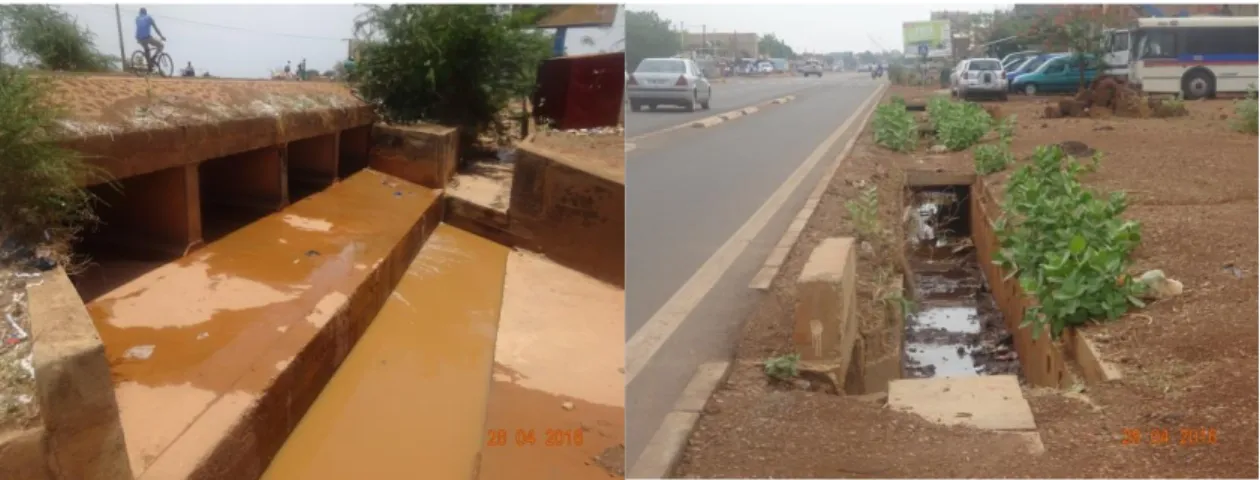
The SCS-KW model was then used to route the elementary hydrographs produced by the SCS-LR model through the hydrological network (roads, channels and natural streams). A geomorphological relationship W = I-0.25.A0.45 was drawn to link the width W (in m) of the (rectangular) cross-section to the slope of the cell, I in m.m-1, and the upstream area of the cell A (in km2). This relationship was derived from local observations of the main open-air channels in the city (Fig.6).
Figure 6.Open-air urban drainage channels in the city of Ouagadougou
The depths were uniformly considered as D = 1m. The Strickler roughness coefficient was set to Kr = 50 m1/3.s-1, based on the velocity measurements performed during the ORSTOM campaigns in 1979 and 1992. In case of overflow in the channel, the width of the road cross-section was set to W2 = 100m, and the Strickler roughness coefficient to Kr2 = 20 m
1/3
.s-1. The slopes of the cells were set to 0.01, 0.003 and 0.001 m.m-1 for the cells which drain respectively less than 0.4, 20 and 500 km2. The cells were sampled (using different rates : 1 out of 4, 25 and 100) either for the sub-catchments (LR) or for the streams (KW). The
comparison between the simulations is shown at the outlet of the larger catchment (BV1, 465 km2, Fig.7a ). It can be seen that sampling has little influence on the hydrographs, at least up to 1 out 25 sampling (Fig.7b). The selected dimensions of the cross-section at the outlet of BV1 : W = 19m, D = 1m, , Kr = 50 m1/3.s-1, W2=100m, Kr2 = 20 m
1/3
.s-1 can be considered realistic to the best of our knowledge. The simulated maximum discharge is around 600 m3.s-1, the maximal velocity is of 3.5 m.s-1, and the maximum water level reached 2.50 in the cross-section. More information is needed to validate the simulation, and local measurements have to be carried out in several locations in the city.
Figure 7. Hydrographs at the outlet of catchment BV1. Top : location of the outlet. Bottom : Hydrographs at the outlet of BV1. 0 100 200 300 400 500 600 700 800 09/08/16 10/08/16 Q , m3 /s 1 out of 4 sampled 1 out of 25 sampled 1 out of 100 sampled
Additional outputs of the model provide maps of either the maximal discharges, or velocities and water levels, for each stream cell of the city. The maximal discharges are presented in Fig.8. The flooded areas of the city can be derived from these values, by reporting the discharges with respect to the local cross-sections.
Figure 8. Maximal discharges in the entire agglomeration of Ouagadougou.
Short computation times are an absolute prerequisite for real-time forecasting and our model is able to satisfy this requirement. With 10m elementary cells, the computation time is more than 24 h for approximately 8,000,000 cells. This computation time is highly reduced when sampling : with one cell out of 100, it falls down to 5 mn, using a standard PC.
Several ideas are being considered in order to improve the simulations :
- the elevation estimations obtained though the SRTM DEM were not accurate to the expected level and this impacted also, drainage directions and slopes. We plan to use a SPOT7 DEM to improve them;
- as available observations for the model calibration mainly concern “traditional” urbanization, additional data are needed for other types of land use : denser built-up areas like commercial areas or recent housing developpments, but also bare or vegetalized soils in natural areas. Remote sensing from SPOT images may easily help to get a basic classification of such land use;
- multi-directional flows can occur in the branches of crossroads, and must be represented in the model. First attempts with a conceptual model based on angles, slopes and widths of the crossroad branches proved to be satisfactory [Lhomme et al., 2006]
- up to now, built-up areas have been considered productive areas of storm water runoff, but impermeable for the fluxes which exceed the channels’ capacity. Hydraulic exchanges between built-up areas and channel overflow in the roads do however exist, as shown by [Hingray et al., 2000b]. Vertical hydraulic porosity of the built-up areas will be brought into the model. Hydraulic exchanges will be simplified and based on the vertical porosity and the corresponding water levels in and out of the built-up areas [Hingray et al., 2000a].
4. CONCLUSIONS
A GIS-based flooding model was applied over the whole city scale of Ouagadougou. Due to scarce information about urban hydraulic characteristics, simplifications have been made to perform quick simulations of the flooding areas over the whole city. The minimum data required to run the model are the DEM, a basic map of the built-up areas and the storm water network, as well as geometric characteristics of the main channels. Model implementation based on a regular grid of cells is very quick, because it does not
need any topological aggregation. The main characteristics of the cells can be directly documented from easily accessible and open source data, such as the SRTM DEM, and city maps or satellite products on urbanized area location and density. The most difficult information to obtain is the stormwater network. In this case, geomorphological formulations of the dimensions of the channels can be substituted to the real information. Simulations have been performed with very small computation times, when sampling the cells working with the OC model, and/or coupling OC and LR models. The simulations were found to have low sensitivity to the sampling rate. Model parameters are in agreement with the values that can be expected in urban catchments. Fast model implementation and quick simulations highlight the usefulness of this method for urban flood management : real-time forecasting, flood design, impact of hydraulics works, tests of scenario about of the efficiency of the hydraulics works, depending of their location, dimensions, cleaning-up… Further work has to be carried out to ensure the validity of the simulations : additional measurements of discharges must be performed in the city; comparison of the simulations with the historical reports of the damages will also bring an interesting validation of the model. In addition, several improvements can be brought without excess in complexity. It is planned to introduce a multi-directional flow model to account for the crossroads. Hydraulic exchanges between flooding roads and neighboring built-up areas will also be more explicitly formulated. In its present form however, the proposed tool should be efficient for decision-making in real time or in infrastructure management. For more accurate purposes, this modelling approach may be complemented by finer, local scale models which may use the modelled fluxes as boundary conditions.
ACKNOWLEDGEMENTS
This work was funded by the World Bank, within the project referenced as Raincell-Ouagadougou. The authors thank Emmanuel Bonnet for supplying the built-up areas data.
REFERENCES AND CITATIONS
V. Bellos and G. Tsakiris, ‘A hybrid method for flood simulation in small catchments combining hydrodynamic and hydrological techniques’, J. Hydrol., vol. 540, pp. 331–339, 2016.
J.-L. Bertrand-Krajewski, ‘Stormwater pollutant loads modelling: epistemological aspects and case studies on the influence of field data sets on calibration and verification’, Water Sci. Technol., vol. 55, no. 4, p. 1 LP-17, Feb. 2007.
C. Bouvier Crespy, A., L’Aour-Dufour, A., Cres, F.N., Delclaux, F., Marchandise, A. and J. M. Tanguy, ‘Distributed hydrological modeling-The ATHYS platform’, in Modeling software , vol. 5, no. 5, J. M. Tanguy, Ed. ISTE Ltd and John Wiley & Sons Inc, 2010, pp. 83–100.
C. Bouvier, M. Desbordes. Un modèle de ruissellement urbain pour les villes d’Afrique de l’Ouest. Hydrologie Continentale, 5(2), 1990, 77-86
D. Burns Vitvar, T., McDonnell, J., Hassett, J., Duncan, J., Kendall, C., ‘Effects of suburban development on runoff generation in the Croton Rivier basin, New York, USA.’, Jounal Hydrol., vol. 311, pp. 266–281, 2005.
DGESS, ‘Annuaire statistique 2013’, Ministère de la santé, p. 350, 2014.
A. Elliot, S. Trowsdale, ‘A review of models for low impact urban stormwater drainage’, Environ. Model. C. Zoppou, ‘Review of urban storm water models’, Environ. Model. Softw., vol. 16, no. 2, pp. 195–231, 2001.
C. Maksimovic, ‘Urban drainage in specific climates’, Int. Hydrol. Program., vol. 3, no. 40, p. 158, 2001. S. Fox, ‘Urbanisation as a global historical process: theory and evidence from Sub Saharan Africa’, Popul.
T. Fletcher Andrieu, H., Hamel, P., ‘Understanding, management and modelling of urban hydrology and its consequences for receiving waters; a state of the art.’, Adv. Water Resour., vol. 51, pp. 261–279, 2013. A. Karim, A. P. Coordinator, D. R. Cross, G. R. Cross, R. C. Societies, and W. F. Programme, ‘Emergency Plan of Action ( EPoA ). Burkina Faso : floods’, 2016. [Online]. Available: http://adore.ifrc.org/Download.aspx?FileId=140892.
B. Hingray, Bouvier C., Desbordes M., Cappelaere B., ‘Inondations urbaines: un indicateur géométrique caractéristique du comportement hydraulique du bâti’, Rev. des Sci. l’Eau, vol. 13, no. 1, pp. 85–100, 2000a B. Janvier, B. Abdoulaye, D. Ouss, and B. Rigobert, ‘Space technology and management of the First September flood in Burkina Faso “ From Charter activation to rapid mapping “’, 2010.
Jenson S.K. and Domingue J. O., 1988. 'Extracting Topographic Structure from Digital Elevation Data for Geographic Information System Analysis'. PHOTOGRAMMETRIC ENGINEERING AND REMOTE SENSING, Vol. 54, No. 11, November 1988, pp. 1593-1600.
J. Leandro, A. Schumann, and A. Pfister, ‘A step towards considering the spatial heterogeneity of urban key features in urban hydrology flood modelling’, J. Hydrol., vol. 535, pp. 356–365, 2016.
L. Le Barbé. Etude du ruissellement urbain à Ouagadougou Essai d’interprétation théorique. Recherche d’une méthode d’évaluation de la distribution des débits de pointes de crues à l’exutoire des bassins urbains. Cahiers Orstom, série Hydrologie, 19(3), 1982, 135-202
J. Lhomme, C. Bouvier, E. Mignot, A. Paquier. ‘One dimensional GIS-based model compared with two-dimensional model in urban flood simulation’, Water Sci. Technol., vol. 54, no. 6–7, pp. 83–91, 2006.
B. Hingray, B. Cappelaere, C. Bouvier and M. Desbordes, ‘Hydraulic Vulnerability of Elementary Urban Cell’, 2000b
A. Nikiema, ‘Géographie d’une ville à travers la gestion des déchets Ouagadougou (Burkina Faso)’,
Mappemonde, vol. 87, no. 3, pp. 1–15, 2007.
G. O’Loughlin, W. Huber, and B. Chocat, ‘Rainfall-runoff processes and modelling’, J. Hydraul. Res., vol. 34, no. 6, pp. 733–751, 1996.
G. Petrucci and C. Bonhomme, ‘The dilemma of spatial representation for urban hydrology semi-distributed modelling: Trade-offs among complexity, calibration and geographical data’, J. Hydrol., vol. 517, pp. 997– 1007, 2014.
S. Poelhekke, ‘Urban growth and uninsured rural risk: Booming towns in bust times.’, J. Dev. Econ., vol. 96, pp. 461–475, 2011.
F. Rodriguez, F. Morena, H. Andrieu, ‘Development of a distributed hydrological model based on urban databanks--production processes of URBS’, Water Sci. Technol., vol. 52, no. 5, pp. 241–248, 2005.
J. I. Uitto, ‘The geography of disaster in megacities: A theoretical framework’, Appl. Geogr., vol. 18, no. 1, pp. 7–16, 1998.
P. Zarriello, ‘Comparison of Nine Uncalibrated Runoff Models to Observed Flows in Two Small Urban Watersheds’, in First Federal Interagency Hydrologic Modeling Conference, 1998, pp. 7–170.