HAL Id: inserm-02733222
https://www.hal.inserm.fr/inserm-02733222
Submitted on 2 Jun 2020
HAL is a multi-disciplinary open access
archive for the deposit and dissemination of
sci-entific research documents, whether they are
pub-lished or not. The documents may come from
teaching and research institutions in France or
abroad, or from public or private research centers.
L’archive ouverte pluridisciplinaire HAL, est
destinée au dépôt et à la diffusion de documents
scientifiques de niveau recherche, publiés ou non,
émanant des établissements d’enseignement et de
recherche français ou étrangers, des laboratoires
publics ou privés.
along dorsal ventral axis in the striatum
Emma Puighermanal, Laia Castell, Anna Esteve-Codina, Su Melser,
Konstantin Kaganovsky, Charleine Zussy, Jihane Boubaker-Vitre, Marta Gut,
Stéphanie Rialle, Christoph Kellendonk, et al.
To cite this version:
Emma Puighermanal, Laia Castell, Anna Esteve-Codina, Su Melser, Konstantin Kaganovsky, et al..
Functional and molecular heterogeneity of D2R neurons along dorsal ventral axis in the striatum.
Nature Communications, Nature Publishing Group, 2020, 11 (1), pp.1957.
�10.1038/s41467-020-15716-9�. �inserm-02733222�
Functional and molecular heterogeneity of D2R
neurons along dorsal ventral axis in the striatum
Emma Puighermanal
1,2
✉
, Laia Castell
1
, Anna Esteve-Codina
3
, Su Melser
4,5
, Konstantin Kaganovsky
6
,
Charleine Zussy
1
, Jihane Boubaker-Vitre
1
, Marta Gut
3,7
, Stephanie Rialle
1
, Christoph Kellendonk
8,9
,
Elisenda Sanz
2
, Albert Quintana
2
, Giovanni Marsicano
4,5
, Miquel Martin
1
, Marcelo Rubinstein
10,11,12
,
Jean-Antoine Girault
13,14,15
, Jun B. Ding
6
& Emmanuel Valjent
1
✉
Action control is a key brain function determining the survival of animals in their
environ-ment. In mammals, neurons expressing dopamine D2 receptors (D2R) in the dorsal striatum
(DS) and the nucleus accumbens (Acb) jointly but differentially contribute to the
fine
reg-ulation of movement. However, their region-speci
fic molecular features are presently
unknown. By combining RNAseq of striatal D2R neurons and histological analyses, we
identi
fied hundreds of novel region-specific molecular markers, which may serve as tools to
target selective subpopulations. As a proof of concept, we characterized the molecular
identity of a subcircuit de
fined by WFS1 neurons and evaluated multiple behavioral tasks after
its temporally-controlled deletion of D2R. Consequently, conditional D2R knockout mice
displayed a signi
ficant reduction in digging behavior and an exacerbated hyperlocomotor
response to amphetamine. Thus, targeted molecular analyses reveal an unforeseen
hetero-geneity in D2R-expressing striatal neuronal populations, underlying specific D2R’s functional
features in the control of specific motor behaviors.
https://doi.org/10.1038/s41467-020-15716-9
OPEN
1IGF, CNRS, INSERM, Université Montpellier, Montpellier, France.2Neuroscience Institute, Department of Cell Biology, Physiology and Immunology,
Autonomous University of Barcelona, Bellaterra, Spain.3Centre for Genomic Regulation, Barcelona Institute of Science and Technology, 08028 Barcelona, Spain.
4INSERM U1215, Neurocentre Magendie, Bordeaux, France.5Neurocentre Magendie, Université de Bordeaux, Bordeaux, France.6Department of Neurosurgery
and Department of Neurology and Neurological Sciences, Stanford University School of Medicine, Palo Alto, CA, USA.7Department of Experimental and Health
Sciences, Universitat Pompeu Fabra, 08003 Barcelona, Spain.8Departement of Psychology and Pharmacology, Columbia University, New York, NY, USA.
9Division of Molecular Therapeutics, New York State Psychiatric Institute, New York, NY, USA.10Instituto de Investigaciones en Ingeniería Genética y Biología
Molecular, CONICET, Buenos Aires, Argentina.11FCEN, Universidad de Buenos Aires, Buenos Aires, Argentina.12Department of Molecular and Integrative
Physiology, University of Michigan Medical School, Ann Arbor, MI, USA.13INSERM UMR-S 1270, Paris, France.14Faculty of Sciences, Sorbonne University,
Paris, France.15Institut du Fer à Moulin, Paris, France. ✉email:emma.puighermanal@gmail.com;emmanuel.valjent@igf.cnrs.fr
123456789
T
he striatum is the gateway to the basal ganglia, an ensemble
of subcortical structures involved in motor planning and
action selection
1. Striatal dysfunction has been associated
with multiple neurological and psychiatric disorders, including
Parkinson’s and Huntington’s disease, Tourette’s syndrome,
schizophrenia, autism, and addiction
2,3.
In the striatum, dopamine D2 receptors (D2R) have been
tightly linked to a wide variety of motor- and
reward/aversion-related behaviors. Pharmacological and genetic studies have
demonstrated a direct involvement of D2R neurons in a wide
range of functions including motor control
4–6, aversive learning
7,
addiction
8, compulsive food-intake
9, motivational aspects of
chronic pain
10, and risky decision-making
11. However, many of
these studies used optogenetic or chemogenetic approaches to
manipulate D2R neurons, but they did not assess the function of
D2R itself in these neurons. Imaging studies in humans and rats
have shown a significant reduction in striatal D2R availability in
subjects addicted to drugs such as cocaine, alcohol, heroin,
nicotine, and methamphetamine as well as in obesity
12. However,
the widespread expression of striatal D2R—which are present in
indirect pathway striatal projection neurons (iSPNs), cholinergic
interneurons (CINs), and presynaptically in both dopaminergic
and glutamatergic afferents—have impeded the interpretation of
many pharmacological and behavioral experiments. Our
under-standing of the complexity of striatal D2R expression pattern and
its associated function has recently increased with a study
reporting a relative heterogeneity of iSPN subpopulations
13. In
addition, the majority of studies that aimed to uncover the role of
D2R, by using either global or conditional D2R knockout mice,
could not rule out developmental compensatory adaptations from
deleting D2R early in life, since their genetic approaches were not
temporally controlled.
Given that the rodent striatum is divided into two regions, the
dorsal striatum (DS) and the nucleus accumbens (Acb), which
have distinct input–output organization and play different roles
in behavior
1,14, we
first aimed to identify DS- and Acb-specific
molecular markers, which may serve as tools to assess the role of
D2R in striatal subpopulations in adult mice. Therefore, we
performed RNAseq in DS and Acb D2R neurons separately
fol-lowed by histological analyses and revealed hundreds of
region-specific markers. As a proof of concept, we focused on a cell
subpopulation, identified by the expression of Wolfram syndrome
1 (Wfs1), displaying a specific expression pattern within the Acb.
Following the characterization of the molecular identity of WFS1
neurons, we evaluated the behavioral effect of temporally
con-trolled deletion of D2R from this neuronal subpopulation
(Wfs1-CreERT2:Drd2
loxP/loxPmice, hereafter named D2R-cKO). We
found that D2R-cKO mice displayed altered digging behavior and
an exacerbated hyperlocomotor response to amphetamine.
Together, our cell type- and region-specific high-throughput
analyses uncover previously unknown molecularly and
func-tionally defined subpopulations of D2R neurons and hence reveal
novel striatal subcircuits. As a proof of principle, the deletion of
D2R from one of these subpopulations identified, WFS1 SPNs,
revealed a novel D2R’s role in an innate behavior as well as in
response to a drug of abuse.
Results
Uncovering region-specific molecular markers of striatal D2R
neurons. To identify genes that are preferentially expressed in DS
and Acb D2R neurons, we generated D2-RiboTag mice
15, which
express the Cre-dependent ribosomal protein rpl22 tagged with
the hemagglutinin (HA) epitope exclusively in D2R cells (Fig.
1
a,
b). HA expression
—which was selective to iSPNs and CINs
16,
and homogeneously spread in both DS and Acb (Fig.
1
a, b and
Supplementary Fig. 1a)— enabled the immunoprecipitation of
ribosome-bound associated mRNAs selectively from D2R cells.
To validate the specificity of the mouse line, we used quantitative
reverse transcription PCR (qRT-PCR) to compare the relative
abundance of transcripts after HA-immunoprecipitation on
whole striatal extracts and the input fraction that contains
tran-scripts from all cell types (Supplementary Fig. 1b). As expected,
expression of iSPN markers (Drd2, Adora2, Penk1) was enriched
after HA-immunoprecipitation (Fig.
1
b). By contrast, gene
expression of markers for direct pathway SPNs (dSPNs) (Drd1,
Pdyn, Tac1), astrocytes (Gfap), microglia (Aif1), oligodendrocytes
(Cnp), as well as GABAergic interneuron-specific markers (Sst,
Calb2, Pvalb, Npy) were all decreased. No differences were
observed for Chat (only a fraction of CINs express D2R, see
below) and Th transcripts (Fig.
1
b).
To assess the overlap of DS and Acb D2R translatome profiles,
we performed high-throughput RNAseq of tagged
ribosome-bound mRNAs following dissection of the two regions
(Supple-mentary Fig. 1a and Supple(Supple-mentary Data 1). Principal component
analysis (PCA) revealed that mRNAs’ origin (ribosome-bound vs
total inputs) represented the main source of variance (81%), while
the origin of mRNA (DS vs Acb) accounted for 12% of total
variation in the data (Supplementary Fig. 2a). PCA showed that
the three replicates of each condition clustered together.
More-over, DS and Acb groups as well as the input and pellet fractions
were all well separated between them. Heatmap of
sample-to-sample distances confirmed that data were highly reproducible
and biological samples had low variability (Supplementary
Fig. 2b). We
first conducted parallel RNAseq of the inputs
(supernatant fraction containing mRNAs from all cell types)
and pellets (immunoprecipitation fraction containing tagged
ribosomes-bound mRNAs) to elucidate the genes that were
enriched in DS and Acb D2R cells (Fig.
1
c–f and Supplementary
Data 2). Using an adjusted p value of < 0.05, our analysis
identified 6201 D2R Acb- and 6253 D2R DS-enriched
protein-coding genes compared with Acb and DS inputs, respectively
(Fig.
1
c, e, Supplementary Fig. 3 and Supplementary Data 2).
Filtering these genes for a fold-change > 1.5, we narrowed down
this list of candidates to 2315 for the Acb and 2260 for the DS
(Fig.
1
d, f and Supplementary Data 2). Comparison of our
analysis with previous results from single-cell RNAseq data
13showed a match of ~80% of D2R-enriched mRNAs (Fig.
1
g
and Supplementary Data 2). After
filtering for redundancy, we
found that among the 6201 D2R Acb- and the 6253 D2R
DS-enriched genes, only 459 and 510 were exclusive to D2R cells
from Acb and DS, respectively, (Fig.
1
h and Supplementary
Data 2). We then broadened our analysis, without prefiltering the
pellets with the inputs, to capture all genes with DS–Acb
differential expression—regardless of their expression profiles
outside of D2R neurons (Fig.
1
i, j and Supplementary Data 2).
Hierarchical clustering of the top 50 differentially expressed genes
clearly separates the Acb and DS (Fig.
1
i and Supplementary
Data 2). Particularly, we found 2797 and 3884 protein-coding
gene products more expressed in the Acb and the DS,
respectively, (Fig.
1
i, j and Supplementary Data 2).
Genes preferentially expressed in DS D2R neurons. To identify
molecular markers that are preferentially expressed in the DS, we
analyzed genes that showed a significant dorso-ventral expression
bias in our high-throughput analysis. We found 3884
protein-coding genes preferentially expressed in the DS (Fig.
1
i and
Supplementary Data 2). Some of these genes include Trnp1,
Lpcat4, Kctd17, Trpc3, Ace, Dab2ip, Me2, Rgs4, Itga5, Coch,
Tbc1d8, Gpr155, Rasd2, Rgs7bp, Slc24a2, Kcnk2, Ddit4l, and Ccnd2
qRT-PCR analysis performed following HA-immunoprecipitation
in different D2-RiboTag mice (Fig.
2
b). Cross analysis of our data
with in situ hybridization (ISH) profiles from the Allen Brain Atlas
further validated the differential gene expression. Close inspection
of the distribution of genes more expressed in DS indicated that
expression patterns are highly heterogeneous and could be visually
classified into different categories including widespread (Foxp1,
Pcp4, Camkk2, Itpr1), lateral DS restricted (Ace, Me2, Rgs7bp,
Acvrl1), medial DS restricted (Rbp4, Fos, Ntm, Ddit4l), sparse
(Cd4, Cit, B3gnt2), or patch/matrix (Calb1, Pdp1, Cdh8, Plxnd1,
Sepw1)
17(Fig.
2
c and Supplementary Fig. 4a). Differential
expression was also confirmed at the protein level for neurogranin
log2 fold change
849 genes > 1.5 FC 0 50 100 150 200 2 4 6 0 250 300 8
a
60 μm PV HA NPY HA SOM HA D2-RiboTag Acb aca lv LS DS Tu 500 μm 50 μm CR HA Acb D2R enrichedc
Penk Gpr6 Adora2a Pcdhgc4 Drd2 8 4 0 6 2 Fold enrichment Hcfc1 Grik3 Phyhip Sez6 Map2k1 Dlg3 Grin1 Eno2 Pkm Rrp1 Mdh2 Ckmt1 Actb Ppp2r1a Itm2cMaged1 Actg1 Sqstm1 Atp1a3 Nsg2 Mdh1 Atp5a1 Rtn1 Slc22a17 Nsg1 Vcp Psap Atp6v1b2 Aplp1 not enriched Pellet enriched Input enriched 2818 6201 5435 14454
b
astrocyte SOM nNOS NPY ChAT dSPN iSPN PV TH microglia oligodendrocyte ΔΔCT Gfap Cnp Aif1 Pdyn Drd1 Tac1 Drd2 Adora2a Penk Chat Glial cells iSPNs dSPNs Interneurons 1 3 –1 –3 –5 –7 Sst Calb2 Pvalb Npy Thh
2315 genes > 1.5 FC –log10 (adjusted p value)log2 fold change 0 50 100 150 200 250 1 1.5 2 2.5 0.5 3 3.5 4 300 350 Camk2b Cldn23 AC087559.2 Upb1 Calcr Plxdc1 P2ry1 Nt5e Sp9 Gucy1a1
f
–log10 (adjusted p value) 0 10 20 30 40 50 1 1.5 2 2.5 0.5 3 Slc5a4b Bsr3 Drd4 Cbln4 Rasd1 Th Foxp2 Ksr1i
Acb D2R exclusively enriched0
log2 fold change
Zbtb7c 459 5742 6201 Acb/DS D2R Acb D2R –log10 (adjusted p value) 0 20 40 60 80 100 1 1.5 2 2.5 0.5 3 Il1r2 Gys2 Myot Slc5a7 Etl4 Sema7a Slc10a4 Trpc3 DS D2R exclusively enriched 0
log2 fold change
Fam163b 510 6253 Acb/DS D2R DS D2R 3.5 4 5794 Slc17a8 Rpia Tacr3 Crabp2 DARPP-32 HA DARPP-32 HA
d
e
Pcdhgc4 Gpr6 Penk Plxdc1 Adora2a 8 4 0 6 2 Fold enrichment Sp9 Grik3 Grin1 Rrp1 Mdh2 Pkm Acly Eno2 Ppp2r1a Chgd Maged1 Sqstm1 Hspa9 Rtn1 Map2k1Mdh1 Actg1 Eef1a2 Atp5a1 Vcp Itm2c Klc1
Atp6v1b2 Psap Nsg1 not enriched Pellet enriched Input enriched 2945 6253 5256 14454 DS D2R enriched 2260 genes > 1.5 FC –log10 (adjusted p value)
log2 fold change 0 50 100 150 200 250 1 1.5 2 2.5 0.5 3 3.5 4 300 350 Gm20388 Myot AC087559.2 Fig4 Drd2 Ndnf Gpx6 Foxo6 Necab1 Nell1 4.5 -1 -0.5 0 0.5 1 Acb DS Tacr1 Ace Pld3 Sema7a Kctd17 Slc5a7 Dab2ip Cnr1 Acly Me2 Gpr155 Arhgdib Acvrl1 Sgpp2 Gcnt2 Trpc3 Cdh13 Gm19410 Synpo2 Ntn1 Fat1 Cbln4 Lypd1 Trhr Htr2c Gda Ildr2 Hpcal4 Crym Dpp10 Lrrn3 Kcnip1 Rasal1 Cpne6 Ralyl Gfra1 Cux2 Sox1 Ak5 Nnat Islr2 Marcks Atp2b4 Pde1a Abr Ptprg St3gal1 Cadm1 Slc8a1 Pea15a 7773 3884 2797 14454 Acb DS Not enriched DS enriched Acb enriched
j
log2 fold change
1195 genes > 1.5 FC –log10 (adjusted p value) 0 50 100 150 200 2 4 6 8 0 250 300 Brs3 Trhr Nnat Rasal1 Htr2c Pappa2 Pgr15l Cpne6 Kcnip1 Crym Acb D2R enriched 10 –log10 (adjusted p value) DS D2R enriched Calcr Dlk1 Ttr Wnt8b Cdhr4 Cd72 Il2rb Acvrl1 Coch Clspn Ace Sema7a Sgpp2 Trpc3 Synpo2 Me2 Gpr155
g
233 Not enriched Acb and DS D2R enriched DS D2R enriched Gokce et al., 2016 170 41 19 Acb D2R enriched 3 16 10 4 11 Not found Acb and DS enriched inputs Acb enriched inputs Not enriched(Nrgn), D2R, calbindin-D28k (CB), and dopamine- and
cAMP-regulated phosphoprotein, Mr 32 kDa (DARPP-32) (Fig.
2
d).
Notably, our RNAseq approach was highly valuable to detect
differential expression levels of genes encoding proteins mainly
expressed presynaptically, such as Cnr1, the cannabinoid receptor
type 1 (CB1R). Western blot (WB) analysis of CB1R expression
only revealed a slight increase (~13%) in DS compared with Acb
(Fig.
2
e), presumably due to the presence of CB1R in striatal
afferents and the fact that CB1R is mainly expressed in SPNs
terminals (Fig.
2
f). In contrast, when analyzing the mRNA level
present in iSPNs, both RNAseq and qRT-PCR revealed a 8.6- and
3.3-fold enrichment respectively of CB1R in DS compared with
Acb (Fig.
2
g).
Our analysis also revealed a remarkable dorso-ventral expression
gradient of mitochondria-related genes. This bias is particularly
evident for genes encoding for mitochondria ribosomal proteins
(17 in DS vs 5 in Acb), mitochondrial transporters (19 in DS vs 4
in Acb), translocases (12 in DS vs 0 in Acb), and respiratory chain
complex (69 in DS vs 4 in Acb) (Fig.
2
h and Supplementary
Data 3). Among the
five complexes, bias expression was
particularly unbalanced since 26 out of 44 genes encoding for
proteins of the respiratory chain complex I (CI) are more actively
translated in the DS (Fig.
2
h and Supplementary Data 3). This
bias is functionally relevant since the activity of CI measured in
total homogenate was higher in the DS compared with the Acb
(Fig.
2
i). The citrate synthase (CS) activity, a validated biomarker
for mitochondrial density, was also slightly increased in the DS
(Fig.
2
j), suggesting that mitochondria content might be higher
in the DS than in the Acb. However, the increased CI activity
was presumably not only due to a higher mitochondrial density
since the CI/CS ratio was still significantly increased in the DS
(Fig.
2
k).
Genes preferentially expressed in Acb D2R neurons. Similar to
DS, our RNAseq analysis revealed 2797 protein-coding genes that
show a preferential expression in the Acb (Peg10, Calcr, Cbln4,
Amotl1, Gabrg1, Ntn1, Stard5, Lrrn3, Wfs1, Nts, Cartpt, Nnat,
Hap1, Trhr, Hpcal4, Gfra1, Dlk1, Fam126a) (Fig.
3
a). All these
genes were confirmed by qRT-PCR in different D2-RiboTag mice
(Fig.
3
b). Cross analysis with the ISH distribution patterns also
revealed that genes more expressed in Acb are widespread
(Slc35d3, Crym, Nnat) or preferentially distributed in distinct Acb
territories including the core (AcbC) (Cartpt, Hpcal4, Col6a1,
Zdbf2, Calcr, Dlk1, Peg10) as well as the medial (Hap1, Chn2,
Gprin1, Stard5, Lrrn3, Foxp2), ventral (Gpr101, Gfra1, Cdh2,
Gpr26, Cpne6), lateral (Nts, Gpr83), or cone part (Trhr, Cpne2,
Lypd1, Carhsp1, Dpp10) of the shell (AcbSh) (Fig.
3
c, d, g and
Supplementary Fig. 4b). The biased expression toward the Acb
was also confirmed at the protein level for Gat1, Gprin1, Foxp2,
Map2, Sox1, and Hap1 (Fig.
3
d).
Interestingly, we noticed a preferential Acb expression of many
imprinted genes, which are those genes whose expression occurs
from only one allele and represent < 1% of all genes. Among the
90 imprinted genes detected in the striatum, half of them were
differentially expressed between the two regions, with 42 genes
more expressed in the Acb and only 19 in the DS (Fig.
3
e and
Supplementary Data 3). The biased Acb expression of two
paternally imprinted genes, Peg10 and Nnat, were confirmed by
WB (Fig.
3
a, b, f). Strikingly, ISHs revealed distinct localization
patterns within the Acb (Fig.
3
d, g and Supplementary Fig. 4b), as
well as different expression levels compared with other brain
regions. For instance, Calcr, Dlk1, Zdbf2, and Peg10 are almost
exclusively expressed in the Acb compared with surrounding
structures (Fig.
3
d, g and Supplementary Fig. 4b), while Cntn3,
Gnas, and Nap1l5 expression is rather widely distributed. Of note,
several imprinted genes such as Dlk1, Calcr, Zdbf2, and Peg10
show a rather selective expression in the AcbSh cone and ventral
part of the AcbC (Fig.
3
c, g).
We also found transcripts of the imprinted gene Th in Acb
D2R neurons (Fig.
3
e). Although a low number of reads suggests
that Th is probably weakly expressed (Supplementary Data 2),
scattered expression was detected by ISH in the Acb (Fig.
3
h).
This pattern matches with the enriched GFP staining observed in
the bundle-shaped area of the caudomedial AcbSh in Th-eGFP
mice (Fig.
3
i). Consistent with our RNAseq data, we found that
half of the TH neurons also express DARPP-32 in both AcbC and
AcbSh (Fig.
3
j, k). A minor proportion of cells was also positive
for calretinin (CR) but not for NPY or ChAT (Fig.
3
l, m). These
results suggest that in addition to GABAergic interneurons, some
iSPNs also express TH, thereby defining a novel subpopulation of
D2R-TH-SPNs.
Heterogeneity of DS and Acb CINs. Our RNAseq and qRT-PCR
analyses also revealed several CINs-enriched genes, including
classical CINs markers (Chat, AChE, Slc18a3, Slc17a8) as well as
markers previously found by the bacTRAP approach
18(Ufsp1,
Ecel1, Bves, Crabp2, Ntrk1). Finally, several additional
CINs-enriched genes were also identified (Slc10a4
19, Kctd6, S100a10,
Tacr1
20, Tacr3) (Supplementary Fig. 5a, b). The expression of all
these DS-enriched genes was confirmed by qRT-PCR in different
D2-RiboTag mice (Supplementary Fig. 5a, b). Enrichment for
VGLuT3, TrkA, and NK1R was also confirmed by triple
immunofluorescence (IF) analysis in D2-eGFP mice with either
VAChT or ChAT (Supplementary Fig. 5c–e). Because CINs are
differentially distributed across the mouse striatum
21(Supple-mentary Fig. 5c), we determined the percentage of
ChAT/HA-positive cells in the DS and Acb (Supplementary Fig. 5f, g). Our
analysis revealed a gradual decrease in the fraction of ChAT/HA
colabeled cells ranging from 100% co-expression in the DS
(360 HA
+neurons out of 360 ChAT
+cells) to 88% in the AcbC
Fig. 1 Translatome profile of DS and Acb D2R neurons using D2-Ribotag mice. a Coronal striatal section of D2-RiboTag mice stained with HA (cyan) and
DARPP-32 (orange), PV (parvalbumin), CR (calretinin), NPY (neuropeptide Y), or SOM (somatostatin). Note the selective HA expression in ~50% of SPNs
(DARPP-32-positive) corresponding to iSPNs and in CINs (arrowhead).b Drawing summarizing HA expression (cyan) among the distinct striatal cell types
and validation by qRT-PCR (ΔΔCT) of the enrichment of iSPN markers and de-enrichment of dSPNs, interneurons, and glial cells markers after
HA-immunoprecipitation on whole striatal extract (DS and Acb) compared with the input fraction (containing the mRNAs from all cellular types) (n= 4 mice/
group). Data are presented as mean values ± SEM.c Fold-change of protein-coding genes enriched in the Acb pellet fraction of D2-RiboTag mice. d Volcano
plot depicting protein-coding genes enriched in the Acb of D2R neurons.e Fold-change of protein-coding genes enriched in the DS pellet fraction of
D2-RiboTag mice.f Volcano plot depicting protein-coding genes enriched in the DS of D2R neurons. g Doughnut chart showing the overlap and distribution of
D2R-enriched genes found in our study among the 233 D2R-enriched genes identified in13.h Volcano plot depicting protein-coding genes enriched in the
Acb (top panel) and in the DS (bottom panel) of D2R neurons afterfiltering the pellet fraction with the input fraction. i Heatmap of the top 50 genes most
significantly enriched either in DS (pink) or Acb (orange). Scaled expression values are color coded according to the legend. The dendrogram depicts
hierarchical clustering.j Volcano plot depicting protein-coding genes from the pellet fraction of D2R neurons that are enriched in the Acb (top panel) and in
(83 HA
+neurons out of 94 ChAT
+cells) and only 38% in the
AcbSh (36 HA
+neurons out of 95 ChAT
+cells) (Supplementary
Fig. 5f, g). This observation could explain why CINs-enriched
genes were preferentially found in the in DS and the lack of
ChAT enrichment after HA-immunoprecipitation from whole
striatum extract (Fig.
1
c). Our cross analysis with recent results
obtained by single-cell RNAseq analysis
22confirmed that ~83%
of their CINs-enriched genes were also found in a population of
D2R CINs (Supplementary Fig. 5h and Supplementary Data 4).
Interestingly, although less represented, Acb D2R CINs-enriched
genes can also be identified (Supplementary Fig. 5h and
Sup-plementary Data 4). Thus, similar to the heterogeneity of iSPNs,
these results indicate that numerous CINs subpopulations
may exist.
Dab2ip Me2 Rgs4 Itga5 Ace Kctd17 Trpc3 Coch Trnp1 Lpcat4 Fold enrichment 6 3 0 9 Dorsal striatum Kcnk2 Ddit4l Ccnd2 Slc24a2 Rasd2 Rgs7bp Tbc1d8 Gpr155a
Dab2ip Me2 Rgs4 Itga5 Ace Kctd17 Trpc3 Coch Trnp1 Lpcat4 ΔΔCT 4 2 0 Kcnk2 Ddit4l Ccnd2 Slc24a2 Rasd2 Rgs7bp Tbc1d8 Gpr155b
d
e
CB1R β-actin CB1R SNr Ep BlA Hc DS lv GPe Cx 500 μm 1 mm Acb DS 250 150 0 200 100 50 Nrgn AcbC AcbSh DS lv % of control***
Nrgn Acb DS β-actin Tu 500 μmh
j
RNAseq qRT-PCRi
D2R AcbC AcbSh DS v Acb DS % of control**
250 150 0 200 100 50 D2R Acb DS β-actin Tu 500 μm CB DARPP-32 AcbC AcbSh DS lv Tu 500 μm 500 μm AcbC AcbSh DS lv Tu cc Acb DS Cx Acec
1 mm Calb1 lateral DS restricted Cx DS Fos Acb cc cc Acb DS Cx Pcp4 cc Acb DS Cx medial DS restricted widespread matrix ΔΔ CT Fold enrichment Acb DS kDa 150 0 100 50 % of control*
Acb DSf
RNAseq qRT-PCRg
Cnr1 Cnr1 12 6 0 9 3 4 2 0 3 1 Hc 0 10 20 30 40 CI activity Specific activtiy (nmol/min*mg protein) Acb DS***
0 50 100 150 200 CS activity Acb DS*
Specific activtiy (nmol/min*mg protein) 0 0.1 0.2 0.3 0.4 CI/CS Ratio CI/S Acb DS**
Respiratory chain complex 69 genes CIV CI CIII Cv Caf CII 26 6 11 12 12 2k
1 mm 46 60 kDa 46 11 kDa 46 86Systematic molecular classification of DS and Acb D2R
neu-rons. In order to provide further information about molecular
expression biases between the DS and the Acb, we implemented a
classification by sorting genes of interest according to
neuro-transmitter systems based on the publicly available IUPHAR/BPS
database (
www.guidetopharmacology.org
). Thus, genes encoding
receptors, transporters, and enzymes involved in
neuro-transmitter turnover were categorized as Acb-enriched (orange),
DS-enriched (pink), not enriched (gray), or not expressed (black)
and organized for various neurotransmitters systems including
5-HT, catecholamines, GABA, glutamate acetylcholine, and
endo-cannabinoid (Supplementary Fig. 6a–p). This representation,
which allows a rapid overview of the regional enrichment of genes
in D2R neurons, revealed overwhelming differences between the
DS and Acb. A bias toward the Acb is particularly evident in
expression of 5-HTRs (Htr1a, Htr2a, Htr2c, Htr4, and Htr7)
(Supplementary Fig. 6a–d) and for GABAa receptor subunits
(Supplementary Fig. 6h–j).
Remarkable region-specific differences were also found in the
catecholaminergic system. For example, the gene encoding D2R is
highly enriched in the DS (Supplementary Fig. 6f), supporting the
bias shown earlier by WB and IF (Fig.
2
d). However, these
protein-level analyses also included D2R from cortico- and
thalamostriatal, and dopaminergic terminals, and were not
exclusive from iSPNs and CINs as in our RNA-based approach.
Preferential expression of Drd5 was also observed in the DS most
likely corresponding to that found for CINs
23(Supplementary
Fig. 6f and Supplementary Data 4). Our approach also revealed
enrichment of Drd1 and Drd3 mRNAs in the Acb
(Supplemen-tary Fig. 6f), indicating that these DA receptors might also be
present in D2R neurons, as supported by the significant number
of GFP/RFP-positive cells found in AcbSh of
D2-eGFP/D1-tdTomato mice (Supplementary Fig. 6g). This enrichment of Drd1
transcripts in Acb D2R neurons provides additional evidence for
a higher proportion of D1R/D2R neurons in the Acb
24–28.
Similar classification was performed for voltage-gated ion
channels including calcium, sodium, and potassium channels, which
comprise inwardly rectifying potassium channels, voltage-gated
potassium channels, two-P potassium channels, calcium-activated
potassium channels, and accessory subunits (Supplementary
Fig. 7a–g). Future studies may demonstrate a relationship between
the intrinsic electrophysiological properties of D2R subpopulations
and channel expression levels. Finally, Gene Ontology (GO) analysis
revealed an important dichotomy between genes more expressed in
DS and Acb that might underlie diversity in the biological functions
of DS and Acb D2R neurons (Supplementary Data 5–7).
Characterization of Acb WFS1 neurons. To illustrate how the
identification of hundreds of novel region-specific molecular
markers may serve as tools to parse the role of D2R in selective
striatal subpopulations, we focused as a proof of concept on Acb
WFS1 neurons. We selected this cell subpopulation based on the
availability of genetic tools and because the Wfs1 gene displayed
one of the most segregated expression patterns between the DS
and Acb. Both ISH and IF analyses revealed a prominent
expression in the Acb, especially in the AcbC and intermediate
AcbSh, while weaker in the lateral and medial AcbSh (Fig.
4
a, b).
To gain insight into the molecular identity of this subpopulation,
we generated Wfs1-Ribotag mice (Fig.
4
c) and performed
RNAseq of the tagged ribosome-bound mRNAs and the input
fractions of the Acb. The specificity of the approach was
vali-dated since Wfs1 mRNA was enriched in the pellet fraction,
while transcripts of markers of astrocytes (Gjb6, Kncj10, Slc1a2),
oligodendrocytes (Olig2, Cnp, Clcn11), microglia (Aif1, Itgam,
Tmem119), and vascular cells (Flt1, Gata2, Sox18) were depleted
(Fig.
4
d). Our analysis (p < 0.05) identified 5885 protein-coding
genes enriched in WFS1 neurons (Fig.
4
e, f and Supplementary
Data 8).
We next examined the presence of markers of specific striatal cell
types within the WFS1 subpopulation. Among the genes enriched
in WFS1 neurons, we found transcripts expressed in SPNs
(Ppp1r1b, Bcl11b, Gpr88, Rgs9), including both dSPNs (Drd1, Pdyn,
Tac1, Chrm4) and iSPNs (Drd2, Adora2a, Penk, Gpr6) (Fig.
4
g and
Supplementary Data 8). These results were confirmed after
analyzing the distribution of WFS1 in both D1R- and D2R-SPNs
(Fig.
4
h, i). While WFS1 appears to be particularly enriched in D1R
AcbC and AcbSh neurons (Fig.
4
h, i), it is also expressed by Acb
D2R neurons (Fig.
4
g–j). By contrast, no expression of Wfs1 was
detected in CINs or other types of interneurons (Fig.
4
k–m). Since
the Acb subcircuitry defined by WFS1 cells has never been
investigated, we next assessed the projection patterns of WFS1
neurons in known target structures of the Acb. To do this, the
Cre-inducible viral vector AAV2/5-hSyn-DIO-rM3D(Gs)-mCherry
was injected into the Acb (injection covering the AcbC and AcbSh
lateral) of Wfs1-CreERT2 mice and RFP (mCherry)
immunor-eactivity was analyzed in Acb output structures (Fig.
4
n, o).
RFP staining was found in the ventral pallidum (VP) and SN/
VTA identified with enkephalin and TH labeling, respectively,
(Fig.
4
o).
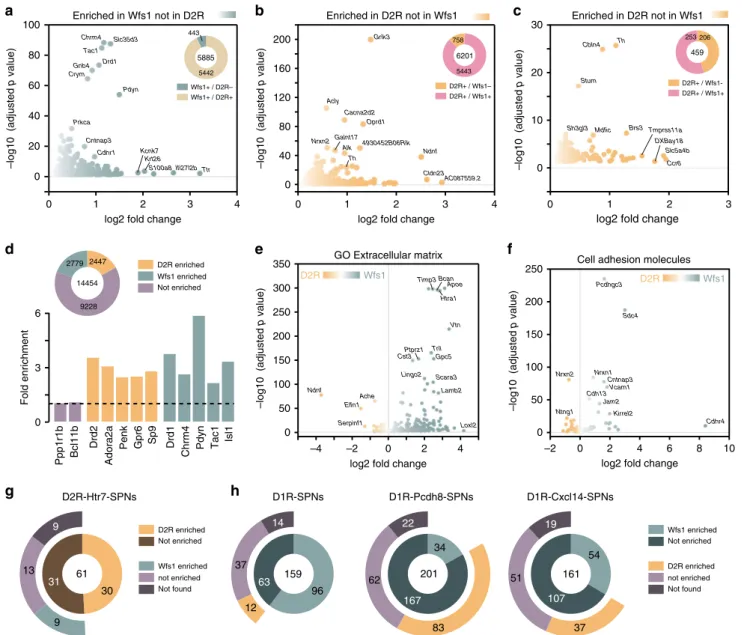
As revealed by PCA, the enriched transcripts found in Acb
D2R neurons markedly differed from the WFS1 subpopulation
(Supplementary Fig. 2). We therefore compared the highest
differentially expressed genes in Acb WFS1- and D2R-positive
neurons (Fig.
5
). This analysis revealed that only 443 out of the
5885 were selectively enriched in WFS1 neurons (Fig.
5
a and
Supplementary Data 9). Conversely, 758 out of the 6201 enriched
genes found in Acb D2R neurons were absent from the genes
enriched in WFS1 neurons (Fig.
5
b and Supplementary Data 9).
When taking into account only the enriched transcripts from
Acb D2R neurons after
filtering the pellet with the input fraction,
Fig. 2 Identification of genes from D2R cells that have a preferential expression in the DS. Fold-change and ΔΔCT of DS-enriched genes found by
RNAseq (a) and confirmed by qRT-PCR (b). Different cohorts of D2-RiboTag mice were used for both techniques. c ISH coronal sections from Allen Brain
Atlas of region-specific DS-enriched genes. d Enrichment of Nrgn (t12= 8.106, p = 0.000003, two-sided t test, n = 7 mice/group), D2R (t12= 4.24, p =
0.0011, two-sided t test, n= 7 mice/group), CB, and DARPP-32 in the DS confirmed by WB and IF analyses (n = 3 mice/group). e WB and quantification of
CB1R in DS and Acb (t12= 2.222, p = 0.0463, two-sided t test, n = 7 mice/group). f CB1R staining in the DS and its output structures (n = 4 mice/group).
g RNAseq fold-change andΔΔCT of qRT-PCR of Cnr1. h Doughnut chart showing the distribution of the DS D2R-enriched genes (69) belonging to the
respiratory chain complex I (CI, 26), II (CII, 2), III (CIII, 6), IV (CIV, 11) and complex V (CV, 12) and to the respiratory chain complex assembly factors (Caf,
12).i Enzymatic activity of complex I (CI) in Acb or DS (t41= 5.791, p = 0.000013, two-sided t test, n = 22 mice/Acb and n = 21 mice/DS). j Enzymatic
activity of citrate synthase (CS) in Acb or DS (t39= 2.706, p = 0.0101, two-sided t test, n = 21 mice/Acb and n = 20 mice/DS). k Ratio CI/CS in Acb or DS
(t38= 3.109, p = 0.0035, two-sided t test, n = 21 mice/Acb and n = 19 mice/DS). All data are presented as mean values ± SEM. DS dorsal striatum, Cx
cortex, LS lateral septum, Acb accumbens, AcbC accumbens core, AcbSh accumbens shell, GPe external globus pallidus, Hc hippocampus, Ep entopeduncular nucleus, BlA basolateral amygdala, SNr substantia nigra part reticulata, Tu olfactory tubercules, aca anterior commissure, lv lateral ventricle, cc corpus callosum.
253 out of the 459 transcripts enriched in D2R cells were also
present in WFS1 cells, and only 206 were exclusive of D2R cells
(Fig.
5
c and Supplementary Data 9). A nonfiltered analysis
revealed that 2779 and 2447 protein-coding genes were found to
be enriched in Acb WFS1- and D2R-positive neurons,
respec-tively, (Fig.
5
d and Supplementary Data 9). A classification based
on neurotransmitter systems as well as GO analysis suggested
major differences between Acb WFS1 and D2R neurons
(Supplementary Figs. 8 and 9 and Supplementary Data 9).
Indeed, a bias toward the Acb D2R neurons is particularly evident
for subunits of voltage-gated calcium channels, sodium channels,
and voltage-gated potassium channels (Supplementary Fig. 9a, b,
Acb DS 140 0 70 % of control *** Gprin1 Acb DS β-actin Gat1 AcbC AcbSh DS lv Acb DS 140 0 70 % of control * Gat1 Acb DS β-actin ICjM Tu 500 µm Gprin1 AcbC AcbSh DS lv ICjM Tu 500 µm Acb DS % of control *** Sox1 Acb DS β-actin 140 0 70 Foxp2 AcbC AcbSh DS Tu 500 µm % of control lv Acb DS % of control *** Foxp2 Acb DS β-actin 140 0 70 ICjM Acb DS MAP2 Acb DS β-actin MAP2 AcbC AcbSh DS lv ICjM Tu 500 µm 140 0 70 * Acb DS 140 0 70 % of control *** Hap1 Acb DS β-actin Ntn1 Stard5 Lrrn3 Wfs1 Gabrg1 Cbln4 Amotl1 Nts Peg10 Calcr Gfra1 Dlk1 Fam126a Hpcal4 Hap1 Trhr Cartpt Nnat Stard5 cc Acb DS Cx Nts Cx cc Acb DS Lrrn3 Cx cc Acb DS Fold enrichment 10 5 0 20 Nucleus accumbens
a
c
Ntn1 Stard5 Lrrn3 Wfs1 Gabrg1 Cbln4 Amotl1 Nts Peg10 Calcr Gfra1 Dlk1 Fam126a Hpcal4 Hap1 Trhr Cartpt Nnat Nucleus accumbensb
ΔΔCT 4 2 0AcbSh medial AcbSh ventral AcbSh lateral
RNAseq qRT-PCR Gpr83 Gpr101 Gfra1 Cx cc Acb DS Cx cc Acb DS Cx cc Acb DS
d
Hpcal4 Cx cc Acb DS 1 mm AcbC Cx cc Acb DS Dlk1 Cpne2 Cx cc Acb DS Trhr Cx cc Acb DS AcbSh cone 1 mm kDa 46 46 kDa 46 80 kDa 46 100 kDa 46 245 kDa 46 58 kDa 46 80 GFP Acb DS Tu 500 μm Positive cells 300 0 200 100 AcbC AcbSh GFP+ / DARPP-32+ GFP+ / DARPP-32–k
20 μm Fold enrichment Gnas Blcap Zdbf2 Sfmbt2Nucleus accumbens (imprinted genes)
Sgce Asb4 Dlx5 Peg3
Usp29 Zim1 Nap1l5 Cntn3 Klf14 Dhcr7 Magel2 Th Rasgrf1 Phactr2 Ddc Grb10 Meg3 Begain Drd1 Htr1a Igf2r Dio3 Qpct Impact Plagl1 Rtl1 Mest Trappc9 Atp10a
e
RNAseq 12 2 0 2f
g
* 140 0 70 % of control 140 0 70 % of control ** Calcr Cx cc Acb DS Zdbf2 Cx cc Acb DS Dlk1 AcbC AcbSh DS cc Peg10 β-actin Acb DS kDa 46 46 Nnat β-actin Acb DS kDa 46 11 Th-eGFP lvj
AcbSh AcbC aca GFP 150 μm 50 μm Th Acb DS Cx cch
1 mmi
GFP NPY AcbSh AcbC aca GFP CR GFP ChAT AcbSh AcbC aca Positive cells 120 0 80 40 AcbC AcbSh GFP– / CR+ GFP+ / CR+ GFP+ / CR– Positive cells 120 0 80 40 AcbC AcbSh GFP– / NPY+ GFP+ / NPY+ GFP+ / NPY– Positive cells 120 0 80 40 AcbC AcbSh GFP– / ChAT+ GFP+ / ChAT+ GFP+ / ChAT–l
m
150 μm 30 μm Th-eGFP AcbSh AcbC aca GFP DARPP-32 GFP DARPP-32d) while subunits of inwardly rectifying potassium channels are
more expressed in Acb WFS1 neurons (Supplementary Fig. 9c).
GO analysis indicated that enriched transcripts from Acb WFS1
neurons are mostly related to the extracellular matrix including
cell-adhesion molecules (Fig.
5
e, f and Supplementary Data 9).
Finally, we cross-analyzed our results with recent single-cell
RNAseq study defining new D2R- and D1R-SPNs
subpopula-tions
13. Among the 61 gene products defining the
D2R-Htr7-SPNs subpopulation, 30 were found to be also enriched in Acb
D2R neurons in our dataset (Fig.
5
g and Supplementary Data 10).
Such analysis also confirmed that WFS1 neurons are enriched in
gene products classifying D1R-SPNs and some of their discrete
subpopulations (Fig.
5
h and Supplementary Data 10).
D2R from WFS1 neurons control digging behavior. To parse
the role of D2R in WFS1 neurons, we generated temporally
controlled conditional Drd2 knock-out mice (D2R-cKO) by
crossing the tamoxifen-inducible Wfs1-CreERT2 BAC
trans-genic mouse line with the Drd2
loxP/loxPline. Three weeks after
tamoxifen treatment, the efficiency of Drd2 ablation was
con-firmed by ISH using Basescope assay (Fig.
6
a). D2R expression
analyzed by WB and IF also confirmed that D2R levels were
reduced by
∼32% in the Acb of D2R-cKO mice (Fig.
6
b, c) and
that deletion of Drd2 was restricted to the Acb since no
differ-ences in D2R expression were found in the DS between genotypes
(Fig.
6
b, c). The
∼70% preserved D2R expression in the Acb of
D2R-cKO mice presumably corresponds to the presynaptic D2R
present in dopaminergic and glutamatergic afferents (including
both cortico- and thalamostriatal inputs) as well as the
post-synaptic D2R expressed in
∼50% of Acb iSPNs that do not
express Wfs1 (see Fig.
4
h, i).
We
first tested whether temporally inducible deletion of Drd2
in a restricted Acb subcircuit impacted locomotor responses. No
differences in total distance traveled or movement speed were
found in an open
field arena between D2R-cKO and control
littermates (Fig.
6
d). Similar results were found in horizontal and
vertical locomotor activity measured in a circular corridor
(Fig.
6
e, f). D2R-cKO also displayed similar motor performance
on the rotarod as compared with control mice (Fig.
6
g). No
alterations in anxiety-like and depressive-like behaviors were
observed in the elevated plus maze and tail suspension test,
respectively, (Supplementary Fig. 10a, b). Moreover, no deficits in
working memory or perseverative behavior were found in the
spontaneous alternation task (Supplementary Fig. 10c).
Intrigu-ingly, D2R-cKO mice exhibited a pronounced impairment in the
marble burying test, hiding less than half of the marbles
compared with control littermates (Fig.
6
h, Supplementary
Videos 1 and 2). This phenotype was not due to an effect of
novelty because similar results were found by repeating the test
the following day, when marbles were already familiar to mice
(Fig.
6
h). In addition, no differences were found in the novel
object exploration task (Supplementary Fig. 10d) or in the time
mice spent exploring the object and stranger in the
three-chamber test (Supplementary Fig. 10e, f). Since the phenotype
observed in marble burying cannot be explained by alterations in
locomotion (Fig.
6
d–f), anxiety (Supplementary Fig. 10a), a lack
of novelty-seeking behavior (Supplementary Fig. 10d), or an effect
of marbles-induced anxiety (Fig.
6
h, day 2), we hypothesized that
an alteration of innate behaviors such as digging could account
for the decrease of marbles buried. Indeed, D2R-cKO mice spent
significantly less time digging than control mice (Fig.
6
i), despite
having a similar latency to start digging and a total number of
digging bouts (Supplementary Fig. 10g). Importantly, D2R-cKO
mice displayed similar goal-directed digging toward standard or
palatable food than control mice (Supplementary Fig. 10h).
Finally, this phenotype is not a consequence of a decrease in
repetitive behaviors since no differences in grooming behavior
(Supplementary Fig. 10i) or in repetitive motor routines
29(Fig.
6
g) were observed between genotypes.
In addition to the role of D2R from WFS1-expressing cells in
digging behavior, we sought to assess whether the whole
WFS1-positive subcircuit (including both dSPNs and iSPNs)
partici-pated in this innate behavior. To do so, we chemogenetically
activated Acb WFS1 neurons by bilaterally injecting the
Cre-inducible viral vector AAV-hSyn-DIO-rM3D(Gq)-mCherry
into the Acb of Wfs1-CreERT2 mice and systemically injecting
its ligand CNO (1 mg/kg). No differences were found between
CNO- and vehicle-treated mice in digging behavior, locomotor
activity, perseverative behavior, working memory, novel object
exploration, or grooming behavior (Supplementary Fig. 11).
The lack of effect in digging behavior after the activation of Acb
WFS1 neurons, compared with the key role that D2R have in
the same subpopulation, could be explained by the
simulta-neous activation of both direct and indirect pathways that might
have opposite roles.
Deletion of D2R from WFS1 neurons enhances the response to
amphetamine. Next, we assessed the contribution of D2R from
WFS1 neurons in response to pharmacological stimulations.
Since D2R is the main receptor targeted by antipsychotic drugs,
we
first evaluated the cataleptic response induced by the typical
antipsychotic haloperidol in D2R-cKO mice. In contrast to the
blunted haloperidol-induced catalepsy observed in mice lacking
the D2L isoform
30,31—which is mainly expressed at postsynaptic
sites—or bearing a selective deletion of D2R in CINs
32, similar
cataleptic responses were observed in D2R-cKO mice and control
littermates (Fig.
6
j). These results indicate that the catalepsy
induced by haloperidol does not require D2R in the WFS1
neu-ronal population.
Fig. 3 Identification of genes from D2R cells that have a preferential expression in the Acb. Fold-change and ΔΔCT of Acb-enriched genes found by
RNAseq (a) and confirmed by qRT-PCR (b). Different cohorts of D2-RiboTag mice were used for both techniques. c ISH coronal sections from Allen Brain
Atlas of region-specific Acb-enriched genes. d Enrichment of Gat1 (t12= 2.316, p = 0.0390, two-sided t test, n = 7 mice/group), Gprin1 (t12= 5.252, p =
0.0002, two-sided t test, n= 7 mice/group), Sox1 (t12= 7.894, p = 0.000004, two-sided t test, n = 7 mice/group), Foxp2 (t12= 4.533, p = 0.0007,
two-sided t test, n= 7 mice/group), MAP2 (t12= 2.892, p = 0.0135, two-sided t test, n = 7 mice/group), and Hap1 (t12= 12.98, p = 0.00000002, two-sided
t test, n= 7 mice/group) in the Acb confirmed by WB and IF analyses (n = 3 mice/group). All data are presented as mean values ± SEM. e Fold-change of
statistically significant imprinted genes found by RNAseq after HA-immunoprecipitation in D2-RiboTag mice. f WB and quantification of Peg10 (t12= 2.183,
p= 0.0496, two-sided t test, n = 7 mice/group) and Nnat (t12= 3.97, p = 0.0019, two-sided t test, n = 7 mice/group) in Acb and DS. All data are
presented as mean values ± SEM.g ISH of imprinted genes from the Allen Brain Atlas and coronal section of Dlk1 immunostaining (n= 3 mice/group). h Th
ISH from the Allen Brain Atlas.i Coronal section of GFP staining in Th-eGFP mice (n= 3 mice/group). j, k Double IF for GFP and DARPP-32 and
quantification of GFP/DARPP-32 cells in the Acb of Th-eGFP mice (n = 3 mice/group). l, m Double IF for GFP and CR, NPY, and ChAT and quantification of
co-expressing cells in the Acb of Th-eGFP mice (n= 3 mice/group). DS dorsal striatum, Cx cortex, Acb accumbens, AcbC accumbens core, AcbSh
We then stimulated D2R indirectly by boosting striatal DA
levels using the psychostimulant amphetamine. After a 3-day
habituation with saline injections in a circular corridor, mice
received a single injection of amphetamine (2.5 mg/kg), which
elicited a robust increase in locomotion in control mice (Fig.
6
k).
Interestingly, the amphetamine-induced locomotor response was
significantly higher in D2R-cKO mice (Fig.
6
k), suggesting that
D2R in WFS1 neurons negatively control the effects of
amphetamine on locomotion. On the other hand, behavioral
sensitization was comparable between genotypes as determined
by similar slopes and ratios between day 1 and 12 of
amphetamine treatment (Fig.
6
l). Finally, similar hyperlocomotor
a
b
c
d
aca cc AcbSh DS 300 μm Wfs1-RiboTagAstrocytes Microglia Oligo. Neurons
AcbC AcbSh DS lv Tu HA 400 μm AcbC AcbSh DS Tu AcbSh medial AcbSh lateral AcbSh intermediate aca AcbC Tu VP Wfs1 500 μm 200 μm lv Vasc. cells Fold enrichment Gjb6 Kncj10 2 4 0 –2 –4 –6 Gad1 Gad2 Slc32a1 Slc1a2 RNAseq Aif1 Itgam Tmem119 Cnp Olig2 Clcn11 Flt1 Gata2 Sox18 Acb Wfs1 enriched
e
Pcdhgc4 PhyhIp Lpl Ncdn Map2k1 6 3 0 Fold enrichment Atp1a1 Pkm Eno2 Chgb Mdh2 Itm2c Rrp1 Ckmt1 Hspa9 Actb Maged1 Psap Vcp Atp5a1 Ppp2r1a Mdh1 Actg1 Atp6v1b2 Sqstm1 Not enriched Pellet enriched Input enriched 3271 5885 5298 14454f
2066 genes > 1.5 FC –log10 (adjusted p value)log2 fold change 0 50 100 150 200 250 1 1.5 2 2.5 0.5 3 3.5 300 350 Penk Ttr Ffar3 Esr1 Ifi27l2b Arg2 Nexn Wfs1 Ppp3ca Rem2 Sez6 Nsg1
j
h
i
n
AAV2/5-DIO-rM3D-mCherry RFP NeuN aca AcbC AcbSh 200 μm RFP Enk aca VP VTA SNr SNc RFP TH RFP 200 μm 300 μm 25 μm D1-eGFP Positive cells D1-eGFP 120 0 80 40 AcbC AcbSh AcbSh intermediate D2-eGFP GFP+ / Wfs1– GFP+ / Wfs1+ GFP– / Wfs1+ 10 μm Wfs1 GFP in situ hybridizationg
Fold enrichment Ppp1r1b Bcl11b Gpr88 SPNs 2 1 0 Rgs9 RNAseq dSPNs Drd2 Adora2a Penk Gpr6m
Fold enrichment –2 0 –4 –6 –8 –10 RNAseq GABAergic INs Calb2 Th Npy Sst Nos1 Chodll
Pthlh Cox6a2 Opn3 Pvalb Wfs1-RiboTag ChAT 20 µm HA merge AcbSh 3k
Fold enrichment Chat Ntrk1 Slc17a8 CINs –2 0 –4 –6 –8 –10 Slc18a3 RNAseq iSPNs Wfs1 Drd2 aca AcbC AcbSh DS cc Tuo
Wfs1-CreERT2 DS 120 0 80 40 AcbC AcbSh D2-eGFP Drd1 Pdyn Tac1 Chrm4 Wfs1 Wfs1 300 μm 100 μm AcbCFig. 4 Anatomical characterization of Acb WFS1 neurons. a Single-molecularfluorescent in situ hybridization for Wfs1 mRNAs in the striatum. b Coronal
section with Wfs1 immunostaining (n= 3 mice/group). c Coronal section with HA immunostaining from Wfs1-RiboTag mice (n = 4 mice/group).
d Validation by RNAseq of the de-enrichment of markers for astrocytes, microglia, oligodendrocytes, and vascular cells, and the enrichment of GABAergic
cells markers after HA-immunoprecipitation on Acb extracts compared with the input fraction (containing the mRNAs from all cellular types).e
Fold-change of protein-coding genes enriched in the Acb pellet fraction of Wfs1-RiboTag mice.f Volcano plot depicting protein-coding genes enriched in the Acb
of Wfs1 neurons.g Fold-change of SPNs, dSPNs, and iSPNs markers from the Acb pellet fraction of Wfs1-RiboTag mice. h Double IF for GFP and Wfs1 in
D2-and D1-eGFP mice (n= 3 mice/group). i Quantification of GFP/Wfs1 cells in the Acb of D2- and D1-eGFP mice. j Single-molecular fluorescent in situ
hybridization for Wfs1 (orange) and Drd2 (cyan) mRNAs in the striatum.k Fold-change of CINs markers de-enriched in the Acb pellet fraction of
Wfs1-RiboTag mice.l Double IF of ChAT (orange) and HA (cyan) in the Acb of Wfs1-RiboTag mice. m Fold-change of striatal interneuron markers de-enriched in
the pellet fraction of Wfs1-RiboTag mice.n Schematic of Cre-dependent AAV-mCherry Acb injection in Wfs1-CreERT2 mice and visualization of the mCherry
expression (gold color) at the injection site as well as (o) in output structures identified by co-staining with ENK (ventral pallidum, VB) and TH (substantia
nigra pars compacta, SNc, and ventral tegmental area, VTA). DS dorsal striatum, Cx cortex, Acb accumbens, AcbC accumbens core, AcbSh accumbens shell, ICjM island of Calleja, Tu olfactory tubercules, aca anterior commissure, lv lateral ventricle, cc corpus callosum.
d
6 3 0 Fold enrichment Ppp1r1b Bcl11b Drd2 Adora2a Penk Gpr6 Sp9 Drd1 Chrm4 Pdyn Tac1 Isl1e
log2 fold change
–log10 (adjusted p value) 0 50 100 150 200 250 0 –2 2 4 6 8 10 Cdhr4 Pcdhgc3 Sdc4 Nrxn1 Cntnap3 Vcam1 Nrxn2 Jam2 Kirrel2 Cdh13 Ntng1
Cell adhesion molecules
GO Extracellular matrix
f
–log10 (adjusted
p
value)
log2 fold change 0 50 100 150 200 250 –2 0 2 4 –4 300 350 Wfs1 D2R Ndnf Elfn1 Ache Serpinf1 Timp3 Apoe Bcan Htra1 Vtn Cst3 Ptprz1 Tril Gpc5 Loxl2 Lingo2 Scara3 Lamb2 9228 2447 2779 14454 Not enriched D2R enriched Wfs1 enriched D2R Wfs1
log2 fold change
–log10 (adjusted p value) 0 20 40 60 80 100 0 1 2 3 4 Ttr Ifi27l2b Pdyn Chrm4 Slc35d3 Tac1 Drd1 Crym Gnb4 Prkca Cntnap3 Cdhr1 S100a8 Krt26 Kcnk7
log2 fold change
–log10 (adjusted p value) 443 5442 5885 Wfs1+ / D2R+ Wfs1+ / D2R– 0 40 80 120 160 200 Alk Grik3 Acly Galnt17 Cacna2d2 Oprd1 Nrxn2 4930452B06Rik Th Cldn23 Ndnf 0 1 2 3 4 AC087559.2 D2R+ / Wfs1+ D2R+ / Wfs1– 758 5443 6201 –log10 (adjusted p value) 0 10 20 30 0 1 2 3
log2 fold change
Enriched in Wfs1 not in D2R Enriched in D2R not in Wfs1 Enriched in D2R not in Wfs1
Th Cbln4 Stum Brs3 Mdfic Sh3gl3 Slc5a4b Ccr6 DXBay18 Tmprss11a D2R+ / Wfs1+ D2R+ / Wfs1-253 206 459
a
b
c
D1R-Cxcl14-SPNs D1R-Pcdh8-SPNs 201 34 167 62 83 22 D1R-SPNs D2R-Htr7-SPNsg
61 30 31 13 9 9 159 63 12 14 96 Not found Wfs1 enriched not enriched Not enriched D2R enrichedh
161 54 107 51 37 19 Not found D2R enriched not enriched Not enriched Wfs1 enriched 37Fig. 5 Molecular characterization of Acb WFS1 neurons. a Volcano plot depicting protein-coding genes selectively enriched in the Acb of WFS1 neurons.
Volcano plot depicting protein-coding genes selectively enriched in the Acb of D2R neurons without (b) or afterfiltering the pellet fraction with the input
fraction (c) compared with Acb Wfs1 neurons. d Fold-change of markers enriched from the Acb pellet fraction of Wfs1-RiboTag mice vs D2-RiboTag mice. Volcano plots of GO enrichment analysis of genes related to extracellular matrix (e) including cell-adhesion molecules (f) in the Acb D2R and WFS1
neurons. (g) Doughnut chart showing the overlap and distribution of Acb D2R- and WFS1-enriched genes found in our study among the genes defining the
D2R-Htr7 SPNs13.h Doughnut chart showing the overlap and distribution of Acb D2R- and WFS1-enriched genes found in our study among the genes
b
Control D2R-cKO Acb*
D2R β-actin % of control 140 0 70 DS D2R β-actin ct D2R-cKOct D2R-cKO ct D2R-cKO ct D2R-cKO Acb DSc
d
e
f
# of marbles buried ct D2R-cKO 0 5 10 15 20 Day 1***
# of marbles buried ct D2R-cKO 0 5 10 15 20 Day 2***
Marbles burying 0 5 10 15 0 2 4 6 8 ct D2R-cKO Total distance (m) Speed (cm/s)ct D2R-cKO Open field Control D2R-cKO Control D2R-cKO # of rearings (30 min) ct D2R-cKO 0 50 100 150 200 Rearings
Locomotor activity (1/4 turns per 30 min)
0 20 40 60 80 0 10 20 30 Circular corridor ct D2R-cKO Time (min)
h
0 100 200 300 400 ct D2R-cKO Locomotor activityg
Duration of digging (s)***
ct D2R-cKO 0 20 40 60 80 Digging behaviori
aca DS lv D2R AcbC aca DS lv D2R AcbC 500 μm 30 μm Rotarod 0 1 2 3 4 5 6 7 8 9 10 11 12 0 50 100 150 200 250Times to fall off (s)
ct D2R-cKO
Trials day 1 day 2 day 3 day 4
4 to 40 rpm 8 to 80 rpm Drd2 Wfs1 DS Acb
a
Control D2R-cKO DS Acb Drd2 Wfs1 500 μm 500 μm 0 1000 2000 3000 4000 5000k
l
Locomotor activity (1/4 turns per 120 min)
0 30 60 90 ct D2R-cKO Time (min) ct D2R-cKO 6000
**
Acute d-amphetamine (2.5 mg/kg) 0 100 200 300 120 d-amph Sensitization d-amphetamine (2.5 mg/kg) 1 12 0 200 400 600 800 Day 1 12Locomotor activity (1/4 turns per 10 min) Locomotor activity (1/4 turns per 5 min)
0 5 10 15 20 Ratio (day12/day1) ct D2R-cKO 0 20 40 60 Catapelsy (s) ct D2R-cKO Haloperidol (1.5 mg/kg)
j
86 kDa 46 46 86Fig. 6 Temporal deletion of Drd2 from WFS1 neurons alters digging behavior and amphetamine effects. a Double ISH of Drd2 (blue) and Wfs1
(magenta) in the striatum of control and D2R-cKO mice.b WB (top) and quantification (bottom) of D2R in control (ct) and D2R-cKO in Acb (t10= 2.542,
p= 0.0293, two-sided t test, n = 6 mice/group) and DS (t12= 0.7706, p = 0.4588, two-sided t test, n = 6 mice/group). c Coronal section of D2R staining
in D2R-cKO and ct.d Representative track traces (left), total distance traveled over 30 min (middle) (t13= 1.51, p = 0.1549, two-sided t test, n = 7 ct and
n= 8 D2-cKO), and average speed (right) (t14= 1.563, p = 0.1405, two-sided t test, n = 8 mice/genotype). Horizontal (e: t28= 0.8209, p = 0.4186,
two-sided t test, n= 14 ct and n = 16 D2R-cKO) and vertical (f: t28= 0.709, p = 0.4842, two-sided t test, n = 14 ct and n = 16 D2R-cKO) activity over 30 min in
a circular corridor.g Accelerating rotarod performance of D2R-cKO and ct. Time to fall off is represented among the six trials at 4–40 rpm (time: F(5, 75) =
16.47, p < 0.0001; genotype: F(1, 15)= 0.7803, p = 0.3910; interaction: F(5, 75)= 1.314, p = 0.2672, two-way ANOVA repeated measures) and the six
following trials at 8–80 rpm (time: F(5, 75)= 3.761, p = 0.0043; genotype: F(1, 15)= 0.5911, p = 0.4539; interaction: F(5, 75)= 0.7171, p = 0.6126, two-way
ANOVA repeated measures) (three trials/day for 4 days, n= 16 mice/genotype). h Representative pictures and number of marbles buried after 20 min for
each genotype on day 1 (t45= 6.984, p = 1.07E−08, two-sided t test, n = 23 ct and n = 24 D2R-cKO) and 24 h later (day 2) (t29= 4.154, p = 0.0003,
two-sided t test, n= 15 ct and n = 16 D2R-cKO). i Total duration of digging behavior over 3 min (t27= 3.913, p = 0.0006, two-sided t test, n = 14 ct and n = 15
D2R-cKO).j Total catalepsy time 60 min after haloperidol administration (1.5 mg/kg) (t14= 0.9354, p = 0.3654, two-sided t test, n = 8 mice/genotype).
k Horizontal activity over 30 min of habituation and over 120 min after amphetamine administration (2.5 mg/kg) (time: F(29, 435)= 38.31, p < 0.0001;
genotype: F(1, 15)= 14.43, p = 0.0017; interaction: F(29, 435)= 5.260, p < 0.0001, two-way ANOVA repeated measures; t15= 3.799, p = 0.0017, two-sided
t test, n= 9 ct and n = 8 D2R-cKO) in a circular corridor. l Total locomotor activity over 10 min after amphetamine administration (2.5 mg/kg) on day 1 and
after a challenge injection one week after a 5-day repeated treatment (day 12) and ratio day 12/day 1 (t15= 1.076, p = 0.2989, two-sided t test, n = 9 ct and
n= 8 D2R-cKO). All data are presented as mean values ± SEM. DS dorsal striatum, Acb accumbens, AcbC accumbens core, aca anterior commissure, lv
responses were observed in both genotypes after a single injection
of the NMDA receptor antagonist, MK801 (0.3 mg/kg)
(Supple-mentary Fig. 10j), suggesting that Drd2 ablation from WFS1
sub-population does not affect the glutamate contribution within the
corticostriatal loop.
Together, these results show a role of D2R in WFS1 neurons in
the acute locomotor effects induced by amphetamine but not in
behavioral sensitization.
Discussion
D2R play a crucial role in DA-mediated motor control and
represents an important target to treat disorders (e.g.,
schizo-phrenia) in which DA signaling is altered. However, given the
widespread expression of striatal D2R, the precise function of
D2R in relation to their neuroanatomical locations within the
striatum remains unclear. Here, based on our translatome
ana-lysis of D2R neurons, we have identified a specific group of
striatal neurons in which Drd2 ablation alters a specific type
of behavior. Our results provide a proof of concept of the interest
of identifying specific SPN subpopulations to better dissect the
actions of DA on its target neurons.
The present work clearly supports the existence of the
mole-cular heterogeneity of striatal D2R neurons. Importantly, our
study reveals that this high level of diversity cannot be
appre-hended without taking into account the anatomical localization of
those neurons throughout the dorso-ventral axis of the striatum.
Indeed, our cross analysis indicated that expression patterns of
enriched genes are highly heterogeneous within the DS, the AcbC,
and the AcbSh. Although we focused here on the comparison of
mRNAs of DS and Acb D2R neurons, similar expression patterns
most likely exist for D1R-positive cells. Indeed, in a recent
single-cell RNAseq study showing heterogeneity of SPNs
subpopula-tions
13, neither whole-transcriptome PCA nor t-distributed
sto-chastic neighbor embedding separated dSPNs from iSPNs within
the neuronal cluster, suggesting that they share similar gene
expression patterns. In line with this observation, we found that
the biased dorso-ventral expression pattern of the Wfs1 gene
toward the Acb was found in both dSPNs and iSPNs.
Our data demonstrate the existence of a molecular complexity
that goes beyond the classical D1R/D2R dichotomy
33,34, as iSPNs
actually consist of several neuronal subpopulations with
func-tional heterogeneity. In this regard, a recent study unveiled that
D2R from the AcbSh have a higher sensitivity for DA than those
from the DS. This difference has been attributed to postsynaptic
signaling molecules that differ between the two regions
35. In
support of this hypothesis, our study revealed significant
differ-ences in expression of genes encoding for postsynaptic molecules
that belong to G protein signaling and RGS family, which could
account for the region-dependent D2R sensitivity to DA.
Like-wise, the present study further supports the existence of
mole-cular heterogeneity among CINs. The biased expression of D2R
toward DS CINs may explain why D2R-dependent
hyperpolar-ization of CINs was preferentially observed in DS but not in
AcbSh
32,36.
Using Th-eGFP mice, previous studies identified distinct classes
of TH-positive cells in the striatum
37. Despite the expression of
VMAT1, TH neurons did not release DA and were clearly
cate-gorized as GABAergic interneurons
37,38. However, our analysis
revealed that a high proportion of TH cells co-expressed
DARPP-32, indicating that at least a fraction of TH neurons within the
Acb corresponds to D2R neurons. Our cross analysis strongly
suggests that TH/DARPP-32 neurons located in the AcbSh may
correspond to the recently identified D2R-Htr7-SPNs
sub-population
13, whose electrophysiological and morphological
patterns as well as synaptic connectivity remain to be established.
Finally, our systematic gene classifications, GO analysis, and
associated functional assays reveal distinct biological functions of
D2R subpopulations in relation with their regional expression.
Indeed, the predominant expression of mitochondria-related
genes in D2R neurons from the DS is accompanied by an
increased activity of CI. Such imbalanced mitochondrial activity
and content could render DS iSPNs more vulnerable to oxidative
stress in Huntington’s disease, possibly explaining why they
degenerate earlier than dSPNs and why the neuronal loss
pro-ceeds from dorsal to ventral striatum
39.
Our study unveils the role of DA in digging behavior via a
mechanism that requires D2R in WFS1 neurons. Digging is an
evolutionarily conserved trait used in many species to seek or
hoard food, to create a refuge from cold or predators, or a nest for
the young. These actions require both a motor component and a
motivational value, two traits controlled by the Acb. In this line,
our results point to a prominent role of D2R located in a
sub-population of the Acb in the control of digging behavior. Since
Acb D2R neurons project to the VP, the Acb-VP subcircuit
formed by WFS1 neurons is likely to be the one involved in
DA-controlled digging. Importantly, decreased digging behavior is the
only motor phenotype observed in D2R-cKO mice under basal
conditions. In contrast to full D2R-KO mice
40,41and lacking D2R
in all iSPNs or in the Acb
5, no hypolocomotion or altered rotarod
performance were observed in our D2R-cKO mice.
Haloperidol-induced catalepsy was dampened in mice lacking the D2L
isoform
30,31or lacking D2R selectively from CINs
32but remained
unaltered in our D2R-cKO mice. Our study also reveals that
boosting DA levels by the use of amphetamine induced a higher
locomotor hyperactivity in D2R-cKO than in control littermates.
This contrasts with the blunted response to cocaine—another
psychostimulant that also increases DA levels—observed in SPNs
D2R-KO mice
42, in mice lacking the D2L isoform
31, and in
Drd2
loxP/loxPmice injected with a viral vector expressing Cre
recombinase in the Acb
43. The number of neurons bearing D2R
ablation (DS and Acb) or possible developmental effects
pre-sumably account for these differences. Although the latter study
targeted D2R deletion in the Acb during adulthood, the viral
approach was not cell type-specific, hence leading to the
knock-down of D2R in all D2R-expressing cells (D2R-SPNs,
D1R/D2R-SPNs, and CINs) located within the Acb. In contrast, in our study
D2R were ablated only from a specific iSPN subpopulation
including a limited number of cells in the AcbC and intermediate
AcbSh. Therefore, these opposing effects suggest that Acb D2R
have different roles in response to drugs of abuse depending on
the subcircuit in which they are located.
Collectively, here we identified novel region-specific and
genetically defined D2R cell subpopulations, which will likely be
useful for delineating and studying discrete striatal subcircuitry.
Manipulation of D2R from one subcircuit, WFS1-positive
neu-rons, produces a highly specific behavioral phenotype, and
sug-gests a selective role for D2R in these neurons in the control of
digging behavior and amphetamine-induced hyperlocomotion.
Therefore, our approach opens the way for parsing the behavioral
role of D2R in specific, well-defined groups of striatal neurons.
Materials and methods
Animals. The different mouse lines used in the present study are listed in the resource table (Supplementary Information). Homozygous RiboTag female mice were crossed with D2R-Cre heterozygous male and Wfs1-CreERT2 heterozygous male mice to generate D2-RiboTag and Wfs1-RiboTag, respectively. To delete Drd2 from WFS1 neurons, heterozygous Wfs1-CreERT2 mice were crossed with
homozygous Drd2loxP/loxPmice. First-generation animals expressing Cre under
Wfs1 promoter were crossed a second time with homozygous Drd2loxP/loxPmice to
generate the tamoxifen-inducible Drd2 ablation specifically in WFS1 neurons
(D2R-cKO). For all behavioral experiments, male and female homozygous Drd2loxP/loxPmice expressing CreERT2 under Wfs1 regulatory sequence were