HAL Id: hal-01875901
https://hal.archives-ouvertes.fr/hal-01875901
Preprint submitted on 18 Sep 2018HAL is a multi-disciplinary open access archive for the deposit and dissemination of sci-entific research documents, whether they are pub-lished or not. The documents may come from
L’archive ouverte pluridisciplinaire HAL, est destinée au dépôt et à la diffusion de documents scientifiques de niveau recherche, publiés ou non, émanant des établissements d’enseignement et de
Trichodesmium and other Planktonic Cyanobacteria in
New Caledonian waters (South West Tropical Pacific)
during an El Niño Episode
Márcio Murilo Barboza Tenório, Cecile Dupouy, Martine Rodier, Jacques
Neveux
To cite this version:
Márcio Murilo Barboza Tenório, Cecile Dupouy, Martine Rodier, Jacques Neveux. Trichodesmium and other Planktonic Cyanobacteria in New Caledonian waters (South West Tropical Pacific) during an El Niño Episode. 2018. �hal-01875901�
Trichodesmium and other Planktonic Cyanobacteria in New Caledonian
1
waters (South West Tropical Pacific) during an El Niño Episode
2 3
Márcio Murilo Barboza Tenório1, Cécile Dupouy2,5*, Martine Rodier3,6, Jacques 4
Neveux4 5
6
1Laboratório de Plâncton Marinho, Inst. de Biol., Univers. Federal do Rio de Janeiro - UFRJ, Av.
7
Brigadeiro Trompowsky, s/n, CCS, BL A, SL.79, Cid. Univers., CEP 20530-310, Rio de Janeiro, RJ, Brazil!
8
2Aix-Marseille Université, Université de Toulon, CNRS, Institut de Recherche pour le
9
Développement, UM 110, Mediterranean Institute of Oceanography, Bâtiment Méditerranée,
10
Campus de Luminy, 163 Avenue de Luminy, 13288 Marseille, France
11
3Institut de Recherche pour le Développement-Université de la Polynésie Française-
12
Institut Louis Malardé-Ifremer, UMR 241 Ecosystèmes Insulaires Océaniens, Papeete, French
13
Polynesia
14
4 Observatoire Océanologique de Banyuls, CNRS-UPMC, LOMIC (UMR 7621), Avenue Pierre
15
Fabre, 66650 Banyuls sur Mer, France
16 17
5Present address : Centre IRD de Nouméa, BP A5 Cedex, 98848 Noumea, New Caledonia
18
6Present address : Centre IRD de Tahiti, BP 529, 98713 Papeete, French Polynesia
19 20
*Corresponding author: cecile.dupouy@mio.osupytheas.fr!
21 22
KEY WORDS : Trichodesmium, Filamentous cyanobacteria, community structure, 23
microscopy, picoplankton, pigments, Loyalty Islands, New Caledonia, coral-reef lagoon, ENSO 24
25
ABSTRACT. Contributions of filamentous and picoplanktonic cyanobacteria to the 26
phytoplankton community structure were examined in New Caledonian waters during the 2001-27
2003 El Niño period at three stations. Morphometric characteristics of diazotrophic filamentous 28
cyanobacteria are given as well as the seasonal and inter-annual variations of their surface areas 29
and integrated abundances. Trichodesmium tenue and T. thiebautii were the dominant species 30
followed by T. erythraeum, altogether accounting for more than 51-80 % of the biomass of the 31
free-living filamentous cyanobacteria. Katagnymene spp. accounted for a smaller percentage 32
(<13.8 % at ocean stations, <3.6 % in the lagoon). R. intracellularis biomass was relatively small 33
(<1 % of total surface area and volume of Trichodesmium trichomes) with the highest 34
concentration observed in summer (735 trichomes l-1). Colonies of unidentified cyanobacteria
35
composed of spherical cells accounted on average for <1 % of the Trichodesmium biomass, with 36
values exceeding 4000 cells l-1. Abundance of filamentous cyanobacteria varied according to
37
environmental factors, with summer 2001-2002 characterized by low filamentous diazotroph 38
abundance and summer 2003, occurring at the peak of the 2001-2003 El Niño, particularly rich 39
in filamentous cyanobacteria (with a maximum Trichodesmium spp abundance of 4500 trichomes 40
l-1 in the Loyalty Channel). A similar variability pattern was observed for large diatoms and
41
dinoflagellates, and for all picoeukaryotic populations. Different biomass estimators are provided 42
as cell abundances, pigment concentrations including chlorophylls and phycoerythrin, and carbon 43
content. The filamentous communities dominated in summer in oceanic waters while 44
Synechococcus and picoeukaryote communities dominated in lagoon waters in winter at all 45 stations. ! 46 ! 47 INTRODUCTION 48 ! 49
In the Oceans, most of the subtropical and tropical pelagic areas are dominated by 50
oligotrophic conditions and picophytoplankton, which are best adapted to nutrient-poor 51
environments (Buitenhuis et al. 2012a, Luo et al. 2012). Unicellular picoplanktonic cyanobacteria 52
are certainly the most abundant photosynthetic group and distributed throughout the tropical 53
Pacific Ocean (Le Bouteiller et al. 1992, Ishizaka et al. 1994, Buitenhuis et al. 2012b). Other 54
marine cyanobacteria, comparatively patchier and less abundant, also play a pivotal role in N-55
limited ecosystems, combining primary production and dissolved N2 fixation (diazotrophy). This
56
cyanobacterial diazotrophic community includes unicellular, filamentous, and symbiotic forms 57
(Luo et al. 2012, Bergman et al. 2013). Pelagic filamentous cyanobacteria consist mainly of the 58
Trichodesmium genus with two more frequently reported and quantified species: T. erythraeum 59
Ehrenberg and T. thiebautii Gomont. Three other Trichodesmium species (T. tenue Wille, T. 60
contortum Wille and T. hildebrandtii Gomont), and two Katagnymene species (K. pelagica and 61
K. spiralis Lemmerman) are more scarcely reported. Furthermore, Richelia intracellularis has 62
been regarded as one of the main tropical filamentous diazotrophs in marine pelagic waters 63
forming large blooms in some regions as parts of Diatom-Diazotrophic Associations (DDAs). 64
This heterocystous cyanobacterium is usually observed as an endosymbiont of the Rhizosolenia 65
(sometimes referred as Het1 or RR) and Hemiaulus (Het-2 or HR) (Venrick 1974, Janson et al. 66
1999) diatoms and has also been reported as an epiphyte of Chaetoceros spp. (Gómez et al. 2005) 67
or a free-living filament. The epiphytic form was identified as a separate species, Calothrix 68
rhizosoleniae, based on genetic characterization (Janson et al. 1999, Foster et al. 2010). It has 69
also been reported in cohabitation with Trichodesmium puff-form colonies (Jabir et al. 2013, 70
Momper et al. 2015, Giraud et al. 2016). Besides Trichodesmium and other filamentous 71
cyanobacteria, free-living unicellular cyanobacteria (UCYN-A, -B, and -C) are also recognized 72
as possible major diazotrophs in tropical and subtropical areas (Zehr & Bombar 2015), occupying 73
different ecological niches. 74
N2 fixation by filamentous cyanobacteria in the oceans is estimated at around 80 Tg N per
75
year (Capone et al. 1997) for a global oceanic N2 fixation of 100-200 Tg N per year (Karl et al.
76
2002) and accounts for more than 70 % of global marine N2 fixation (Luo et al. 2012, Bergman
77
et al. 2013). The Southern Tropical Pacific is a region known for high N2 fixation, as measured
78
between New Caledonia and Vanuatu (Garcia et al. 2007, Masotti et al. 2007, Biegala et al. 2014), 79
over a longitudinal transect at 17oS (Shiozaki et al. 2014) and in the lagoon (Biegala & Raimbault
80
2008, Bonnet et al. 2016). Surface blooms are frequently observed in the region, mainly 81
composed of filamentous cyanobacteria (Dupouy et al. 2011). 82
Identification and counts of filamentous cyanobacteria at the species level are nevertheless 83
scarce (Campbell et al. 2005, Luo et al. 2012) as recent work relies only on Nifh gene counts 84
(Moisander et al. 2010, Bonnet et al. 2015, 2016). Moreover, few studies address their temporal 85
variability as reported at HOT in the Northern Pacific (Letelier & Karl 1996), BATS in the 86
Northern Atlantic (Orcutt et al. 2001), and in the Indian Ocean (Lugomela et al. 2002). 87
By quantifying the different species abundances and their specific relationship with nutrient 88
and physical environmental conditions, it should be possible to more precisely identify the main 89
factors stimulating filamentous cyanobacterial growth and how they affect the community 90
structure. Such data are essential for estimating global N2 fixation more accurately, improving
91
our understanding of how N2 fixing species respond to their environment, and anticipating how
92
the phytoplankton community will develop in the context of global climate change (Dutkiewicz 93
et al. 2015, Gruber 2016). In situ abundance of filamentous cyanobacteria and their content in 94
pigment are also needed to calibrate recent bio-optical models aiming to determine their 95
abundance from light reflectance of surface mats (Dupouy et al. 2011, Gower et al. 2014, 96
McKinna 2015) or medium concentration blooms (Westberry & Siegel 2006, De Boissieu et al., 97
2014). !
A careful study of the seasonal and inter-annual variations of different filamentous 99
cyanobacteria species abundances was undertaken in 2001-2003 (Diapalis program) in New 100
Caledonian waters and tentatively analyzed based on changes in environmental conditions and in 101
the abundance of other components of the autotrophic community, particularly picoplankton. For 102
this paper, data were obtained at three stations: an open-ocean station (Loyalty Channel), a large, 103
deep and open bay (Santal Bay, Lifou Island) and a lagoon station (Ouinne, southeast coral reef 104
lagoon). Taxonomic identification, measurements and counts of filamentous species were carried 105
out by microscopy while data on picoplankton were analyzed by flow cytometry. The various 106
estimators for determining filamentous cyanobacterial biomass were also compared. Nutrient 107
data (Van Den Broeck et al. 2004, Moutin et al. 2005) and all N2 fixation rates measured under
108
the Diapalis program had been published earlier (Garcia et al. 2007). 109
110
MATERIAL AND METHODS 111
!
112
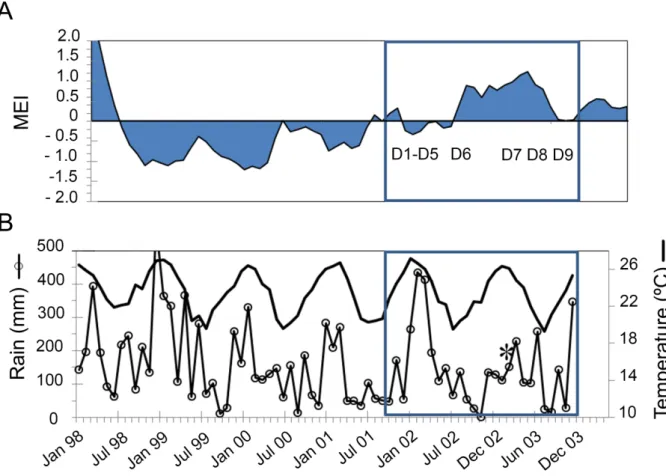
Sampling and environmental data. Nine oceanographic cruises (Diapalis program: D1 to D9) 113
lasting about a week each were conducted between October 2001 and October 2003 aboard IRD’s 114
R.V. Alis between 165°E and 168 °E and between 20°S and 23°S in the Eastern Coral Sea (Table 115
1, Fig 1). Samples were taken at three stations: the first at 167°30’E 20°30’S in the deep Santal 116
Bay which is broadly exposed to the ocean, on Lifou Island’s west coast (bottom depth: 1050 m, 117
ST1), the second in open ocean waters in the middle of the Loyalty Channel at 21°30’S 167°E 118
(bottom depth: 2000 m, ST2), and the third (166°45’E 21°57’S) in the south eastern coral-reef 119
lagoon of New Caledonia (bottom depth: 40 m, ST3). The sampling covered different seasons 120
(Table 1): summers 2002 (D2 to D4) - 2003 (D7), winters 2002 (D6) - 2003 (D8) and transition 121
periods (D1, D5, D9). A sample was also collected from a surface accumulation of 122
Trichodesmium erythraeum located in New Caledonia’s southwestern lagoon. 123
During cruises, CTD casts were carried out at each station with water sampling down to 200 m 124
for the deepest stations and down to 30 m in the lagoon. Temperature (T°C) and salinity were 125
measured with Sea-Bird SBE 911 and water samples were collected with 8L-Niskin bottles 126
attached to a CTD-rosette system. Nitrate + nitrite (NOx) and phosphate (PO#$%) were preserved
127
in Nalgene bottles with HgCl2 prior colorimetric assays on a Technicon autoanalyzer II
128
(Raimbault et al. 1990). Ammonium was measured immediately on board by fluorometry (Turner 129
Design TD-700) according to the procedure described in Holmes et al. (1999). More details on 130
the methods and the full data set Diapalis are available on http://www.obs-131
vlfr.fr/proof/vt/op/ec/diapazon/dia.htm. The mixed layer depth (MLD) was estimated by taking 132
the first depth where potential density (sigma-t) was 0.03 Kg m-3 greater than the density at 10
133
meters, based on Montegut et al. (2004). 134
135
Filamentous cyanobacteria counting and morphometric characteristics. Filamentous 136
cyanobacteria were recovered from water samples taken at 4-6 depths down to 80 m, with a 137
rosette of 8L Niskin bottles. Organisms were collected by filtering whole water bottles through a 138
10 µm Nuclepore polycarbonate membrane. The filter was then placed in a 20 mL glass bottle 139
containing a 4 % formalin solution for preserving photosynthetic organisms. In the laboratory, 140
the filter was rinsed with a plastic wash bottle containing filtered seawater in order to remove all 141
the organisms from the filter and collect them in a 100 mL glass cylinder. After processing, the 142
filter was checked for any remaining photosynthetic organisms. A suitable quantity of an acidic 143
formalin solution (1/1 mixture of 40 % formalin and acetic acid) was then added to obtain 144
organisms in a final 0.4 % formalin solution. From this solution, filamentous cyanobacteria and 145
other large phytoplanktonic species were measured and enumerated with an inverted microscope 146
(OLYMPUS IM., 100× magnification) using a standard sedimentation technique (Utermöhl 147
1931). According to Cronberg et al. (2004), the acetic acid breaks the gas vesicles facilitating the 148
sedimentation of filaments in the sedimentation chambers. Sedimentation time was 24 hours in 5 149
and 10 mL chambers and at least 48 hours for the 25 and 50 mL chambers, depending on cell and 150
filament abundances. A total of 88 samples were examined for the 9 cruises. For surface 151
accumulations of Trichodesmium erythraeum, samples were collected directly by hand with a 152
small bottle (500 mL), which was then processed using the same method as described above.!
153
Identification of the filamentous Trichodesmium, Katagnymene (see review in Bergman et 154
al. 2013) and Richelia (Foster et al. 2010) was carried out based on their morphological 155
characteristics. Cell shape and dimensions (particularly cell diameter) were the main criteria used 156
for classifying and identifying them. The sample processing method used to facilitate 157
enumeration and morphometric examination at trichome level could not be used for observations 158
at colony level, because most of them had disintegrated. Trichome surface and volume were then 159
calculated on the assumption that they had an elongated cylindrical morphology. For T. 160
erythraeum and T. thiebautii, identification was confirmed by molecular biology studies (unp. 161
data). Colonies of unidentified cyanobacteria composed of spherical cells were also observed and 162
enumerated. 163
Photosynthetic pigment analysis by spectrofluorometry. Chlorophylls including divinyl-chl a 164
and b for Prochlorococcus were measured by spectrofluorometry (F4500 HITACHI 165
spectrofluorometer) based on Neveux & Lantoine (1993) and Tenório et al. (2005). From 0.25 to 166
0.5 L, water samples were filtered on 25 mm GF/F for the chlorophylls analysis in the total 167
community. Chlorophylls were extracted in 90 % acetone after grinding the GF/F filter. 168
Measurements in the >10 µm fraction of the community were also carried out by filtering a whole 169
8L Niskin bottle through 47 mm Nuclepore polycarbonate membranes. In the latter case, 170
chlorophylls were extracted in 90 % Dimethylformamide (DMF) without grinding the membrane. 171
For convenience’s sake, the abbreviations Chla, DV-Chla and TChla were used for monovinyl-172
chlorophyll a, divinyl-chlorophyll a and the sum of these two pigments (total chlorophyll a) 173
respectively. Concentrations of cyanobacteria phycoerythrin (PE) were assessed by 174
spectrofluorometry both on the overall and >10 µm community, after extraction/cell resuspension 175
in a 50/50 mixture of glycerol/phosphate buffer based on Wyman (1992). 1 to 3 L water samples 176
were filtered through 47 mm 0.4 µm polycarbonate membranes for total PE and 8L onto 10 µm 177
membranes for size-fractionated PE. Details of the PE spectrofluorometric analysis are given in 178
Lantoine & Neveux (1997), Neveux et al. (1999) and Neveux et al. (2006). 179
!
180
Picoplankton and nanoplankton analysis by flow cytometry. Subsamples (1 mL) were stored 181
in cryovials, and fixed with paraformaldehyde (0.2 % final concentration, Campbell & Vaulot 182
1993) and frozen in liquid nitrogen for a period of less than three months before flow cytometry 183
analyses. Samples were counted on a Becton Dickinson FACSCan flow cytometer. For each cell, 184
forward and side light scattering as well as red and orange fluorescence were quantified. The light 185
signals were calibrated using 1.002 µm fluorescent beads (Polysciences Inc., Europe) as a 186
reference. Four prevalent populations were distinguished and enumerated according to their 187
scattering and florescence properties. Two of them belonged to picoplanktonic cyanobacteria, 188
Prochlorococcus and Synechococcus, and two were eukaryotic groups, the smallest being deemed 189
picoeukaryotes. Unicellular nanoplanktonic cyanobacteria such as Crocosphaera, easily 190
recognized by the fluorescence excitation spectra of their phycoerythrin and by their flow 191
cytometric signature (Neveux et al. 1999), were not observed during the Diapalis cruises. ! 192
Carbon biomass estimation. Information on the relative size of each population within the total 193
autotrophic biomass of the ecosystem was obtained by converting cell numbers into carbon units. 194
Conversion factors [fg C cell−1] for Prochlorococcus (36), Synechococcus (255) and
195
picoeukaryotes (2590) were used according to Buitenhuis et al. (2012b) and for Richelia (10) from 196
Luo et al. (2012). For all filamentous cyanobacteria, the carbon conversion factor determined in 197
this study on Trichodesmium erythraeum was applied (17.22 ng C trichome−1; see Table 8). The
198
integrated carbon content of each group and their relative percentages were calculated for the 199
upper layer (0-60 m ST1 and ST2, 0-30 m at ST3). Note that diatoms and dinoflagellates in the 200
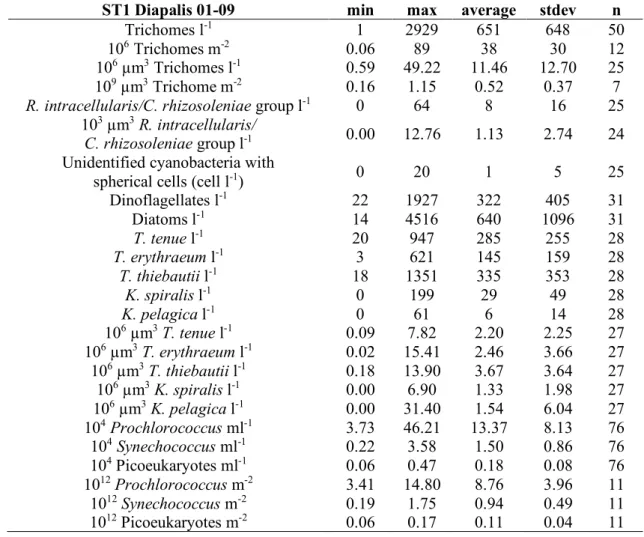
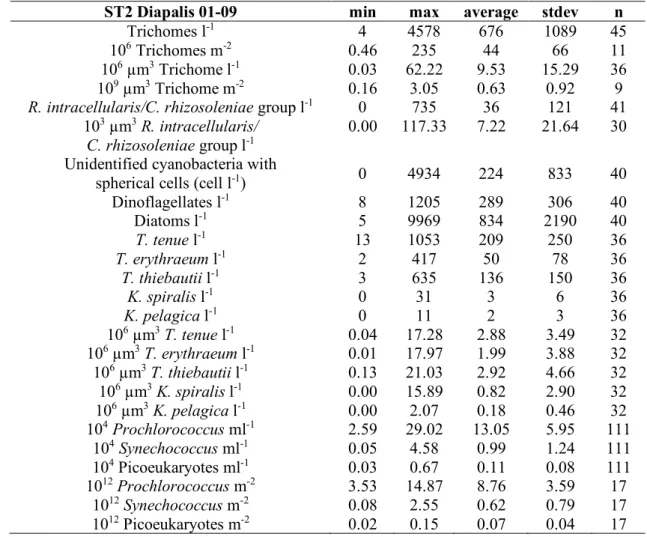
>10 µm fraction were not included in the analysis, since mean cell size or cell volume was not 201 determined. 202 203 RESULTS 204 ! 205
Environmental conditions during the 9 Diapalis cruises 206
207
The New Caledonia region (Fig. 1) is typical of the tropical regime in the South West 208
Tropical Pacific with clear-air temperature and precipitation seasonality (Fig. 2). The Diapalis 209
period (2001-2003) coincided with the 2002-2003 El Nino build-up, with a first period (2001) 210
marked by a Neutral Multivariate El Nino Index (MEI) and the second (2003) by a stronger 211
positive MEI, indicative of a strong Central Pacific El Nino during D7-D9 (Fig. 2). On New 212
Caledonia’s east coast, precipitations were more abundant during summer 2001-2002, with a 213
peak of cumulative rain in January-March 2002, while summer 2003 was drier, except for the 214
passage of Tropical Storm Beni, which crossed the area just before the February 2003 cruise. 215
Beni reached peak intensity on January 29 with winds of 125 mph (205 km/h), before rapidly 216
weakening, and dissipating on February 5. It brought heavy precipitation and floods lasting 6 217
days. 218
During the austral summer, seawater temperature increased to 27 °C at ST1 and ST2 and 219
up to 28°C in the lagoon at ST3 (Fig. 3, left panel), leading to a vertical stratification and the 220
formation of a pronounced thermocline (Fig. 4). During the winter, cooling of surface waters 221
induced vertical mixing in the water column at least down to the deepest sampling level, e.g. 90-222
100 m in Aug 02 at ST2. Minimum temperatures in the upper layer were 23.4 °C at ST1 and ST2 223
and 22.8 °C at ST3. The highest salinities (around 35.4) were measured in Oct 03 at all three study 224
sites, and the lowest during the wet summer season, in Apr 02 (from 34.47 at ST3, close to the 225
mouth of the Ouinne River to 34.86 at ST1). Mean salinities were similar at ST1 and ST2 stations, 226
but lower in summer 2002 than summer 2003, due to different precipitation regimes linked to the 227
El Nino episode (Fig. 2). Mean phosphate (PO4-)concentrations in the upper layer (Fig. 3, right
228
panel) were weak throughout the sampling period, reaching maximum values of 0.06-0.12 µmol 229
l-1 in Oct 01 and Oct 03 during the transition periods and the minimum of 0.02 µmol l-1 in summer.
230
A small increase was observed in winter in Aug 02 due to a deepest MLD (Fig. 4). In wide Santal 231
Bay (ST1), NOx concentrations were also very low, except in Aug 02, when they reached 0.08
232
µmol l-1, linked to the deep winter mixing. The upper layer waters at ST2 oceanic station were
233
NOx poor with concentrations always <0.06 µmol l-1 (Fig. 3), even during deep vertical winter
234
mixing as in Aug 02. Small maxima (0.05 µmol l-1) were observed in Oct 03 as in Feb 03 despite
235
warmer, saltier waters. At ST3 lagoon station, the NOx concentrations varied from 0.01 to a
236
maximum of 0.07 µmol l-1 in Jan 02. NH
4+ concentrations (data not shown) at ST1 and ST2 were
237
generally low <0.04 µmol l-1 and often close to the detection limit 0.01 µmol l-1. Higher
238
concentrations were observed only in Feb 03 at both stations (0.11 and 0.19 µmol l-1 at ST1 and
239
ST2, respectively). In the lagoon, concentrations were on average slightly higher: up to 0.30 µmol 240 l-1. 241 242 Filamentous cyanobacteria 243
Specific composition: Five species of the Trichodesmium genus were observed (Fig. 5-6) and 244
identified by their morphology and morphometric characteristics (Table 2). Three of them, T. 245
erythraeum, T. thiebautii and T. tenue (Fig. 5A, B, H) were the most frequently observed at all 246
three sampling sites. T. contortum was seldom observed (3 samples). Katagnymene (Fig. 5E, F, 247
G) and Richelia/Calothrix (Fig. 6) genera were common (in 50 % and 75 % of samples, 248
respectively), but generally in low abundance. Richelia was observed as an endosymbiont of 249
Rhizosolenia and Hemiaulus and Calothrix as an epibiont on Chaetoceros sp. During the May 250
02 cruise, west of Lifou, we observed unidentified filaments very similar to Trichodesmium, but 251
differing in their very small cellular diameter (2.7-3 µm). We also observed colonies of 252
unidentified cyanobacteria (Fig. 5C, D), which formed clusters sometimes made up of several 253
dozen cells. All filamentous species during Diapalis had dimensions (cell length and cell 254
diameter) within the range published in the literature (Table 3 and 8) and the sizes of T. 255
thiebautii and T. erythraeum species were in the low part of the size range. 256
Trichodesmium and Katagnymene!abundance: At ST1 and ST2, the highest abundances of 257
filamentous cyanobacteria in the 0-60 m upper layer were noted in summer (Feb 03; Fig. 7), i.e. 258
3000-4500 trichomes l-1 and 1000-3000 trichomes l-1 between 5 and 10 m, respectively. However,
259
the concentrations and vertical distribution could be highly variable from one day to another, as 260
shown at ST1 in Feb 03 (Fig. 7). Some vertical profiles showed maximum concentrations at 40 261
m as at ST2 (mostly due to T. erythraeum). Vertical distributions were quite homogeneous at the 262
period of low abundance, i.e. in the austral winter (Aug 02 and Jun 03). At ST3 (Fig. 7), 263
concentrations did not exceed 1000 trichomes l-1. Tables 4 to 6 give general statistics on the
264
abundances of the different filamentous cyanobacteria enumerated by inverted microscopy 265
during Diapalis cruises 1-9 for each station. Filamentous cyanobacteria were extremely rare in 266
Oct 03 regardless of depth.!
267
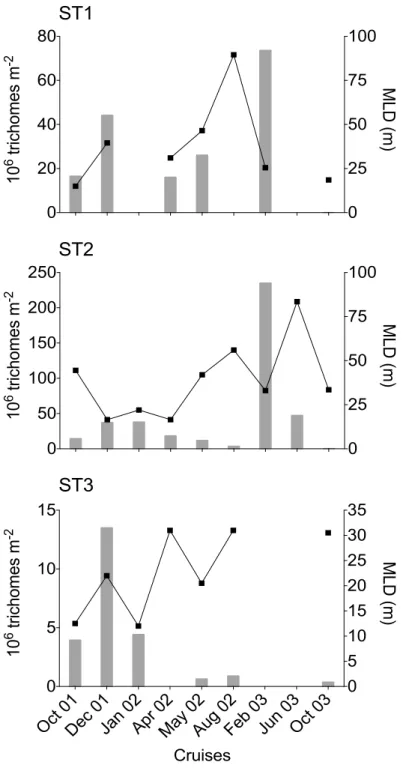
Assuming that Trichodesmium can migrate vertically within one day (Villareal & Carpenter 268
2003), using integrated abundance seemed more appropriate for gauging their seasonal variations 269
in the water column (Fig. 4). Thus, at ST2, 0-60 m integrated abundance showed a 500-fold 270
variation between minimum in Oct 03 (<0.5 106 trichomes m-2) during the transition periods and
271
maximum in summer (Feb 03: 235 106 trichomes m-2). At ST1, the seasonal variations appeared
272
similar but the variation range (x 150) and the maximum summer concentrations (73 106 trichomes
273
m-2) were lower than at ST2. At both stations, maximum abundance in summer 2003 was
274
coincident with a shallow MLD, but low abundances were also observed in summer 2002 with a 275
similar thermohaline structure. At ST3 station (Fig. 4), integrated concentrations (0-30 m only) 276
were 15 times lower and varied from 0.9 106 trichomes m-2 to 13.5 106 trichomes m-2, although
277
ST3 was not sampled in Feb 03. 278
The three main Trichodesmium species together accounted for 85-100 % of the integrated 279
biomass of filamentous cyanobacteria in terms of trichome numbers and always more than 51 % 280
in terms of trichome volume (Fig. 8). Trichodesmium tenue and T. thiebautii were generally the 281
dominant species followed by T. erythraeum. Their mean cell numbers per trichome were 282
relatively similar (Table 7). As expected, the percentage contribution of slender T. tenue was 283
higher in terms of total trichome number than total volume (40-49 % vs 33 %). Its percentage 284
contribution (trichome numbers) was minimum at ST2 in Feb 03 (23 %) and maximum (>70 %) 285
in Dec 01 at ST2 and ST3. T. thiebautii reached >40 % of the total trichome number in 65 % of 286
the samples with minimal contributions in Dec 01 and May 02 at ST2 (<14 %) and a fairly stable 287
one at ST1 and ST3 (37-47 %). 288
In terms of volumes,!T. thiebautii contributions (reaches 50 % at ST2) were more variable, 289
linked to a trichome length changes along the annual cycle. The third main species, T. 290
erythraeum, represented less than 18 % of total trichomes on average, with the minimum 291
contribution at ST3 (<7 %) and maximum at ST1 and ST2 in Feb 03 during the peak abundance 292
(Tables 4 to 6). Its relative importance increased as expressed in volume, especially in Feb 03 at 293
the two open ocean stations (22-28 %). T. contortum and T. hildebrandtii (given as “others” in 294
Fig. 8), contributed <3 % to total trichome number or volume. The unidentified trichomes 295
observed in May 02 further north than ST2 represented less than 1 % of the integrated biomass.!
296
The two Katagnymene species (K. spiralis and K. pelagica) were not numerous, but their 297
contribution in terms of volume was significant. Each form accounted for less than 4 % of the 298
total number of trichomes, except K. spiralis at ST1 in Oct 01 (10 %). K. spiralis was observed 299
in 50 % of samples. Its highest contributions to the total volume of trichomes occurred at ST1 in 300
Oct 01 (28 %) and Feb 03 at ST2 (12 %). The contribution of K. pelagica was around 20 % of 301
the total volume in Feb 03 at ST1 and ST2, 15 % at ST2 in Oct 01, and was not observed at 302
ST3. The relative abundance of species could change along depth. For example, during cruises 303
D4 and D5 (Apr-May 02), T. thiebautii and T. tenue were numerous in the upper layer (60 %) 304
and disappeared at 50 meters while T. erythraeum peaked at this depth. Obviously, the relative 305
abundance depends on the biomass criteria considered. For example, at ST2 in Apr 02, T. 306
erythraeum contributions at 30 to 50 m decreased in terms of trichome number (6 %) but 307
increased (41 %) in terms of total volume, because trichome size increased. The opposite trend 308
was observed for T. thiebautii. 309
310
Richelia intracellularis/Calothrix rhizosolenia (RC) from DDAs and unidentified 311
cyanobacteria abundance: RC (Tables 4 to 6) were observed in 75 % of samples, but their 312
abundance was never very high. The highest RC abundances were recorded in Feb 03 at both 313
ST1 and ST2 (64 trichomes l-1 and up to 735 trichomes l-1, respectively), accounting for less than
314
1 % of total Trichodesmium trichome surface area and volume. Conversely, at ST3, peak 315
abundance was observed for R. intracellularis in Oct 01 (up to 117 trichomes l-1 at the surface)
316
equivalent to 4.3 % of Trichodesmium trichome volume. In our samples, RC in DDAs 317
experienced a considerable variation in filament length (10-88 µm) and cell diameter (vegetative 318
cells 2-7 µm; heterocyst 3-10 µm) or trichomes per host cell (1-22).!We also noted that in most 319
cases, the host cell was almost empty. Apart from Richelia, other symbiotic coccoid-form 320
cyanobacteria (not necessarily diazotrophs) were also observed in Climacodium sp. and 321
Ornithocercus sp., though only in the New Caledonian lagoon. 322
Colonies of unidentified cyanobacteria composed of round-shaped cells observed in some 323
samples reached less than 1 % of Trichodesmium biomass on average (Tables 4 to 6, Fig 5C, D). 324
The highest concentrations were observed at ST2 during Jan 02 and May 02 with values exceeding 325
4000 cells l-1, which was equivalent to less than 1.6 % of Trichodesmium trichome volume. At
326
ST1, these organisms were rarely observed and only at very low concentrations, i.e. <20 cells l-1.
327
At ST3 they were observed only in Jan 02 with a maximum value at 10 m of 429 cells l-1. Tracking
328
Crocosphaera (2-10 µm cell size) by flow cytometric and phycoerythrin signatures was 329
unsuccessful during Diapalis although it has been reported in the region (Saito et al. 2010 and 330
references therein). However, Diapalis samples showed relatively high N2 fixation in the <10 µm
331
fraction, particularly in Oct 03 (Garcia et al. 2007), but it was not possible to link this fixation to 332
specific organisms or biomass indicators.!
333 334
Abundance of other phytoplankton groups 335
336
Picoplankton abundance: Prochlorococcus concentrations at ST1 and ST2 (Tables 4-5 and Fig. 337
9A) was maximum (10-13 1012 cells m-2)during the warm season (Dec 01-Apr 02 and in Feb 03).
338
During transition periods, concentrations were lower by a factor of 3 with 3.5-3.9 1012 cells m-2
339
at ST2 (Oct 01 and Oct 03, respectively), while at ST1 the minimum concentration (4.5 1012 cells
340
m-2) was observed during winter. At these two oceanic stations, the vertical distribution of
341
Prochlorococcus was quite similar, with a marked maximum below the thermocline (40-80 m) 342
in summer and a more homogeneous distribution down to 60-80 m in winter. At ST3, 343
Prochlorococcus abundance was much lower than at the oceanic stations, with values <2.3 1012
344
cells m-2through 0-30 m (max 70 103cells ml-1), except in Dec 02 when they reached 4.8 1012
345
cells m-2 (max 225 106cells ml-1 at depth). !
346
Unlike Prochlorococcus, integrated abundance of Synechococcus (Tables 4 to 6, Fig. 9B), 347
was on average 5 to 14 times higher at the lagoon station (ST3) than offshore (ST1 and ST2), 348
except during the austral winter (Aug 02) when they were 24 % higher in oceanic waters at ST2 349
(1.91 1012 cells m-2). This winter maximum was linked to thoroughly-mixed cool waters down to
350
>60 m. The maximum Synechococcus abundance at the oceanic stations was generally located 351
shallower than that of Prochlorococcus, i.e. in the upper mixed layer or at the top of the 352
thermocline, except during the Oct 03 cruise when it peaked at the same depth (between 75 and 353
110 m).!
Picoeukaryotes were the least abundant picoplankton organisms (Tables 4 to 6, Fig. 9C). 355
Integrated abundances were more variable at ST2 (factor 6; 0.02 to 0.12 1012 cells m-2) than at
356
ST1 (0.07 to 0.14 1012 cells m-2). At ST3, integrated abundances changed from 0.08 to 0.17 1012
357
cells m-2.Picoeukaryote maxima were consistently found below the thermocline and, therefore,
358
deeper than the Synechococcus maxima, even in Aug 02. 359
360
Large eukaryotes: Large eukaryotes (>10 µm) described by microscopy and made up of 361
dinoflagellates and diatoms (Fig. 10) were generally found together with Trichodesmium in open 362
ocean waters at ST1 and ST2 and, to a lesser extent, at ST3 coastal site. Dinoflagellates showed 363
a maximum of 60 106 cells m-2 during the maximum Trichodesmium abundance in Feb 03 at ST1
364
and ST2 and low abundance (<30 106 cells m-2) at other periods. Diatoms also showed a maximum
365
concentration (412 106 cells m-2) in Feb 03 at ST2 and, to a lesser extent, at ST1. At ST3 coastal
366
site, no data were available in Feb 03, but there was a considerable maximum for both groups (17 367
106 cells m-2 for dinoflagellates; 240 106 cells m-2 for diatoms) in winter (Aug 02). The main
368
diatoms belonged to 1) the Navicula, Nitzschia and Pseudo-nitzschia genera at ST1, 2) the 369
Chaetoceros, Navicula and Pseudo-Nitszchia genera at ST2, 3) the Chaetoceros, Navicula and 370
Rhizosolenia genera at ST3. Rhizosolenia was the main RC host. Among dinoflagellates, 371
protoperidinians were represented at all stations, but few larger cells were found as Ceratium and 372
Amphisiolena species at ST3 in Oct 01. 373
Chlorophyll and phycoerythrin distribution 374
Pigment content (Chla, PE) per cell or per trichome (Table 8) was calculated for Diapalis 375
samples during the Feb 03 cruise at ST1 and ST2, and for a pure sample of T. erythraeum. Mean 376
Chla concentration per trichome was 99 pg cell-1 for pure T. erythraeum while the relationship
377
between trichome numbers and Chla in the >10 µm fraction suggested an upper limit for the mean 378
Chla concentration per trichome of 43 pg for the mixed community of Trichodesmium (Table 8). 379
Considering the diatoms and dinoflagellates in the >10 µm fraction revealed by microscopy and 380
by the presence of a significant quantity of Chlc, the Chla per trichome would be approximately 381
10 % lower (assuming a constant Chlc/Chla ratio of 0.2 for diatoms and dinoflagellates) than this 382
upper limit. Similarly, the PE per trichome (Table 8) was 251pg trichome-1 for pure T. erythraeum
383
and 197 pg trichome-1 for mixed Trichodesmium (Table 8).
384
Regarding phycoerythrin (PE), its fluorescence excitation spectra were typical of PE-385
cyanobacteria according to Neveux et al. (2006) with either Synechococcus or PE-386
Trichodesmium dominating or a clear mixture of both PEs. At ST1 and ST2 stations,! PE-387
Trichodesmium dominated the community in Dec 02 and Feb 03. Integrated Total Chla change 388
showed much less variation across cruises than trichome abundance (Fig. 11). The integrated 389
proportion of Dv Chla to TChla was generally around 20 % in lagoon waters (ST3), 40 %-50 % 390
at ST1 and over 50 % in the Loyalty Channel (ST2). The highest integrated values of PE at ST1 391
and ST2 in Feb 03 (69 mg.m-2, Fig. 11) was linked to the high abundance of Trichodesmium at
392
the surface while the high value in Oct 03 at ST1 was related to a deep maximum of 393
Synechococcus. In Feb 03, PE maxima measured in the upper layer were 4 to >10 times higher 394
than during the other cruises, ranging from 0.61 µg l-1 at ST1 to 1.27 µg l-1 at ST2. In the >10 µm
395
fraction, the PE in the upper layer (data not shown) was exclusively related to filamentous 396
cyanobacteria, mainly Trichodesmium. At ST3 station (Fig. 11), PE was essentially related to 397
Synechococcus and concentrations varied between 0.10 (Apr 02) and 0.62 µg l-1 (Aug 02) at the
398
surface with fairly even vertical distribution. The integrated concentrations varied from 4.30 (Apr 399
02) to 29.26 mg m-2 (Aug 02). The integrated N
2 fixation rate for all species (Garcia et al. 2007)
400
roughly followed the integrated PE pattern (Fig. 11) and are correlated with the integrated 401
trichome concentrations (r2=0.73, N=11).
402 403
C biomass distribution in the microbial community 404
405
The relative contribution of Trichodesmium + Katagnymene (TK) to C biomass of total 406
picoplankton and filamentous cyanobacteria (Fig. 12) was generally high at ST2 with maxima in 407
summer (80 % in Feb 03) and minima in winter (6 % in Aug 02), where TK was replaced by 408
Synechococcus as the major contributor and in Oct 03 with only a few filaments observed. 409
Comparatively, the contribution of TK at ST1 was lower, with a maximum of ~ 50 % in Feb 03. 410
At ST3, Synechococcus was the main contributor to C biomass and the contribution of TK was 411
generally low. At all stations, the contribution of RC to C biomass was negligible over the whole 412
sampling period. Picoeukaryotes may account for a significant portion of the biomass in the 413
lagoon near Ouinne and in winter at all stations. 414
Correlations between groups and environmental variables 415
To determine the impact of environmental variables on the abundance variations of the 417
different phytoplanktonic groups and species, Spearman correlations were calculated between 418
integrated abundances of each filamentous species, integrated nutrients, and depth-averaged 419
temperature and salinity, at each station/cruise (Table 9). Significant positive correlations were 420
found between total trichome abundance, temperature and ammonium and a negative correlation 421
with phosphate, but no significant correlation with MLD (see also Fig. 4). At the species level, 422
RC showed a strong positive correlation with MLD and ammonium, but K. pelagica only with 423
phosphate, while K. spiralis was strongly correlated with all the analyzed nutrients (NOx,
424
phosphate and ammonium). Diatom and picoplanktonic species did not show any correlation with 425
environmental parameters. Inter-species correlations revealed that RC was positively correlated 426
with T. thiebautii and K. spiralis, but not with T. tenue (inversely correlated with T. thiebautii). 427
Dinoflagellates were closely correlated with total trichome abundance and T. erythraeum, but 428
inversely with K. pelagica. No correlations were evidenced between diatoms and the other groups. 429
Finally, Synechococcus and picoeukaryotes showed a positive correlation. ! 430 431 DISCUSSION 432 ! 433
Influence of methodology on enumeration and biomass estimates!
434 435
As part of the effort of collecting biomass and metabolic rates specific to different 436
phytoplankton functional groups, a database on diazotrophic organisms in the global pelagic 437
upper ocean was built by Luo et al. (2012). Variability in counting and sampling procedures, 438
however, hamper comparisons between studies around the world, especially for filamentous 439
cyanobacteria. Significant error in the accuracy of low abundance measurements occurs 440
depending on the sampling mode. In this case, the use of a plankton net increased the detection 441
of Trichodesmium (0.1 against 1 trichome. l-1) by a factor of 10 compared to water samples
442
collected with 2.5 L GO FLO bottles (Chang et al. 2000). When bottle sampling, it is essential to 443
filter all the contents to prevent uneven distribution of Trichodesmium, which can occur when 444
trichomes (and colonies) migrate due to cell-controlled or uncontrolled buoyancy (Bergman et al. 445
2013). When tightly-packed filaments of T. erythraeum are observed at the surface, manual 446
sampling within the first few millimeters of depth with narrow-necked plastic bottles provides a 447
fairly accurate picture of trichome abundance, despite the somewhat uneven distribution.!
Abundance data are usually expressed as cell, trichome or colony numbers with or without 449
specific information on the taxonomic composition of filamentous cyanobacteria. Conversion 450
factors from one unit to another are, however, vague and based on the morphometric variability 451
of filamentous diazotrophs (Luo et al. 2012), such as the number of trichomes per colony, cell 452
numbers per trichome, and trichome dimensions, which are quite variable. For the Diapalis data 453
set, trichome counts of mixed species were linearly correlated (Spearman’s rank coefficient > 454
0.95, p < 0.001) with the estimates of entire surface and total volume of trichomes, as previously 455
pointed out by Neveux et al. (2006). So, replacing trichome numbers with trichome surface areas 456
or volumes did not greatly modify the qualitative vertical distributions or seasonal trends in the 457
filamentous biomass. This indicated a relatively constant composition of the filamentous 458
community. Also, mean T. erythraeum carbon content per trichome (17.22 ng) and per cell (290 459
pg) were determined by our microscope counts. These values were in the upper range of the 460
approximate cell carbon content previously published for Trichodesmium species assuming 100 461
cells trichome−1 (110-250 pg C cell−1
; Luo et al. 2012). Taking the measured value of 290 pg C 462
cell-1 of T. erythraeum (Table 8), TK accounted for up to 80 % of C cyanobacteria biomass in
463
summer at the oceanic station of the Loyalty Channel, which confirms the essential role of 464
filamentous cyanobacteria for the global food chain (Bergman et al. 2013) and in the south 465
western tropical Pacific Ocean (SWTP) (Biegala et al. 2014, Bonnet et al. 2015). 466
467
Comparison of Trichodesmium abundance with other studies 468
! 469
During the Diapalis program, Trichodesmium spp. abundance in the ocean varied from 1 to 470
4578 trichomes l-1 found at 0 to 60 meters (average 586 trichomes l-1, n = 88), which was much
471
higher than previously published data in New Caledonian waters at the end of the summer (250-472
1000 trichomes l-1 in April 1998; Campbell et al. 2005). The only other abundance data available
473
for our region around New Caledonia are nifH gene copies (Moisander et al. 2010). In Ouinne 474
lagoon, a maximum of 1200 trichomes l-1 was found in summer 2007 and more than 10,000
475
trichomes l-1 in accumulations (Rodier & Leborgne 2010). These concentrations are, however,
476
lower than measured in a surface accumulation in the Southwest Lagoon, namely up to 30 106
477
trichomes l-1 for a Chla value of 3 mg. l-1 (Neveux et al. 2009), the highest values reported for the
478
region. Such surface accumulations (>10,000 trichomes l-1) of mixed Trichodesmium species
479
were collected 98 times in summer between New Caledonia and Vanuatu (1998 to 2010: Dupouy 480
et al. 2011, 2017). In the southernmost part of the SWTP at 28°S in the austral summer, Law et 481
al. (2011) observed comparatively low surface Trichodesmium abundance, averaging 11 482
trichomes l-1 in the upper 10 m to 6 trichomes l-1 at 35-50 m. Some high values were found in the
483
Solomons Islands, expressed as trichome number (7700 trichomes l-1; Giraud et al. 2016) or NifH
484
copies (Bonnet et al. 2015). In the Western North Pacific Ocean, abundance was between 1 and 485
400 trichomes l-1 (Marumo & Asaoka 1974, Marumo & Nagasawa 1976, Chen et al. 2003,
486
Shiozaki et al. 2015) with some high values in accumulations (>20,000 filaments l-1) near the
487
Miyako Islands (Shiozaki et al. 2015). 488
Comparing the Diapalis program with other time series conducted on Trichodesmium in 489
subtropical waters raises a number of problems, as a different sampling strategy and sample 490
processing method were used. During the Hawaiian (HOT) and Bermuda Atlantic Time-Series 491
(BATS), Trichodesmium abundance was studied at approximately monthly intervals (HOT= 492
October 1989-December 1992, Letelier & Karl 1996; BATS = 1995-1997, Orcutt et al. 2001) and 493
free trichomes (water filtration sampling) and colonies (net sampling) were counted separately. 494
So, a conversion factor of 200 trichomes per colony used in Orcutt et al. (2001) was applied to 495
HOT and BATS counting data for comparisons with the Diapalis values, as in our study colonies 496
were not counted (disintegrated during the counting) and only trichome abundance is available. 497
This showed that trichome abundances in New Caledonian waters were generally higher than 498
those observed at HOT and BATS stations. In fact, the integrated maxima observed in Feb 03 in 499
the Loyalty Channel (240 106 trichome m-2) were 70 times and 400 times higher than at HOT (3.5
500
106 trichome m-2) and BATS (0.64 106 trichome m-2), respectively. Moreover, mean cell numbers
501
per trichome were generally lower in Diapalis samples (50-60) than at HOT (100). At HOT, apical 502
cells were counted and divided by two to obtain the trichome number (Letelier & Karl 1996). This 503
precaution was not applied to Diapalis samples, leading to a possible overestimation of trichome 504
numbers due to trichome breaking during sample processing. HOT and BATS studies have shown 505
a maximum abundance in summer and relatively strong inter-annual variability, even if free 506
trichome variations at BATS seemed identical from one year to another. At BATS, however, 507
interannual variations deduced from only 7 integrated depth profiles for 3 years fitted by a third-508
degree polynomial function of Julian days (Fig 1A in Orcutt et al. 2001), are questionable. 509
Filamentous diazotroph species and their relationship with environmental factors 510
The SWTP around New Caledonia is a typical warm low-nutrient low-chlorophyll 512
(LNLC) region (Ceccarelli et al. 2013), with phosphate recharged annually (presumably other 513
nutrients as well) in the euphotic zone during the transition periods (Moutin et al. 2005). The 514
phosphate can limit the growth of diazotrophs species and consequently controls nitrogen 515
fixation rates in the ocean (Karl et al. 2002). In LNLC, diazotroph species such as 516
Trichodesmium are better adapted as they are able to use atmospheric N2 (Bergman et al. 2013).
517
Diazotrophs are likely responsible for the lower phosphate concentrations in summer in the 518
region due to their PO4 uptake (Moutin et al. 2005, Shiozaki et al. 2014), which corroborates the
519
negative correlation between Trichodesmium and phosphate found in this study. During 520
Diapalis cruises the ammonium concentrations at ocean stations were only high in February 521
2003 coinciding with the highest concentrations of trichomes, PE and cyanobacteria carbon. The 522
ammonium concentrations also were positively correlated to Trichodesmium densities. 523
Therefore, the relatively high ammonium concentrations may be attributed partially to direct or 524
indirect release of this nutrient by the diazotrophs (Mulholland 2007; Bergman et al. 2013). We 525
did not find any correlation between Trichodesmium abundance and MLD. As stated by Hood et 526
al. (2004), increased Trichodesmium concentrations are linked to a shallow MLD (resulting in 527
high mean light levels) and low dissolved inorganic nitrogen (DIN) concentrations for extended 528
periods of time. The relationship between nitrogen fixation rates in plankton net samples and 529
MLD depth was significantly fitted by a hyperbolic function in the Atlantic Ocean (r2 = 0.31, p
530
< 0.05, n= 18, Agawin et al. 2013). 531
T. thiebautii and T. tenue were the predominant species in the oceanic waters around New 532
Caledonia and in the open lagoon of the east coast, as previously stated in Rodier & Leborgne 533
(2010). By contrast and according to these authors, T. erythraeum dominate in the SW lagoon of 534
New Caledonia, which is a semi-closed and larger lagoon than the SE lagoon. Generally, T. 535
thiebautii and T. tenue are poorly represented in coastal regions (Relevante & Gilmartin 1982). 536
They dominate in the oligotrophic gyre of the Northern Pacific, Western Pacific (Marumo & 537
Nagasawa 1976) and eastern part of the China Sea (Marumo & Asaoka 1974) and are likely better 538
adapted to low-nutrient conditions than T. erythraeum. In our study, T. tenue was inversely 539
correlated with T. thiebautii, which suggests competition between the two species for an 540
apparently similar environment. According to Romans et al. (1994), T. tenue is a common species 541
often confused with T. thiebautii in optical microscopy, which can explain the lack of information 542
on the species’ distribution and quantification. The predominance of T. tenue observed on 543
occasion during the Diapalis cruises is a relatively original finding. In this study around New 544
Caledonia, T. contortum and T. hildebrandtii occur in very low densities as in most oceans 545
(Bergman et al. 2013). 546
Information on Katagnymene species in the field is very scarce. They are mentioned in the 547
Southwestern Pacific (Lundgren et al. 2001, Dupouy et al. 2011, Giraud et al. 2016). Both 548
Katagnymene species, K. pelagica and K. spiralis, should now be considered as two 549
morphological forms of the same species (Lundgren et al. 2005). In our study, both forms are 550
frequently observed, but always in low abundance <284 trichomes l-1. The strongest
551
concentrations were observed in the first 40 meters, although a deeper maximum (60 m) was 552
found in the Loyalty Channel in Feb 03. At this maximum, the K. spiralis form accounts for 81 553
% of the Katagnymene genus. Along the Revelle cruise track between New Caledonia and the Fiji 554
Islands (April 1998), Lundgren et al. (2001) found both Katagnymene forms at 34 of the 51 555
stations and counted up to 400 trichomes l-1 of Katagnymene in the 0-25 m layer, with 89 % K.
556
pelagica. It should be noted that Katagnymene trichomes are generally long (1 cm) and extremely 557
fragile and can be broken up by handling before counting; hence the recommended use here of 558
surface and total volume for biomass estimates.The significant relationship of K. spiralis with all 559
nutrients, while K. pelagica was correlated only with phosphate, may indicate a different 560
ecological niche for these two species. 561
Like Trichodesmium and Katagnymene, the heterocystous Richelia intracellularis is 562
widespread in warm tropical and subtropical waters (Luo et al. 2012, Bonnet et al. 2015), whereas 563
Calothrix rhizosolenia, as epibionts of Chaetoceros, have been observed in the Indian and 564
Western Pacific Oceans (Sarma 2012, Giraud et al. 2016). Around New Caledonia in this study, 565
both Richelia and Calothrix species (RC groups) were sometimes present as free-living 566
organisms, but more frequently in endosymbiotic association with diatoms (mainly in 567
Rhizosolenia sp.). RC were present in all seasons with a maximum (>700 trichomes l-1) in the
568
Loyalty Channel in summer (Feb 03), as was Trichodesmium. Based only on samples where RC 569
was detected, its biomass correlated with the number of diatoms in the >10 µm fraction (Spearman 570
rank correlation between 0.52 and 0.57, p < 0.0001; data not shown). In endosymbiosis, the host 571
cell provides a protective micro-environment and positive buoyancy to the symbiont, which 572
enables the cell to remain in the euphotic layer, as, unlike Trichodesmium, this species does not 573
have gas vacuoles (Janson et al. 1999). Richelia has a very uneven space distribution in the oceans, 574
like Trichodesmium, depending on whether the environment is conducive to their growth. Both 575
genera often inhabit the same types of ecosystems, as they have similar physiological properties, 576
like all diazotrophs (Bergman et al. 2013 and references therein). In the case of cyanobacteria-577
diatom associations, environmental conditions must meet the needs of both organisms, and 578
particularly sufficient silicate concentration for the diatom host growth. Iron and silica were not 579
limiting factors in our area of study and are provided by leaching from terrestrial soils (Shiozaki 580
et al. 2014). In our study, RC was more correlated with T. thiebautii and K. spiralis, and its 581
positive dependence on the density structure of the water column (MLD) and ammonium needs 582
to be further explored. In the Northern Pacific Gyre, the greatest abundance in Richelia 583
intracellularis is also observed in summer, when the species can form blooms of about 104
584
filaments per liter (Venrick 1974), values which are thus greater than ours (max 734 filaments l
-585
1). Around the Hawaiian Islands (Sohm et al. 2011), a high abundance of all three groups, i.e.
586
Trichodesmium, Katagnymene and Richelia, was reported in late boreal summer 2002 (Sep-Oct) 587
and summer 2003 (July-Aug), with Richelia-diatom associations more abundant to the south of 588
the islands. The high variability in Richelia size in our samples is another reason to underline the 589
inaccuracy of biomass measurements in terms of filament numbers rather than total filament 590
surface area or volume. The contribution of RC in terms of volume (or carbon) was minor (<1 %) 591
but must not mask the great impact of this species on carbon sequestration by DDA’s as shown 592
in the North Tropical Pacific (Dore et al. 2008, Karl 2014; Karl & Church 2014). 593
In our study, large diatoms did not show significant correlations with any of the other groups 594
enumerated nor with any of the environmental variables. Dinoflagellates correlated positively 595
with total trichome abundance. Their positive correlation with the percentage of T. erythraeum 596
and their negative correlation with the percentage of K. pelagica, suggested affiliation to more 597
coastal than oceanic environments. The diversity of trophic status in dinoflagellates 598
(photosynthetic, mixotroph, heterotroph) was, nevertheless, not considered in the analysis. In the 599
Northern Tropical Pacific, the dinoflagellate group revealed no specific ecological pattern nor any 600
characteristic assemblages (Giraud et al. 2016). During the Diapalis cruises, the picoplanktonic 601
groups did not show any correlation with environmental parameters (Table 9), which was 602
surprising, as Synechococcus and Prochlorococcus have distinct ecophysiology, Synechococcus 603
being better adapted to mesotrophic conditions and Prochlorococcus to oligotrophic conditions 604
(Partensky et al. 1996). This could be explained for Prochlorococcus by the fact that their 605
abundance varied little over the annual cycles. Prochlorococcus never dominated the 606
phytoplankton C biomass, but were often the second contributor to C biomass after filamentous 607
cyanobacteria in oceanic waters (Fig. 12). All phytoplankton share a requirement for light and 608
nutrients. A more specific mechanism underlying the covariation between Synechococcus and the 609
picoeukaryotes, as opposed to Prochlorococcus, is that they have a larger cell size than the latter, 610
and are able to use nitrate. This could explain they tend to respond positively to enhanced nutrient 611
supply as observed mostly in the lagoon station and at Santal Bay. The covariation between 612
Synechococcus and the picoeukaryotes has been described before in the Atlantic subtropical gyres 613
(Marañón et al. 2003) and in the Pacific Ocean (Worden et al. 2004). The significant positive 614
correlation between Synechococcus and picoeukaryotes may also occur due to similarities in 615
favorable light conditions (Gutiérrez-Rodríguez et al. 2016). Synechococcus and picoeukaryotes 616
dominated the C biomass in the lagoon, but may also be large contributors in oceanic waters, as 617
observed in winter (Fig. 12). 618
619
2001-2003 Inter-annual variability 620
621
The difference in large diazotroph abundance (and nitrogen fixation rates, Garcia et al. 622
2007; Fig. 12C) observed between the summers of 2001-2002 and 2002-2003 could be the result 623
of a relatively low in situ sampling frequency. Satellite imagery nevertheless confirmed the very 624
low chlorophyll values during summer 2001-2002 compared to summer 2003 (Dupouy et al. 625
2011). Moreover, satellite-classified Trichodesmium pixels in the region 5°S-25°S, 160°E-170°W 626
determined using the TRICHOSAT model were clearly lower in summer 2001-2002 (La Niña 627
years) than summer 2003 (an El Niño year). The spectral fluorescence signature of surface blooms 628
as measured by the MERIS sensor (Gower et al. 2014) was also high during El Niño summers 629
(2003, 2007, 2010) but low during La Niña summers. The difference in cumulative precipitation 630
between 2001-2002 and 2003 summers is striking, with 2003 being drier despite the occurrence 631
of two tropical storms, namely Beni in January 2003 and Erica in March 2003 (Neveux et al. 632
2009). Law et al. (2011) reported that nitrogen fixation increased owing to an iron supply from a 633
wet-dust deposition 8 days after Tropical Cyclone Wati in the Tasman Sea. Australian dust 634
peaking in 2001 and 2002 was cited as a potential factor in increasing occurrence in the seas to 635
the east of Australia (estimated by satellite) in 2001-2005 (Mackie et al. 2008). The regional 636
distribution of aerosols was probably also influenced by the continuous passive (non-explosive) 637
volcanic degassing of the Melanesian Volcanic Arc, as indicated by sulfur dioxide (SO2), the
638
composition of which has been analyzed using satellite data and modelling (Lefèvre et al. 2015). 639
Likewise, Sahara dust deposition at BATS corresponded to an increased abundance of 640
Trichodesmium colonies as well as changes in their chemical composition, even though it did not 641
enhance the N2 fixation rate per colony (Orcutt et al. 2001). At BATS, inter-annual variability
642
could also be related to the relative extent of vertical mixing from one year to another, including 643
the effects of hurricane frequency, which would reduce Trichodesmium abundance (Orcutt et al. 644
2001). During the Diapalis program, this negative vertical-mixing effect was not confirmed, as 645
the highest Trichodesmium abundance occurred just after Tropical Storm Beni struck New 646
Caledonia in Late January 2003. Inter-annual variability would also have been related to changes 647
in main-current transports, i.e. a westward Sverdrup transport and trade winds enhanced during 648
El Niño periods as against falling Sverdrup transport and strengthening northwesterly winds 649
during La Niña (Kessler & Cravatte 2013; Cravatte et al. 2015).!Wind regime, which may impact 650
mixed-layer formation is known to alternate around New Caledonia with a trade-wind regime 651
during El Niño and more westerly winds during La Niña, which may increase surface currents in 652
the Loyalty Channel (Lefèvre et al. 2010). How such large-scale current variability or atmospheric 653
composition influence total biomass and Trichodesmium abundance in New Caledonia is not clear 654 yet.!! 655 ! 656 CONCLUSION 657 658
In 2001-2003, the seasonal and inter-annual variations in cyanobacteria abundance were 659
investigated in New Caledonian waters during the 9 Diapalis program cruises. Three sites 660
representative of different biotopes were sampled, i.e. open ocean (Loyalty Channel), coastal 661
(lagoon off the Ouinne River estuary) and deep bays (Santal Bay at Lifou). Abundance was 662
determined at the species level for diazotrophic filamentous cyanobacteria. Our description of the 663
organisms (RC and diatoms) in symbiotic associations was well detailed. Filamentous 664
cyanobacteria were practically always present throughout the year, but with relatively high 665
variations. The highest abundances occurred during the summer seasons. The dominant species 666
were Trichodesmium thiebautii and T. tenue, followed by T. erythraeum. Katagnymene as well as 667
Richelia species (mainly endosymbiotic in diatoms), which were consistently present in low 668
abundance. Microscopic examination also revealed the presence of unknown filamentous species 669
formed by round-shape cells not yet described by molecular tools. Picoplanktonic cyanobacteria 670
(Prochlorococcus and Synechococcus) were consistently present in abundance with less 671
pronounced seasonal variations than filamentous cyanobacteria. Trichodesmium dominated in 672
terms of carbon content in the Loyalty Channel and Santal Bay in summer, while Synechococcus 673
dominated at the Ouinne station and in winter at all the three stations. The comparison of the 2002 674
and 2003 summers showed major inter-annual variability. Environmental factors that could 675
explain this variability were not clearly identified. One hypothesis could be the effects of 676
alternation between La Niña and El Niño with maximum diazotrophs and Trichodesmium 677
abundance during a well-established El Niño. Some hypotheses relating to the El Niño/La Niña 678
cycle need verifying, i.e. dust inputs and links with precipitations, winds, vertical movements and 679
horizontal circulation within the upper 200-meter layer, gyre formation in relation to wind 680
strength and direction and increased mesoscale circulation. 681
682
Acknowledgements. Abundance and pigment data were acquired during 9 cruises between 2001 683
and 2003 under the DIAPAZON (DIAzotrophie PAcific ZONe) research program on the 684
biogeochemical environment of filamentous abundance and diazotrophy in the waters of the New 685
Caledonian island group. We are grateful to Aubert Le Bouteiller, head of the DIAPAZON 686
program, IRD, INSU PROOF (Programme national étude des PROcessus biogéochimiques dans 687
l'Océan et Flux). The authors also wish to acknowledge the captains and crews of the R/V IRD 688
Alis as well as everyone who took part in the nine cruises. We are indebted to Meteorologie 689
Nationale for precipitation and air temperature data on Thio-Plateau. Special thanks go to Philippe 690
Gérard for nutrient analyses and LAMA (US IMAGO). Our sincere gratitude also goes to the IRD 691
Noumea Center administrative staff for their support throughout this three year program. 692
693
LITERATURE CITED 694
Agawin, NSR, Tovar-Sanchez A, Knoth De Zarruk K, Duarte CM, Agusti S (2013) Variability 695
in the abundance of Trichodesmium and nitrogen fixation activities in the subtropical NE 696
Atlantic. J Plankt Res 35(5):1126–1140 697
Bergman B, Sandh G, Lin S, Larsson J, Carpenter EJ (2013) Trichodesmium – a widespread 698
marine cyanobacterium with unusual nitrogen fixation properties. FEMS Microbiol Rev 699
37:286-302 700
Biegala IC, Raimbault P (2008) High abundance of diazotrophic picocyanobacteria (<3 µm) in a 701
Southwest Pacific coral lagoon. Aquat Microb Ecol 51(1):45-53 702