HAL Id: hal-02124943
https://hal.sorbonne-universite.fr/hal-02124943
Submitted on 10 May 2019
HAL is a multi-disciplinary open access
archive for the deposit and dissemination of sci-entific research documents, whether they are pub-lished or not. The documents may come from teaching and research institutions in France or abroad, or from public or private research centers.
L’archive ouverte pluridisciplinaire HAL, est destinée au dépôt et à la diffusion de documents scientifiques de niveau recherche, publiés ou non, émanant des établissements d’enseignement et de recherche français ou étrangers, des laboratoires publics ou privés.
Performance of Visual-to-Auditory Sensory Substitution
Devices Used by Blind Adults
Galit Buchs, Benedetta Heimler, Amir Amedi
To cite this version:
Galit Buchs, Benedetta Heimler, Amir Amedi. The Effect of Irrelevant Environmental Noise on the Performance of Visual-to-Auditory Sensory Substitution Devices Used by Blind Adults. Multisensory Research, Brill, 2019, 32 (2), pp.87-109. �10.1163/22134808-20181327�. �hal-02124943�
The Effect of Irrelevant Environmental Noise on the
Performance of Visual-to-Auditory Sensory Substitution
Devices Used by Blind Adults
Galit Buchs1,∗, Benedetta Heimler2,3and Amir Amedi1,2,3,4,∗
1
Department of Cognitive Science, Faculty of Humanities, Hebrew University of Jerusalem, Hadassah Ein-Kerem, Jerusalem, Israel
2
The Edmond and Lily Safra Center for Brain Research, Hebrew University of Jerusalem, Hadassah Ein-Kerem, Jerusalem, Israel
3
Department of Medical Neurobiology, Institute for Medical Research Israel-Canada, Faculty of Medicine, Hebrew University of Jerusalem, Hadassah Ein-Kerem, Jerusalem, Israel
4
Sorbonne Universités UPMC Univ Paris 06, Institut de la Vision Paris, France Received 2 May 2018; accepted 30 November 2018
Abstract
Visual-to-auditory Sensory Substitution Devices (SSDs) are a family of non-invasive devices for vi-sual rehabilitation aiming at conveying whole-scene vivi-sual information through the intact auditory modality. Although proven effective in lab environments, the use of SSDs has yet to be systemati-cally tested in real-life situations. To start filling this gap, in the present work we tested the ability of expert SSD users to filter out irrelevant background noise while focusing on the relevant audio information. Specifically, nine blind expert users of the EyeMusic visual-to-auditory SSD performed a series of identification tasks via SSDs (i.e., shape, color, and conjunction of the two features). Their performance was compared in two separate conditions: silent baseline, and with irrelevant background sounds from real-life situations, using the same stimuli in a pseudo-random balanced design. Although the participants described the background noise as disturbing, no significant per-formance differences emerged between the two conditions (i.e., noisy; silent) for any of the tasks. In the conjunction task (shape and color) we found a non-significant trend for a disturbing effect of the background noise on performance. These findings suggest that visual-to-auditory SSDs can indeed be successfully used in noisy environments and that users can still focus on relevant auditory infor-mation while inhibiting irrelevant sounds. Our findings take a step towards the actual use of SSDs in real-life situations while potentially impacting rehabilitation of sensory deprived individuals.
*To whom correspondence should be addressed. E-mail: galit.buchs@mail.huji.ac.il;
amira@ekmd.huji.ac.il
©Buchs et al., 2018 DOI:10.1163/22134808-20181327 This is an open access article distributed under the terms of the prevailing CC-BY license at the time of publication.
Keywords
Blindness, sensory substitution, sensory loss, background noise, environmental sounds, cocktail party
1. Introduction
There are over 250 million visually impaired individuals worldwide, and over 36 million blind individuals (World Health Organization, 2018). Recent decades, owing to the accelerated advances in biotechnology, have brought a tremendous increase in the development of rehabilitation approaches. These aim to provide visually impaired individuals with the missing sensory informa-tion, ultimately seeking to boost their independence in society. Rehabilitation methods can be divided between invasive and non-invasive approaches.
Invasive techniques aim to restore the function of the peripheral visual sys-tem, for instance, via implantation of artificial retinas in the human eye (Ahuja
et al., 2011; Chader et al., 2009; Collignon et al., 2011; Djilas et al., 2011;
Humayun et al., 2012; Wang et al., 2012; Zrenner et al., 2011), via gene ther-apy (Busskamp et al., 2010) or transplantation of photoreceptors (Yang et al., 2010). Even with the aforementioned progress in biotechnology, such tech-niques for visual rehabilitation do not yet provide a satisfactory outcome (e.g., limited field of view and poor resolution) (Heimler et al., 2015). Furthermore, each of these methods (e.g., gene therapy, retinal implant) is suited only for the recovery from specific types of blindness [e.g., retinal prostheses are ap-propriate only for people with Retinitis Pigmentosa (Hartong et al., 2006)].
Non-invasive rehabilitative approaches, on the other hand, strive to provide the missing sensory information via other, intact, senses. In recent decades, for instance, much research has been conducted using a specific type of non-invasive rehabilitation procedure namely, visual-to-auditory Sensory Substi-tution Devices (SSDs) which convey the missing visual information through the intact auditory channel via predetermined algorithms that can be learned by the users (Bach-y-Rita et al., 1998; Meijer, 1992; Proulx et al., 2015). It has been shown that, after training, visual-to-auditory SSD users are able to perform a variety of ‘visual’ tasks such as object recognition and localization (Proulx et al., 2008; Striem-Amit et al., 2012a), as well as navigation in virtual environments (Maidenbaum et al., 2016), among many other tasks (Maid-enbaum, Abboud and Amedi, 2014; Ward and Meijer, 2010). Additionally, visual-to-auditory SSDs have been successfully used for teaching inherently visual concepts to blind users such as color perception (Abboud et al., 2014) or visual parsing (Reich and Amedi, 2015), and with their use individuals obtained a visual acuity level beyond blindness threshold in standard visual acuity tests (Levy-Tzedek et al., 2014; Striem-Amit et al., 2012b). Interest-ingly, these specific visual skills are otherwise hard to regain in individuals
who had limited or no visual experience during development, as reported by studies testing those same abilities in visually restored adults (Ackroyd et al., 1974; Carlson et al., 1986; Gregory and Wallace, 1963; Levin et al., 2010). These latter results and considerations suggest, in turn, that SSDs could also be used in conjunction with the constantly developing invasive approaches as rehabilitative tools to maximize visual recovery (Heimler et al., 2015).
Nevertheless, the aforementioned promising SSD-related results have been achieved mainly in monitored, silent environments for research purposes, and have not been systematically tested for real-life applications nor consistently adopted as an auxiliary tool for everyday use by blind individuals (Hamilton-Fletcher et al., 2016; Ward and Meijer, 2010). So why, despite the very en-couraging results obtained in the labs, have SSDs not been widely adopted by the blind community? Among other issues that have been reported, there is the widespread disbelief in the suitability of visual-to-auditory SSDs in the real-world environment due to the difficulties users might face when trying to interpret soundscapes in noisy environments (Elli et al., 2014).
In the present work, we address exactly this issue by comparing accuracy and response times of blind users performing an identification task in a quiet
versus a noisy condition using the EyeMusic visual-to-auditory SSD (Abboud et al., 2014). In the experiment we deliver the auditory output of the EyeMusic via bone-conduction. In this way, the output of the EyeMusic does not block
the users’ auditory pathway, thus enabling them to still hear their surround-ings while perceiving the visual environment via audition. What will happen when the auditory channel is loaded with irrelevant auditory background noise alongside the relevant audio input received via visual-to-auditory SSDs? Will users be able to interpret the SSD sounds only in conditions without auditory interference or will they be able to perceive the relevant stimuli also in situa-tions in which the intact auditory sense is exposed to competing but irrelevant information? In other words, will visual-to-auditory SSD users be able to focus on the relevant SSD input, thus perceiving the conveyed visual scene, while successfully ignoring the irrelevant audio information in the background? As in the cocktail-party effect, in which people at a party succeed to pay attention to the voice of the person they are speaking with while disregarding all of the other irrelevant sounds (Bronkhorst, 2015; Cherry, 1953), we here hypothesize that blind visual-to-auditory SSD users will be successful in the perception of the SSD sounds in the presence of irrelevant background noise. This is in addition to the documented superior ability of blind individuals to finely dis-tinguish between auditory cues compared to their sighted peers (Collignon
et al., 2006; Hugdahl et al., 2004). Although we predict the blind
visual-to-auditory SSD users to be successful in the perception of the visual stimuli in the presence of noise, we expect their success rate in the noise condition to
Table 1.
Participants information, including participant number, age and gender, age of blindness onset and cause of blindness. All blind participants were expert EyeMusic users with more than 50 h of training with the device
Participant Age (years) & gender Age of blindness onset (years) Severity of blindness Cause of blindness
1 26 F 0 Total blindness Unknown
2 38 F 25 Total blindness Eye surgery which harmed the retina
3 33 F 0 Distinguishes
between light and shadow
Unknown
4 41 F 0 Total blindness Congenital rubella
5 40 M 0 Total blindness Retinopathy of
prematurity
6 28 F 0 Detects light Retinopathy of
prematurity
7 41 F 0 Distinguishes
between light and shadow in strong contrast
Leber’s syndrome
8 39 F 3 Total blindness Retinoblastoma
9 55 M 44 Total blindness Retinitis Pigmentosa
decrease, as the participants’ auditory channel will be additionally loaded in this condition.
The findings of this initial study on this important issue will potentially shed further light on the suitability of visual-to-auditory SSDs for daily life, and pave the way for additional studies on this topic, raising the awareness of both blind individuals and rehabilitative instructors to the feasibility and usability of such devices for rehabilitation.
2. Methods
2.1. Participants
A total of nine blind individuals completed this experiment (two male), six with congenital blindness, one who lost her vision at the age of 3, and two late-blind participants who lost their eyesight at the ages of 25 and 44. The average age of the participants was 38± 8.52 years (mean ± SD) (see Table 1 for participants’ detailed information). All of the participants were expert Eye-Music users with over 50 hours of training.
This experiment was conducted in accordance with the Helsinki declaration and all participants signed their informed consent.
2.2. Equipment
2.2.1. The EyeMusic SSD
The EyeMusic visual-to-auditory SSD transforms visual images into audio soundscapes (Abboud et al., 2014; Levy-Tzedek et al., 2012). This transfor-mation preserves colors, shapes, and location infortransfor-mation. Five colors, white, blue, yellow, green and red, are mapped to different musical instruments. Black, the sixth color, is mapped to silence. The x-axis is mapped to the time domain, such that parts in the left of the image are heard before parts on the right. Height is conveyed via pitch; such that high pixels have a higher pitch than lower ones (see Fig. 1, and Supplementary Fig. S1). The notes of the Eye-Music ranged from 65 Hz to 1760 Hz, with an intensity range of 10–70 dBV.
2.2.2. Audio Features and Set-up
Users heard the EyeMusics’ audio stimuli via bone-conductance headphones, connected to a laptop computer, thus leaving their auditory pathway open. The auditory volume of the EyeMusic’s output was set according to the user’s pref-erence in silence before the experiment began. This was not further adjusted later on in the experiment.
The background noise, for the noisy condition, was played through an iPad connected to speakers situated at the end of the desk in front of the participant, at a distance of up to a meter. The audio volume of the background noise (at the speakers) was set for each individual to be approximately 70 dB. This was measured through the ‘SoundMeter’ iOS application (Kardous and Shaw, 2014) at the beginning of the recording, and participants could not adjust it. We chose a background noise level of 70 dB, namely the approximate noise level that can be observed in a home environment. Note that conversational speech, office noise and background music are usually at a level of 60 dB.
2.3. Stimuli
2.3.1. Visual Stimuli
We used two hollow geometrical shapes, a triangle and a trapezoid, in two ori-entations, upright and flipped (see Fig. 1B). These shapes, all spanning half of the image, consisted of similar characteristics; diagonal lines with a descend-ing and declindescend-ing slope and a horizontal line. These lines varied in length and order between the four shapes (e.g., the trapezoid had shorter diagonal lines than the triangle). Each of these features appeared in at least two of the shapes (e.g., the long high horizontal line appeared in the two flipped shapes; trapezoid and triangle). These fine differences between shapes ensured that participants truly recognized the geometrical shape as they could not differen-tiate them according to a specific feature.
Figure 1. Experimental procedure and EyeMusic demonstration. (A) Familiarization session:
participants were introduced to the four experimental shapes and colors. During the shape train-ing, each shape was gradually built. Here we depict an example of gradually building the triangle via the EyeMusic. During the color training participants were introduced to the four experimental colors (red, blue, yellow, white) using only diagonal or horizontal lines. (B) Ex-periment stage 1 included baseline test and exEx-periment test. In the baseline test participans heard a stream of colored shapes via bone-conducting headphones and were required to identify their shape and color. During the experiment, participants needed to identify either a specifc shape, a specific color or a specific shape presented in a specific color (conjuction of features) in sep-arate experimental blocks. Three blocks were performed without and three with background noise. (C) Intense training included comparison of pairs of stimuli to imporve the identification skills of participants. (D) Experiment stage 2: second baseline test and repeated experiment test.
These four shapes could appear in four colors: white, red, blue and yellow. This altogether generated a pool of 16 stimuli (see Fig. 1B for a stimuli sam-ple). In each trial, only one of the four geometrical shapes appeared, spanning the left half of the stimulus area, while the other half was black, resulting in silence. The audio reproduction of each stimulus lasted 1.25 s, followed by 1.25 s of silence.
During training, participants learned to identify the four shapes presented to them in the green color, i.e., a different color from those used in the experi-ment.
2.3.2. Auditory Background Noise
The background noise was taped from a working area in the university. This noise consisted of people speaking, typing and other natural back-ground noises. This noise varied in intensity, similar to natural changes in real-life background noise intensity changes. Using SpectraLab software (http://www.spectraplus.com/), processing the entire audio file (size 16 bits, Hanning smoothing window, with an exponential scale), we observed that, indeed like typical background noise, our recording covered the audio spec-trum resulting in broad-band noise (0–20,000 Hz). This background-noise also fluctuated in intensity (30–110 dBV). A peak in intensity was noticed at 20 Hz, 40 Hz and a slight rise in intensity between 400 Hz to 600 Hz (see Supplementary Fig. S1).
2.4. Procedure
The experiment included six parts: task familiarization (∼10 min), baseline test (∼7 min), experimental task (∼15 min), intensive training (∼15 min), baseline test repetition (∼4 min) and experimental task repetition (∼15 min). After completing the experiment, participants answered a short survey regard-ing their experience of the experiment. The entire experiment lasted approxi-mately 90 min.
2.4.1. Task Familiarization
The experimental session started with a task familiarization phase that in-cluded two separate parts: learning the geometrical shapes and learning the colors appearing in the experimental test (see Fig. 1). The whole familiariza-tion procedure lasted approximately 10 min. In the geometrical shape training the participants first were familiarized with the four shapes through the hap-tic modality. They were presented with one tactile shape at a time and their task was to verbally identify it. The experimenter helped in this process when needed. After the first presentation of the four shapes, the experimenter pre-sented the tactile shapes randomly and participants needed to say each time which of the four shapes they were touching. During this part, participants re-ceived feedback on their responses. This part ended when the participants were
able to correctly identify all four geometrical shapes via touch. After ensuring understanding of those shapes in the haptic domain, participants were intro-duced to the shapes via the EyeMusic. This introduction was done gradually, by building up the shapes line by line (see Fig. 1A). The shapes were intro-duced in the following order: Triangle, trapezoid, flipped triangle and flipped trapezoid. In this phase, the shapes were presented in green, a color that did not appear later in the experiment (see Fig. 1A). After gradually building the four green shapes, they were presented randomly and participants were asked to recognize them while receiving feedback on their responses. This shape fa-miliarization task ended when participants were able to correctly recognize all four green shapes.
Color training (blue, yellow, red and white): for this training we presented horizontal and diagonal lines in the aforementioned four colors via the Eye-Music. First, all the diagonal and horizontal lines were presented individually, in each of the colors. Then, to ensure differentiation of the four colors, var-ious horizontal lines of different heights and colors were presented in pairs for comparison (see Fig. 1A) and participants were asked to verbally indicate the color of each line, while receiving feedback for their answers. The color familiarization task ended when participants were able to differentiate among the four colors.
2.4.2. Baseline Test
The baseline test measured participants’ knowledge of the shapes and their colors appearing later in the experiment. It lasted approximately 7 min and it was performed at the end of the familiarization phase. This test was programmed and executed using ‘Presentation’ neurobehavioral systems (https://www.neurobs.com/). The participant heard a stream of colored shapes, each with a duration of 1.25 s, followed by 1.25 s of silence. For each stimu-lus they were tasked with identifying the color and shape (the shape and color didn’t influence each other). Using the keyboard space bar button, participants signaled they recognized the stimulus; this registered their response time, and their verbal response describing the stimulus was then recorded by the exper-imenter. Participants did not receive any feedback on their responses. There was no time limit for response, and each stimulus was repeated until partici-pants’ key press. This test included a total of 32 stimuli, ensuring each shape appeared eight times, twice in each color, and each color appeared eight times. This test included two order variations of the stimuli. One order was used for the test after the familiarization session, and the second order was used to measure participants’ success and response time after the intense training (see section 2.4.4).
2.4.3. Experimental Task
The experimental task lasted approximately 15 min. This task was also programmed and executed using ‘Presentation’ neurobehavioral systems (https://www.neurobs.com/). Before starting the experimental task, partici-pants underwent a short training regarding the task and the response buttons. This included two short blocks of 16 trials each. These blocks consisted of horizontal and diagonal lines presented in the four experimental colors. Each block had an identification task on color or shape (red/blue/white/yellow col-ors; horizontal/diagonal lines). The identification was done using the same keyboard keys used later in the test itself (see next paragraph for exact de-tails).
After this short training, participants performed the experimental task which was a double-blind identification task (regarding the stimuli presented) com-posed of six blocks, the first three blocks in a quiet condition, and the last three blocks in a noisy condition, i.e., with background noise. In every block, in both conditions, participants heard a stream of 80 random stimuli and their task was to identify each stimulus as target/non-target as fast and as accurately as possible. Participants were not told there would also be noise blocks, thus the first noise block came as a surprise. In each block 25% of the stimuli were targets, while the other 75% were non-targets. Each stimulus was repeated un-til participants’ key press. Responses were given using the left and right arrow keys, the use of which was counter balanced amongst participants for target and non-target. The keypress measured the response time from stimuli onset to participant’s response.
Each of the three blocks in both conditions (quiet; noise) had a different identification task, according to a specific feature: shape, color or their con-junction. In the shape task, target stimuli were those of a specific shape, e.g., upright triangles irrespective of their color. Targets in the color task were de-fined according to a specific color, e.g., all red shapes. In the conjunction task, the target stimulus was a specific shape in a specific color, e.g., white flipped-trapezoid. Each of the six different blocks (three quiet blocks; three noisy blocks) had a unique target that did not repeat itself as a target in a dif-ferent block, e.g., if upright triangles were the target stimuli in the shape task in the quiet condition, they were not targets in any other block. This ensured each of the four shapes and colors appeared as a target in one of the blocks.
For each individual participant the order of the tasks: shape, color and con-junction, was the same in both the quiet and noisy condition. The internal order of tasks and the targets in the different blocks varied between participants.
Note that the experimental task was repeated again after the second baseline test following the intense training session (see next section 2.4.4).
2.4.4. Intense Training
After the experimental task ended, participants underwent a session of spe-cific training on all of the 16 shapes that appeared in the experiment. First, the experimenter randomly chose four different shapes in different colors. These shapes were presented to the participants who needed to classify both the shape and color, while receiving feedback.
Following this, participants were tasked with recognizing shapes and colors of the stimuli, which appeared in pairs. These pairs of stimuli enabled partic-ipants to compare the shapes and colors to better understand the fine details and differences (see Fig. 1C).
This training lasted on average approximately 15 min, and was declared complete once participants successfully recognized four subsequent pairs of stimuli (shapes and colors).
2.4.5. Short Survey
After completion of the experiment participants were asked a few questions regarding their experience. This survey included a specific open question re-garding the perceived difficulty level of the different tasks, and they were questioned to report which tasks or assignments were harder than the others.
At a later date (1–6 months following the experiment) participants were contacted and asked to also scale how disturbing the background noise was on the task (Likert 1–5 scale, 1 ‘not disturbing at all’, 5 ‘very disturbing’).
2.5. Statistical Analysis
All analyses of the results, both for response times and accuracy were per-formed using Wilcoxon signed-rank tests. Significant p-values were corrected using the Bonferroni method for multiple comparisons.
In the reaction times analysis, we included only the reaction times of cor-rect responses. For each participant in every condition, we removed outlier trials defined as trials in which the response times were longer or shorter than three standard deviations from the average response time of that participant. Altogether, we removed 2% of the reaction time responses (out of a total of 7971 trials). Our cut-off for including participants in the analyses was that the average response time of each participant was not shorter or longer than three standard deviations from the group mean. All participants fell inside this criterion.
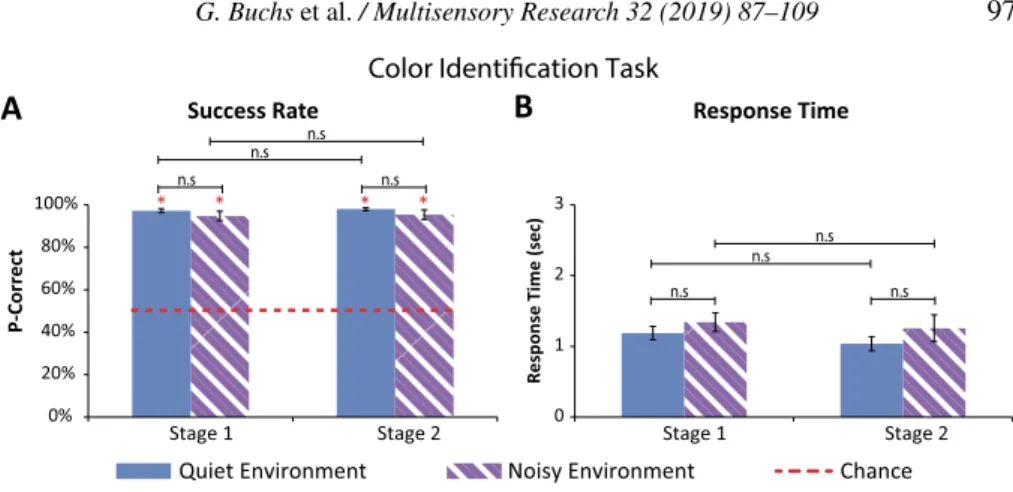
Figure 2. Results for the color identification task (error bars represent the standard errors). (A)
Success rate: the average success rate for both conditions (quiet and noise) in both experimen-tal stages (Stage 1: before intense training; Stage 2: after intense training) was significantly higher than chance level (red asterisks). No significant difference emerged between the condi-tions or between stages. (B) Response time: no significant difference emerged in the response times between the two conditions (quiet and noisy) nor between the two experimental stages (before/after intense training).
3. Results
3.1. Success Rate and Response Time — Quiet vs. Noise in the Color Identification Task
3.1.1. Success Rate
Participants’ average success rates in the color identification task in both con-ditions (i.e., quiet and noisy) and in the two stages (i.e., before and after intensive training) was over 94%. These success rates were all significantly higher than a chance level of 50% (all p-values < 0.01, after Bonferroni cor-rection). No significant difference emerged between the success rates in the quiet condition compared to the noisy condition (all p-values > 0.25). Further-more, no significant difference emerged between participants’ success rate in the quiet and noisy conditions between the first and second experimental stage (all p-values > 0.68) (see Fig. 2A).
Specifically, in the first experimental stage of the color identification task, participants’ average success level in the quiet condition was 97± 3% (aver-age± standard deviation), this was not significantly higher than their success in the noisy condition in which participants successfully identified 94± 7% of the stimuli (p= 0.32) (see Fig. 2A).
In the second experimental stage, participants successfully identified 98± 2% of the stimuli in the quiet block. This average success rate was not signif-icantly higher than their success in the noisy block, with an average success
rate of 95 ± 7% (p = 0.25). No significant difference emerged between par-ticipants’ success rate in the two stages of the experiment, both in the quiet condition (p= 0.68), and in the noisy condition (p = 0.68) (see Fig. 2A).
3.1.2. Response Times
Participants’ average response times (RTs) in this task for both conditions (i.e., quiet and noisy), in the two stages (i.e., before and after intensive training) was no longer than 1.29 s. No significant difference was found between RTs in the quiet condition compared to RTs in the noisy condition (all p-values > 0.35). Furthermore, no significant difference emerged between RTs in the two experimental stages (all p-values > 0.09) (see Fig. 2B).
Specifically, in the first experimental stage, participants’ average RT in the quiet condition was 1.19 ± 3.1 s (average ± standard deviation). This was not significantly quicker than RT in the noisy condition in which participants’ average RT was 1.28± 3.9 s (p = 0.57) (see Fig. 2B).
In the second experimental stage, participants’ average RT was 1.04± 3.3 s in the quiet condition. This RT rate was not significantly quicker than RT in the noisy condition (average RT: 1.23 s; SD= ±6.2; p = 0.35). No signifi-cant difference was found between participants’ RTs in the two stages of the experiment, both in the quiet condition (p= 0.09), and in the noisy condition (p= 0.2) (see Fig. 2B).
3.2. Success Rate and Response Time — Quiet vs. Noise in the Shape Identification Task
3.2.1. Success Rate
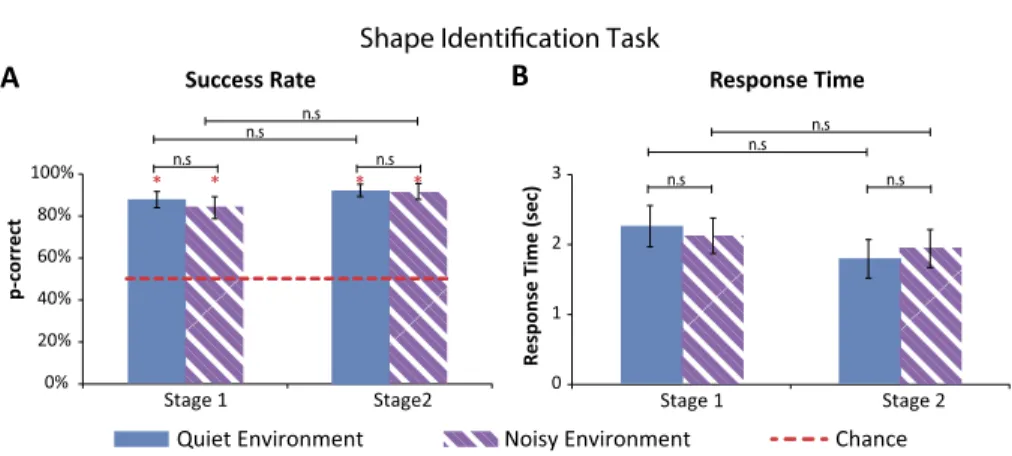
Similar findings were found also in the shape identification task in which participants’ success rates were significantly higher than a chance level of 50% (all p-values < 0.01, after Bonferroni correction). All success rates were higher than 82% for both quiet and noisy conditions in the two experimental stages. No significant differences emerged between the quiet and noisy con-ditions (all p-values > 0.29). Furthermore, no significant difference emerged between the two experimental stages neither for the quiet nor for the noisy conditions (all p-values > 0.12) (see Fig. 3A).
Specifically, in the first experimental stage, participants’ average success level in the quiet condition was 86± 13% (average ± standard deviation), this was not significantly higher than their success in the noisy condition in which participants successfully identified 82± 17% of the stimuli (p = 0.29) (see Fig. 3A).
In the second experimental stage, participants’ successfully identified 91± 9% of the stimuli in the quiet condition. This average success rate was not significantly higher than their success in the noisy condition, with an average success level of 89 ± 12% (p = 0.96). No significant difference was found
Figure 3. Results of shape identification task (error bars represent the standard errors). (A)
Suc-cess rate: the average sucSuc-cess rate for both conditions (quiet and noisy) in both experimental stages (Stage 1: before intense training; Stage 2: after intense training) was significantly higher than chance level (red asterisks). No significant difference emerged between the conditions nor between stages. (B) Response time: there was no significant difference in the response times between the two conditions (quiet; noisy) nor between the two stages (before/after intense train-ing).
between participants’ success level in the two experimental stages of the ex-periment, neither in the quiet condition (p= 0.21), nor in the noisy condition (p= 0.12) (see Fig. 3A).
3.2.2. Response Times
Participants’ RTs for both conditions, quiet and noisy, in the two experimental stages were no longer than 2.23 s. No significant difference was found between their RTs in the quiet condition to that in the noisy condition (all p-values > 0.3). Furthermore, no significant difference was found between their RTs in the two experimental stages (all p-values > 0.11, significant p-values did not survive the Bonferroni correction) (see Fig. 3B).
Specifically, in the first experimental stage, participants’ average RT in the quiet condition was 2.23 ± 8.8 s (average ± standard deviation), this was not significantly slower than RT in the noisy condition (average RT: 2.11 s; SD= ±7.5; p = 0.42) (see Fig. 3B).
In the second experimental stage, participants’ average RT was 1.78± 8.2 s in the quiet condition. This average RT was not significantly quicker than RTs in the noisy condition (average RT: 1.9± 8; p = 0.3). No significant differ-ence was found between participants RTs in the two stages of the experiment, both in the quiet condition (p-value did not survive the Bonferroni correction,
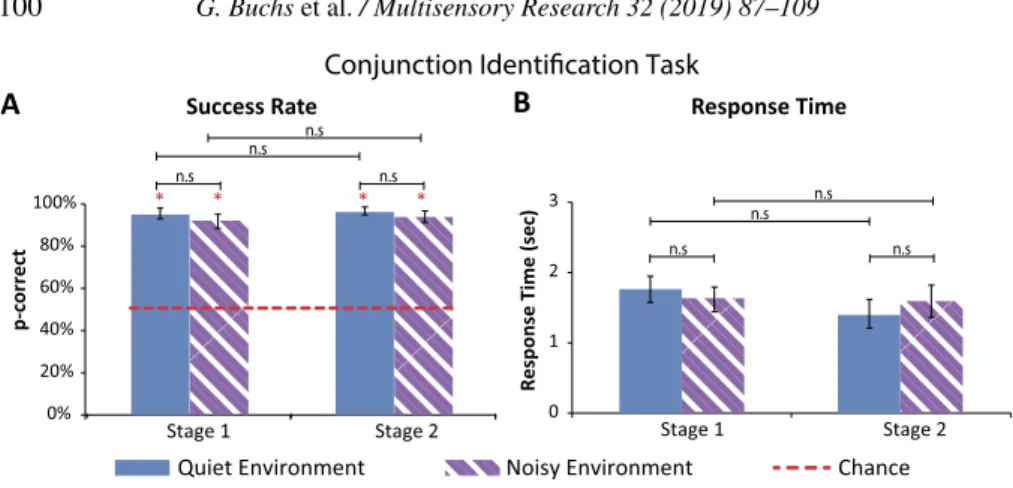
Figure 4. Results of conjunction identification task (error bars represent the standard errors).
(A) Success rate: the average success rate for both conditions (quiet and noisy) in both stages (Stage 1: before intense training; Stage 2: after intense training) was significantly higher than chance level. There was no significant difference between the conditions or between stages. (B) Response time: there was no significant difference between the quiet and noisy conditions in the first stage (before intense training). In the second stage (after intensive training), there was a borderline significant difference between the quiet and noisy condition, with p= 0.019 before correction for multiple comparison, and after a Bonferroni correction p= 0.058. This suggests that participants were slower in the noisy condition. There was no significant difference between RTs in the two experimental stages.
3.3. Success Rate and Response Time — Quiet vs. Noise in the Conjunction Identification Task
3.3.1. Success Rate
In the conjunction task, participants’ success rate was higher than 92% in the two conditions, quiet and noisy, in both experimental stages. These success rates were significantly higher than a chance level of 50% (all p-values < 0.01, after Bonferroni correction). No significant difference was found be-tween success rates in the quiet and noisy conditions (all p-values > 0.21). Furthermore, no significant difference emerged between participants’ success rate in the quiet and noisy conditions in the first experimental stage (before intense training), and that achieved in the second experimental stage (after intense training) (all p-values > 0.12) (see Fig. 4A).
Specifically, in the first experimental stage, participants’ average success level in the quiet condition was 94± 8% (average ± standard deviation), this was not significantly higher than their success in the noisy condition in which participants successfully identified 92± 10% of the stimuli (p = 0.25) (see Fig. 4A).
In the second experimental stage, participants successfully identified 96± 6% of the stimuli in the quiet condition. This average success rate was not significantly higher than their success in the noisy condition, with an average
success level of 93 ± 8% (p = 0.21). No significant difference was found between participants’ success level in the two experimental stages of the ex-periment, neither in the quiet condition (p= 0.21) nor in the noisy condition (p= 0.12) (see Fig. 4A).
3.3.2. Response Times
Participants’ average RTs in this task for both conditions, quiet and noisy, in the two experimental stages, was no longer than 1.7 s. In the first stage, participants average RT in the quiet condition was 1.75± 5.4 s, which was not significantly different from the average RT in the noisy condition (average RT: 1.63 s; SD= ±5.2 s; p = 0.09) (see Fig. 4B).
In the second experimental stage, participants’ average RT was 1.38± 6 s in the quiet condition. In the noisy condition, their average RT was 1.58± 6.7 s (average± standard deviation). Comparing participants RTs in the two con-ditions revealed a borderline significant difference, with an initial p-value= 0.019, suggesting that participants after training tended to be slower in the noisy condition compared to the quiet one. However, this significant differ-ence did not survive the Bonferroni correction (corrected p-value= 0.058). No significant difference was found between participants RTs in the two stages of the experiment, neither in the quiet condition (p= 0.16), nor in the noisy condition (p= 0.8) (see Fig. 4B).
3.4. Success Rate and Response Time in the Baseline Tests
Due to technical issues we removed from our analysis 7 of the total 288 stimuli presented amongst all participants in the first baseline test and 5 of the 288 stimuli presented amongst all participants in the second baseline test.
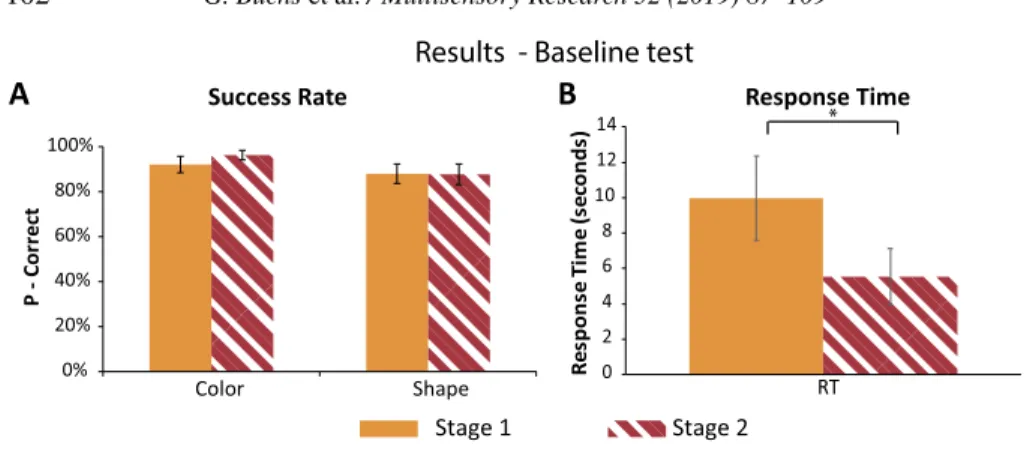
In the first baseline test, assessing participants’ knowledge of the experi-ment stimuli, participants recognized correctly 91± 12% of the stimuli colors (average ± standard deviation). In the second test, they correctly classified 96± 7% of the stimuli colors. This increase in successful classification was not significant, even though there was a strong trend towards it (p= 0.06). For the shape identification, participants successfully classified 89± 14% of the stimuli. This level of classification remained the same also in the second baseline test with an accuracy level of 89± 15% (p = 0.8) (see Fig. 5A).
In the first baseline test, on average, participants responded to each stimulus after 9.96 ± 7.4 s. In the second baseline test, though, participants needed significantly less time to recognize each stimulus’ color and shape, with an average of 5.5± 5 s (p < 0.005) (see Fig. 5B).
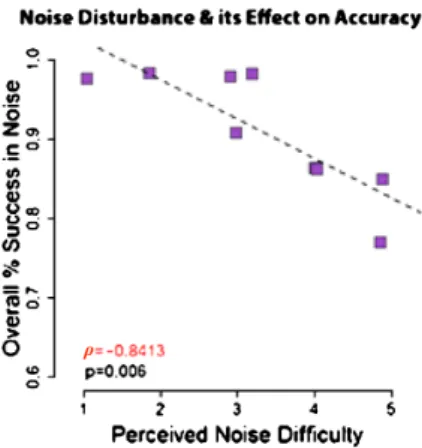
3.5. Disturbance of Noise and Its Effect on Accuracy
After a period of one to six months following enrollment in the experiment, participants were asked to scale the disturbance of the noise on their perfor-mance (on a 1–5 Likert scale). On average, participants scaled the disturbance
Figure 5. Results baseline test (error bars represent the standard errors). (A) Success rate.
No significant difference emerged between the first baseline and the second baseline test. (B) Response time: There was a significant decline in participants’ overall RTs between the first baseline test and the second one.
of the background noise as 3.33 ± 1.3 (average ± standard deviation). Im-portantly, although the scaling of the noise disturbance was acquired in a later stage, after participation in the experiment, the scaling values provided by all participants were consistent with the textual description they provided in the survey they filled out immediately at the end of the experiment (see section 2). One of the participants was excluded from this analysis as she could not eval-uate the disturbance of noise when asked at this later stage.
For each participant we calculated the average success rate in all the six noise blocks, across tasks (color, shape and conjunction) and stages. Using a
ρ correlation coefficient test for non-normal data we found a high correlation between the self-reported disturbance level and the average success rate in the noise blocks (ρ= −0.84, p = 0.006) (see Fig. 6). Crucially, after performing a normal approximation to the binomial for each participant with Bonferroni correction for multiple comparisons, we found that all eight participants’ suc-cess rate in noise blocks was still significantly higher than chance level (all
p-values < 0.000001).
4. Discussion
The aim of this study was to investigate the use of SSDs in everyday-like situations to test their reliability as rehabilitation tools for recovering visual functions. Currently, SSDs are mainly used in laboratory set-ups and do not fulfil their huge rehabilitative potential (Elli et al., 2014; Loomis, 2010). One of the main problems reported in the literature is that both users and trainers doubt that visual-to-auditory SSDs could be successfully used in noisy envi-ronments (Elli et al., 2014). In the present work, we addressed this issue by investigating the effect of irrelevant background noise on the perception of
Figure 6. The effect of noise disturbance on accuracy in noise blocks: high correlation between
the self-reported disturbance level of the noise and the average success rate in the noise blocks. Importantly, the average success rate of each participant in the noise condition was still signifi-cantly higher than chance level.
visual-to-auditory SSDs inputs. This was tested using a series of identifica-tion tasks of visual features (shape, color and the conjuncidentifica-tion between the two features) conveyed auditorily through the EyeMusic visual-to-auditory SSD in quiet vs. noisy conditions. We found that participants identified the requested visual features equally well (i.e., in terms of average success rate and RTs) in the quiet and noisy conditions. Furthermore, as hypothesized, the overall success rate in the noisy blocks was higher than the chance level in all partic-ipants, including those who reported the noise to be highly disturbing. These initial findings suggest that visual-to-auditory SSDs can be successfully used in noisy environments and users’ performance does not decline in a significant manner when adding irrelevant background sounds to the visual-to-auditory SSD relevant input. These findings, in turn, strengthen the potential of using these devices in real-life, noisy circumstances.
Note that in the current study, participants heard the EyeMusic stimuli via bone conductance, thus enabling them to hear the surrounding sounds along-side the SSD inputs. We believe this is a crucial setup for enabling the use of visual-to-auditory SSDs in everyday life, as blind individuals receive var-ious relevant environmental cues through audition (e.g., for localization of obstacles). Future studies should complement the present findings by further ascertaining users’ ability to perceive, shift their attention and respond to sud-den relevant cues while interpreting the input received from visual-to-auditory SSDs.
It is important to note, however, that, as expected, we observed an overall, non-significant trend of decreased success rate and increased response time in the noisy versus the quiet conditions in our participants, suggesting that the
noisy condition was indeed harder than the quiet one, as the participants them-selves reported. Essentially though, visual-to-auditory SSD blind users seem to show the typical ‘cocktail party effect’, when segregating relevant visual-to-auditory SSD input from irrelevant background noise. To the best of our knowledge, the cocktail party effect has primarily been described in terms of sounds interfering with spoken language inputs, and less in the context of non-linguistic, yet rather complex, auditory information as in the present study. However, given that we tested only blind participants in this task, we still cannot generalize these conclusions to the general population, as our findings might be biased by the superior ability of blind individuals to finely distinguish between auditory cues compared to their sighted peers (Collignon et al., 2006; Hugdahl et al., 2004). Such auditory advantage seems to be true for congeni-tally or early blind individuals, and not for late blind individuals (Wan et al., 2010). It is important to note, however, that our experiment included two late-blind participants whose success rates did not differ from that achieved by the congenital or early-blind participants.
In the literature concerning the cocktail party effect, the cognitive explana-tions regarding the mechanisms which this phenomenon relies on are broad (Bronkhorst, 2015). The most established ones include auditory grouping (e.g., the ability to form streams from individual sounds) (Arbogast et al., 2002), usage of top-down cognitive mechanisms (e.g., the ability to use so-cial/contextual cues for speech completion in noise) (Zion Golumbic et al., 2013), and auditory localization cues (e.g., the ability to separate auditory cues based on their spatial source) (Bronkhorst, 2015).
Our results go in-hand with all three of the aforementioned cognitive ex-planations. Specifically, for the grouping, our EyeMusic users did not show a significant decline of their performance in the noisy conditions, thus suggest-ing they could indeed perform efficient auditory groupsuggest-ing of the EyeMusic sounds into a unified percept in noisy conditions. Also, as for the involve-ment of top-down cognitive mechanisms, the participants in our study were aware of the possible stimuli, thus affecting their expectations during the task. This factor may have also contributed to their high success rate in the task. These types of expectations exist in the typical cocktail party effect as it has been shown that social expectations advance individuals’ ability to understand speech in noise (McGowan, 2015), and an increase in contextual linguistic cues increases word recognition in individuals with hearing loss (Lash et al., 2013). In addition, it has been proposed that people engaged in a conversation of interest tune themselves to a specific voice and complete the potentially missing information according to the context (e.g., the topic of the specific conversation), thus most probably relying on cognitive top-down mechanisms to inhibit all the irrelevant input (Zion Golumbic et al., 2013). We propose that similar cognitive mechanisms might be in place also when SSD users tune to
the relevant SSD input. Finally, for what concerns auditory localization cues, the EyeMusic visual-to-auditory input was perceived via bone conductance head phones, and the auditory background noise was perceived via the ears. This may have enabled participants to distinguish and localize the different audio inputs based on their incoming source.
It is important to note that previous studies consistently showed that the perception of several categories of visual stimuli through SSD recruits the visual cortex in addition to the expected auditory regions (cross-modal plas-ticity) both in sighted and blind adults (Amedi et al., 2017). It has been shown, for instance, that visual objects perceived via SSD recruit the lateral occipital complex (LOC) in the ventral visual stream, namely the region that in nor-mal perceptual conditions processes objects conveyed via the visual modality (Amedi et al., 2007). This form of cross-modal plasticity, in turn, might play a role in the reported success of the visual-to-auditory SSD users in perceiving the geometric shapes conveyed via audition in the presence of irrelevant back-ground sounds. Future studies should further investigate this issue and test the extent to which the current results depend on this type of plasticity or if they are only an effect of auditory processes.
This study constitutes a first step towards investigating the use of visual-to-auditory SSD training outcomes in more ecological set-ups, with the final aim of generating crucial implications for rehabilitation practices. Future studies could further investigate the key issue of the effect of noise on visual-to-auditory SSD perception by manipulating the complexity of visual stimuli, e.g., more complex shapes and even real-life objects, alongside varying peri-ods of training on the task and manipulating the percentage of unexpected/new objects presented during the task. This is important, as already from the first experimental stage (i.e., before specific training on the experimental stimuli) our blind participants’ success rates in identifying the various visual features (i.e., colors, shapes and their conjunction), were very high, and this did not improve significantly in the second stage (after specific training). This was true for the two experimental conditions, quiet and noisy, as well as for the accuracy level of participants in the two baseline tests (before and after spe-cific training). However, the overall response time significantly decreased in the second baseline test (after specific training) compared to the first base-line measurement. This result suggests that the additional training had some beneficial impact on the participants’ performance. Such future studies will potentially explain whether this lack of significant improvement observed in accuracy after specific training is due to a ceiling effect related to the identifi-cation of the specific set of shapes and colors, or to the specific training which was not long enough to show significant improvements in performance.
Future work should also explore the effects on auditory perception of dif-ferent types of noise such as white noise and speaking, coming from difdif-ferent
sources, along with quantifying the signal to noise ratio (SNR). This work might also help in further unraveling the cognitive mechanisms subtending the cocktail party effect (Bronkhorst, 2015; Cherry, 1953) by trying for instance to better disentangle the proposed mechanisms. Such results could perhaps be informative also for other rehabilitation methods relying on the auditory modality, such as cochlear implants (CIs). Cochlear implants (CIs) aim at restoring hearing by replacing the faulty function of the hair cells, and directly stimulating the acoustic nerve (Gaylor et al., 2013). Possibly, a better under-standing of the mechanisms underlying the cocktail party effect might provide guidelines for specific auditory training tailored to this population, ultimately improving the ability to inhibit background noise while using the implant which is currently described as problematic in these patients (Fetterman and Domico, 2002). These works might inform on how the two rehabilitation pro-cesses (use of visual-to-auditory SSD and CI implants) relate to each other, and whether we can use the insights we gain from one approach to benefit the outcomes of the other.
This work, demonstrating the feasibility of using visual-to-auditory SSDs alongside irrelevant background sounds, will allow the further improvement of the use of visual-to-auditory SSD for rehabilitation and every-day-use of SSDs, ultimately improving the independence of people who are visually-impaired and maximizing their quality of life.
Authors Contribution
G.B. and B.H. designed the experiment. G.B. programmed the experiment, recruited participants, ran the experiment and performed data-analyses. G.B., B.H. and A.A. wrote the paper. A.A. supervised the whole project.
Acknowledgements
This work was supported by a European Research Council Starting-Grant (310809) to A.A., a James S. McDonnel Foundation scholar award (no. 652 220020284) to A.A., European Research Council Consolidator-Grant (773121) to A.A., and two post-doctoral fellowships from the Edmond and Lily Safra Center for Brain Sciences (ELSC) and from the Jerusalem Brain Community (JBC) to B.H. The funders had no role in study design, data col-lection and analysis, decision to publish, or preparation of the manuscript. The features of the auditory sounds used in the experiment were described with the help of Wojciech Bedzinski from the Institute of Physiology and Pathology of Hearing in Warsaw.
References
Abboud, S., Hanassy, S., Levy-Tzedek, S., Maidenbaum, S. and Amedi, A. (2014). EyeMusic: introducing a ‘visual’ colorful experience for the blind using auditory sensory substitution,
Restor. Neurol. Neurosci. 32, 247–257.
Ackroyd, C., Humphrey, N. K. and Warrington, E. K. (1974). Lasting effects of early blindness. A case study, Q J. Exp. Psychol. 26, 114–124.
Ahuja, A. K., Dorn, J. D., Caspi, A., McMahon, M. J., Dagnelie, G., Dacruz, L., Stanga, P., Hu-mayun, M. S., Greenberg, R. J. and Argus II Study Group (2011). Blind subjects implanted with the Argus II retinal prosthesis are able to improve performance in a spatial-motor task,
Br. J. Ophthalmol. 95, 539–543.
Amedi, A., Stern, W. M., Camprodon, J. A., Bermpohl, F., Merabet, L., Rotman, S., Hemond, C., Meijer, P. and Pascual-Leone, A. (2007). Shape conveyed by visual-to-auditory sensory substitution activates the lateral occipital complex, Nat. Neurosci. 10, 687–689.
Amedi, A., Hofstetter, S., Maidenbaum, S. and Heimler, B. (2017). Task selectivity as a com-prehensive principle for brain organization, Trends Cogn. Sci. 21, 307–310.
Arbogast, T. L., Mason, C. R. and Kidd Jr, G. (2002). The effect of spatial separation on infor-mational and energetic masking of speech, J. Acoust. Soc. Am. 112, 2086–2098.
Bach-y-Rita, P., Kaczmarek, K. A., Tyler, M. E. and Garcia-Lara, J. (1998). Form perception with a 49-point electrotactile stimulus array on the tongue: a technical note, Rehabil. Res.
Dev. 35, 427–430.
Bronkhorst, A. W. (2015). The cocktail-party problem revisited: early processing and selection of multi-talker speech, Atten. Percept. Psychophys. 77, 1465–1487.
Busskamp, V., Duebel, J., Balya, D., Fradot, M., Viney, T. J., Siegert, S., Groner, A. C., Cabuy, E., Forster, V., Seeliger, M., Biel, M., Humphries, P., Paques, M., Mohand-Said, S., Trono, D., Deisseroth, K., Sahel, J. A., Picaud, S. and Roska, B. (2010). Genetic reactivation of cone photoreceptors restores visual responses in retinitis pigmentosa, Science 329(5990), 413–417.
Carlson, S., Hyvärinen, L. and Raninen, A. (1986). Persistent behavioural blindness after early visual deprivation and active visual rehabilitation: a case report, Br. J. Ophthalmol. 70, 607– 611.
Chader, G. J., Weiland, J. and Humayun, M. S. (2009). Artificial vision: needs, functioning, and testing of a retinal electronic prosthesis, Prog. Brain Res. 175, 317–332.
Cherry, E. C. (1953). Some experiments on the recognition of speech, with one and with two ears, J. Acoust. Soc. Am. 25, 975–979.
Collignon, O., Renier, L., Bruyer, R., Tranduy, D. and Veraart, C. (2006). Improved selective and divided spatial attention in early blind subjects, Brain Res. 1075, 175–182.
Collignon, O., Champoux, F., Voss, P. and Lepore, F. (2011). Sensory rehabilitation in the plastic brain, Prog. Brain Res. 191, 211–231.
Djilas, M., Olès, C., Lorach, H., Bendali, A., Dégardin, J., Dubus, E., Lissorgues-Bazin, G., Rousseau, L., Benosman, R., Ieng, S. H., Joucla, S., Yvert, B., Bergonzo, P., Sahel, J. and Picaud, S. (2011). Three-dimensional electrode arrays for retinal prostheses: modeling, ge-ometry optimization and experimental validation, J. Neural Eng. 8, 46020. DOI:10.1088/ 1741-2560/8/4/046020.
Elli, G. V., Benetti, S. and Collignon, O. (2014). Is there a future for sensory substitution outside academic laboratories?, Multisens. Res. 27, 271–291.
Fetterman, B. L. and Domico, E. H. (2002). Speech recognition in background noise of cochlear implant patients, Otolaryngol Head Neck Surg. 126, 257–263.
Gaylor, J. M., Raman, G., Chung, M., Lee, J., Rao, M., Lau, J. and Poe, D. S. (2013). Cochlear implantation in adults, JAMA Otolaryngol. Head Neck Surg. 139, 265–272.
Gregory, R. L. and Wallace, J. G. (1963). Recovery from early blindness, Exp. Psychol. Soc.
Monogr. 2, 65–129.
Hamilton-Fletcher, G., Obrist, M., Watten, P., Mengucci, M. and Ward, J. (2016). I always wanted to see the night sky: blind user preferences for sensory substitution devices, in:
Pro-ceedings of the 2016 CHI Conference on Human Factors in Computing Systems, San Jose, CA, USA, pp. 2162–2174.
Hartong, D. T., Berson, E. L. and Dryja, T. P. (2006). Retinitis pigmentosa, Lancet 368(9549), 1795–1809.
Heimler, B., Striem-Amit, E. and Amedi, A. (2015). Origins of task-specific sensory-independent organization in the visual and auditory brain: neuroscience evidence, open questions and clinical implications, Curr. Opin. Neurobiol. 35, 169–177.
Hugdahl, K., Ek, M., Takio, F., Rintee, T., Tuomainen, J., Haarala, C. and Hämäläinen, H. (2004). Blind individuals show enhanced perceptual and attentional sensitivity for identifi-cation of speech sounds, Cogn. Brain Res. 19, 28–32.
Humayun, M. S., Dorn, J. D., da Cruz, L., Dagnelie, G., Sahel, J. A., Stanga, P. E., Cideciyan, A. V., Duncan, J. L., Eliott, D., Filley, E., Ho, A. C., Santos, A., Safran, A. B., Arditi, A., Del Priore, L. V., Greenberg, R. J. and Argus II Study Group (2012). Interim results from the international trial of second sight’s visual prosthesis, Ophthalmology 119, 779–788. Kardous, C. A. and Shaw, P. B. (2014). Evaluation of smartphone sound measurement
applica-tions, J. Acoust. Soc. Am. 135, EL186–EL192.
Lash, A., Rogers, C. S., Zoller, A. and Wingfield, A. (2013). Expectation and entropy in spoken word recognition: effects of age and hearing acuity, Exp. Aging Res. 39, 235–253.
Levin, N., Dumoulin, S. O., Winawer, J., Dougherty, R. F. and Wandell, B. A. (2010). Cortical maps and white matter tracts following long period of visual deprivation and retinal image restoration, Neuron 65, 21–31.
Levy-Tzedek, S., Hanassy, S., Abboud, S., Maidenbaum, S. and Amedi, A. (2012). Fast, ac-curate reaching movements with a visual-to-auditory sensory substitution device, Restor.
Neurol. Neurosci. 3(0), 313–323.
Levy-Tzedek, S., Riemer, D. and Amedi, A. (2014). Color improves ‘visual’ acuity via sound,
Front. Neurosci 8, 358. DOI:10.3389/fnins.2014.00358.
Loomis, J. M. (2010). Sensory substitution for orientation and mobility: what progress are we making?, in: Foundations of Orientation and Mobility, Vol. 1: History and Theory, 3rd edn., W. R. Wiener, R. L. Welsh and B. B. Blasch (Eds), pp. 7–10. AFB Press, New York, NY, USA.
Maidenbaum, S., Buchs, G., Abboud, S., Lavi-Rotbain, O. and Amedi, A. (2016). Perception of graphical virtual environments by blind users via sensory substitution, PLoS One 11, e0147501. DOI:10.1371/journal.pone.0147501.
Maidenbaum, S., Abboud, S. and Amedi, A. (2014). Sensory substitution: closing the gap be-tween basic research and widespread practical visual rehabilitation, Neurosci. Biobehav. Rev.
McGowan, K. B. (2015). Social expectation improves speech perception in noise, Lang. Speech
58, 502–521.
Meijer, P. B. L. (1992). An experimental system for auditory image representations, IEEE Trans.
Bio-Med. Eng. 39, 112–121.
Proulx, M. J., Stoerig, P., Ludowig, E. and Knoll, I. (2008). Seeing ‘where’ through the ears: effects of learning-by-doing and long-term sensory deprivation on localization based on image-to-sound substitution, PLoS One 3, e1840. DOI:10.1371/journal.pone.0001840. Proulx, M. J., Gwinnutt, J., Dell’Erba, S., Levy-Tzedek, S., de Sousa, A. A. and Brown, D. J.
(2015). Other ways of seeing: from behavior to neural mechanisms in the online ‘visual’ control of action with sensory substitution, Restor. Neurol. Neurosci. 34, 29–44.
Reich, L. and Amedi, A. (2015). ‘Visual’ parsing can be taught quickly without visual experi-ence during critical periods, Sci. Rep. 5, 15359. DOI:10.1038/srep15359.
Striem-Amit, E., Dakwar, O., Reich, L. and Amedi, A. (2012a). The large-scale organization of ‘visual’ streams emerges without visual experience, Cereb. Cortex 22, 1698–1709. Striem-Amit, E., Guendelman, M. and Amedi, A. (2012b). ‘Visual’ acuity of the
congeni-tally blind using visual-to-auditory sensory substitution, PLoS One 7, e33136. DOI:10.1371/ journal.pone.0033136.
Wan, C. Y., Wood, A. G., Reutens, D. C. and Wilson, S. J. (2010). Early but not late-blindness leads to enhanced auditory perception, Neuropsychologia 48, 344–348.
Wang, L., Mathieson, K., Kamins, T. I., Loudin, J. D., Galambos, L., Goetz, G., Sher, A., Man-del, Y., Huie, P., Lavinsky, D., Harris, J. S. and Palanker, D. V. (2012). Photovoltaic retinal prosthesis: implant fabrication and performance, J. Neural Eng. 9, 46014. DOI:10.1088/ 1741-2560/9/4/046014.
Ward, J. and Meijer, P. (2010). Visual experiences in the blind induced by an auditory sensory substitution device, Conscious. Cogn. 19, 492–500.
World Health Organization (2018). Blindness and vision impairment. World Health Organization, Geneva, Switzerland. https://www.who.int/news-room/fact-sheets/detail/ blindness-and-visual-impairment. Retrieved December 13, 2018.
Yang, Y., Mohand-Said, S., Léveillard, T., Fontaine, V., Simonutti, M. and Sahel, J. A. (2010). Transplantation of photoreceptor and total neural retina preserves cone function in P23H rhodopsin transgenic rat, PLoS One 5, e13469. DOI:10.1371/journal.pone.0013469. Zion Golumbic, E. M., Ding, N., Bickel, S., Lakatos, P., Schevon, C. A., McKhann, G. M.,
Goodman, R. R., Emerson, R., Mehta, A. D., Simon, J. Z., Poeppel, D. and Schroeder, C. E. (2013). Mechanisms underlying selective neuronal tracking of attended speech at a ‘cocktail party’, Neuron 77, 980–991.
Zrenner, E., Bartz-Schmidtm, K. U., Benav, H., Besch, D., Bruckmann, A., Gabel, V. P., Gekeler, F., Greppmaier, U., Harscher, A., Kibbel, S., Koch, J., Kusnyerik, A., Peters, T., Stingl, K., Sachs, H., Stett, A., Szurman, P., Wilhelm, B. and Wilke, R. (2011). Subretinal electronic chips allow blind patients to read letters and combine them to words, Proc. Biol.