HAL Id: hal-01657714
https://hal.uca.fr/hal-01657714
Submitted on 12 Dec 2017
HAL is a multi-disciplinary open access archive for the deposit and dissemination of sci-entific research documents, whether they are pub-lished or not. The documents may come from teaching and research institutions in France or abroad, or from public or private research centers.
L’archive ouverte pluridisciplinaire HAL, est destinée au dépôt et à la diffusion de documents scientifiques de niveau recherche, publiés ou non, émanant des établissements d’enseignement et de recherche français ou étrangers, des laboratoires publics ou privés.
Experimental study of cover-plate bolted joints with
large or slotted holes
Edouard Cavène, Sébastien Durif, Abdelhamid Bouchaïr, Evelyne Toussaint
To cite this version:
Edouard Cavène, Sébastien Durif, Abdelhamid Bouchaïr, Evelyne Toussaint. Experimental study of cover-plate bolted joints with large or slotted holes. EUROSTEEL 2017 (8th European Conference on Steel and Composite Structures), Sep 2017, Copenhagen, Denmark. �hal-01657714�
Experimental study of cover-plate bolted joints with large or
slotted holes
Edouard Cavène1,2, Sébastien Durif1,2, Abdelhamid Bouchaïr1,2, Evelyne Toussaint1,2
1
Université Clermont Auvergne, Institut Pascal, BP 10448, Clermont-Ferrand, France 2
CNRS, UMR 6602, Institut Pascal, 63171, Aubière, France ABSTRACT :
Connections in steel structures are of main importance in the design process. Cover-plate connections with circular or slotted holes are of common use in steel structures. The behavior of such connections is characterized by various failure modes. Bearing mode is one of the most complex due to the distribution of stresses and strain around the loaded holes. This paper deals with the characterization of the behavior of cover-plate bolted joints with slotted holes. Numerical simulations using the Cast3M FE package are performed in association with an original experimental method based on full-field measurements. The strain fields obtained with these methods (grid method and Digital Image Correlation (DIC)) give the possibility to observe the evolution of the local deformations in the loaded zones of the connections. These evolutions are compared to those given by the Finite Element model for each configuration at different loadings stages. Thus, the experimental results are used to validate the numerical model. The comparisons are based on the load-displacement curves, the failure modes and the local deformations in the zones around the bolts holes. Six different geometrical parameters of the holes and their positions are considered in the tests. The validated numerical model is used to evaluate the influences of the dimensions of the slotted hole. The results showed that the geometry has a significant influence on the failure mode of the connections such as net section and bearing. Both numerical and experimental results are compared to those given by the analytical approach of Eurocode 3 to evaluate the accuracy of the analytical prediction. The study shows the influence of various geometrical parameters on the resistance and the failure mode of the connections with slotted holes. The strain fields obtained with the grid method and DIC are observed in the plate around the bolt in the elastic and plastic phases. They give the possibility to observe experimentally the evolution of strains in a wide area of the most stressed zones in order to develop more accurate analytical models based on experimental evolutions of strains.
Keywords : experimental tests, cover-plate joints, grid method, numerical model, Eurocode 3 1 INTRODUCTION
The slotted holes are often used in structure to allow displacements along a direction to control the transfer of forces between structural elements or to avoid thermal expansion or limit the effects of dynamic load [1]. Indeed, if the direction of the hole is parallel to the load, the mobilization of friction along the hole dissipates a part of the energy due to horizontal seismic load. The paper [1] proposes an analytical model to quantify the energy dissipation. However, slotted hole can be used to allow displacement along the perpendicular direction of the hole. In civil engineering, this solution is present to connect steel structures with glasses structure for example. In this case, the load is perpendicular to the direction of the hole. A lack of studies concerns this behavior on steel plates. A study is presented on cover-plate connection with slotted hole in [2].
In the present work, the behavior is compared to finite element method results and the experimental behavior is measured by full field measurement. Moreover, Eurocode presents limited information concerning the bolted connections with slotted holes.
The aim of this study is to characterize the connections with slotted holes, using both numerical simulation and experimental analysis. An attention on the geometry of the connection is an important part of the work in the same spirit of work made on circular hole [3] [4].
Firstly, the present paper describes the test set up and the different tested geometrical configuration. When the support of the present work is defined, the analytical model proposed by EC3 bring a first values of strength. Then a numerical model is developed and allows to characterize the behavior for the connections. Finally, an experimental study is performed and result in term of strain fields and strengths and compared to both analytical and numerical results.
2 GEOMETRY AND MATERIAL SPECIFICATIONS 2.1 Geometry
Three configurations have been tested. These configurations have been designed with dimensions apart from Eurocode design recommendations, EN-1993-1-8 (see Table 1).
Table 1. Geometrical limits of the Eurocode
Dimension Minimum
End-plate dimension Transversal-plate dimension
Indeed, the end distance (e3) is lower than the recommended values, however, no limitation are defined in the Eurocode. Besides, among the three specimens, two have a shifted hole regarding the axis of the plate.
The corresponding geometrical characteristics of the three tested configurationsE1, E2 and E3 are defined in Fig. 1 and 2.
Fig. 1. Geometrical specifications of an slotted hole (EN1993-1-8)
a) b) c)
Table 2. Geometrical characteristics of specimens
Specimens Length hole (mm)
E1 13 13 26 26
E2 19.5 13 13 32.5
E3 19.5 13 19.5 26
To represent various situations which can be present in the practice, the plates are designed with shifted hole to allow observing the behavior of the connection with slotted hole and load not applied in the center of the hole.
2.2 Material specifications
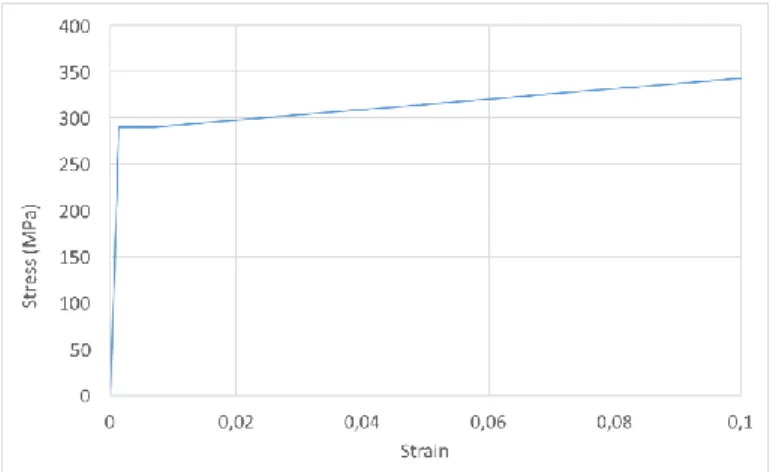
Specimens were taken from flat plate of 6mm thickness made of S235 steel grade. The real values obtained from tensile tests are 290 MPa and 380MPa respectively for the yield stress and maximal stress value. The strain at failure is about of 30%. The corresponding stress-strain curve is represented in Fig. 3.
Fig. 3. Tension curve of steel
3 ANALYTICAL MODEL 3.1 Analytical strength
All the specimens are characterized by a large edge distance (e4 in Fig. 1) compared to end distance (e3). This choice is done to avoid a failure mode in the net section. Thus the expected failure mode is bearing. Indeed, in comparison to net section strength, the bearing strength is rather complex to define. The analytical model presented in Eurocode 3 [reference] to predict the bearing strength does not consider the hole length.
In Eurocode 3, the failure modes to be considered for the plate are the net-section and bearing. For the bolt, the failure mode is shearing. The three corresponding strengths, according to the table 3.4 in EC3-1.8 are given in Table 3 with :
fu : ultimate strength of the steel plate
fub: ultimate strength of the bolt
t : thicnss of the plate d : diameter of the bolt
: coefficients depending on various parameters given in Eurocode. : net section of the bolt.
Table 3. Strength formula Failure mode Formula
Bearing Shearing Net-section
In Table 3, represents the, when is the thickness of the plate and the diameter of the bolt. The bearing strength, given for bolts in normal circulaire holes, has to be reduced by about 40% when direction of the force transfer is perpendicular to the longitudinal axis of the slotted hole. Consequently, a coefficient of 0.6 has to be applied to .
Table 4.Values of strength in bearing mode
Specimen
(kN) with coefficient 0.6 (kN) without coefficient 0.6
E1 11 18
E2 5 11 8 18
E3 11 11 18 18
Besides, the eccentricity of the effort with regards to the center of the hole is not considered in the formulas proposed by Eurocode 3. The standard defines the edge dimension (e4) for slotted hole as the smallest dimension between each side of the hole.
The determination of the strength is done considering and because for E2 the bolt is positioned at the opposite side of the hole with . Because of that, using this geometrical characteristic seems to be questionable. The strains are going to be concentrated near the contact point between the bolt and the hole edge. So, could be more representative of the experimental behavior.
Concerning the net section strength, values for specimens E1 to E3 are given in Table 5.
Table 5. Values of strength in net-section mode Failure mode Net-section (kN)
E1 64
E2 21
E3 43
The failure mode of the bolt is shearing. Concerning the shearing strength is a constant and its value is equal to 49 kN with a M12 bolt of grade 12.9.
Comparing strength values, the maximum is obtained for the shearing or net section mode, depending on the specimen studied. The bearing mode presents the lowest values of strength for all
the specimens. It is the predominant failure mode. Cover-plates connections was designed to favor this behavior.
The values of strength given in Table 4 and Table 5 are out of the framework of the standard because of the end distance that is lower than 1.5d0. However, it is interesting to confront these analytical values to those obtained from experimental tests in Table 6.
4 NUMERICAL SIMULATION 4.1 Model
A finite element model has been developed using the FEM software CAST3M with 2D triangular linear elements and contact elements (IMPO operator) with friction. All plates were modeled considering elastoplastic behavior with isotropic hardening. The stress-strain curve used to model the plates is presented in Fig. 4.
Fig. 4. Stress-strain curve used in the model (steel plate)
The mechanical model of the bolt is considered elastic with a Young modulus of 210 GPa.
The plate is submitted to an axial tension by imposed displacement while the bolt is fixed (see Fig. 5). The contact between bolt and plate is set with specifics elements. These finite elements manage the non-linearity of the contact. A suitable mesh is set to have the best compromise between convergence and time [5]. The model is presented in Fig. 5.
Fig. 5. Finite element model of specimen E1
5 EXPERIMENTAL TESTS 5.1 Uniaxial tension tests
Tension tests were performed using a ± 200kN Zwick testing machine. The tests were displacement controlled with a cross-head speed of the machine equal to 0.04mm/s. Each geometric configuration was tested with two specimens.
5.2 Instruments
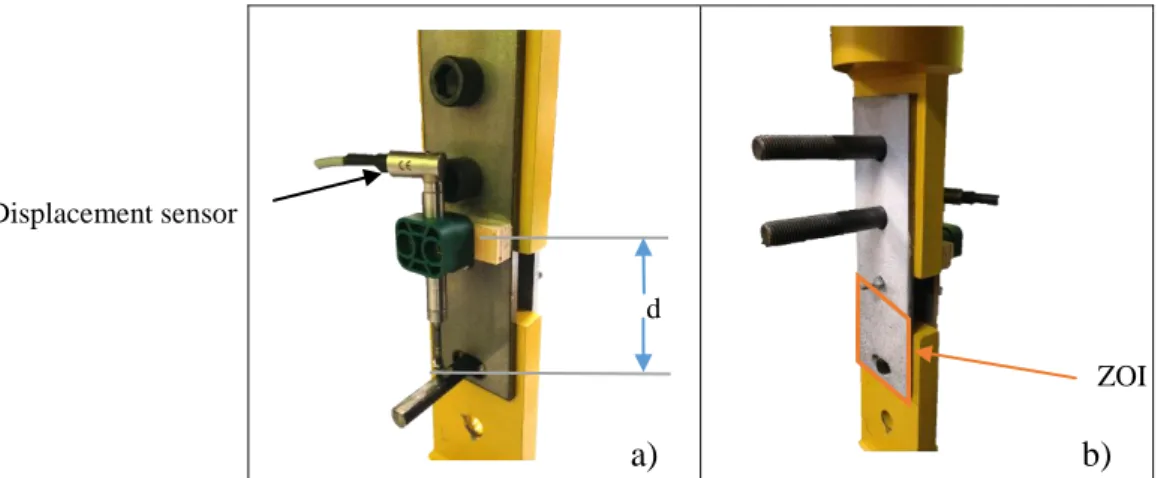
A connection was necessary to perform the test. It induces displacements that are not representative of the displacement of the specimen. Clearance take-up should be taken into account correct this artefact. Consequently, the displacement of the grip cannot be used to characterize the connection. That is why a displacement sensor was used to record the relative displacement (see Fig. 6.a).
Fig. 6. Setting system a) back view b) front view
The distance d has been chosen to be coherent with the global displacement imposed in the numerical model.
By this way, both numerical and experimental global behaviors can be compared.
5.3 Digital image correlation
Heterogeneous strain fields are expected around the bolt due to local transfer mechanics.
On the present work, Digital Image Correlation (DIC) method [6] is used as a noncontact method to detect and quantify displacement and strain field that occurs in the tested specimens. Another noncontact measurement method used in a previous experimental campaign [5], with accurate results, could be used to obtain local deformations of specimen using grid method [7]. However, as the strain levels induced around the slotted hole are high, DIC method was chosen. DIC consists in comparing reference image and a deformed one.
Ncorr software [8] is used in the present study. Displacement and strain values are calculated at the center of each zone of interest . The grid step is about of 5 pixels.
For that purpose, for the loaded specimen, a speckle pattern is painted on the surface of the specimen. This pattern is presented in Fig. 7 a). The corresponding histogram of grey level is also presented in Fig. 7 b). It is important for a good correlation between images to maximize the dynamic of the camera but avoiding grey level saturation.
a) b)
ZOI Displacement sensor
a)
b)
Fig. 7. a) Speckle pattern on E1 b) corresponding grey level histogram
The camera employed here is a PCO2000 camera. It features a 16-bit CCD sensor and is equipped with a 105mm lens. The surface was illuminated using a cold light source that provides a quasi-uniform lighting of the surface with good contrast. The camera captures 0.91 frame/s.
6 RESULTS AND DISCUSSION 6.1 Global behavior
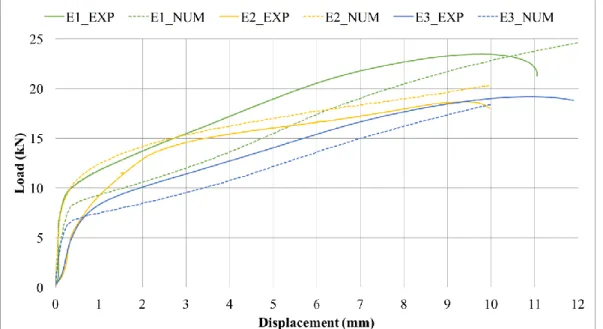
Force-displacement numerical curves of E1, E2 and E3 specimens given by the numerical model are shown in Fig. 8. Experimental force- displacement curves.
The three curves present two phases. The first phase corresponds to the elastic behavior of the connection. The second is due to the appearance of plastic deformation on the both sides of the end dimension. Moreover, the curve corresponding to specimen E1 presents an inflexion point corresponding to a third behavior at the end of the curve.
The necking in the plate around the contact point with the bolt induces a loss of strength before failure but the parameters of the model do not take account of it.
Figure Fig. 8 give the load-displacement curves for the three configurations, obtained with both experimental (continue lines) and numerical results (dote lines).
The experimental displacement corresponds to the elongation of distance “d” in Fig. 6.
It can be seen in Fig. 8 that numerical and experimental curves show similar tendency, mainly for the two phases (elastic and plastic).
However, some differences can be observed. The first change in slope in experimental curves is due to clearance take-up in the system. That is why it can not be seen on numerical results.
Moreover, a difference between the strength at the beginning of plastic behavior of the connection for numerical and experimental curves is present. Experimental values are higher than numerical ones. It can be due to concentration of stress in numerical model.
6.2 Local results
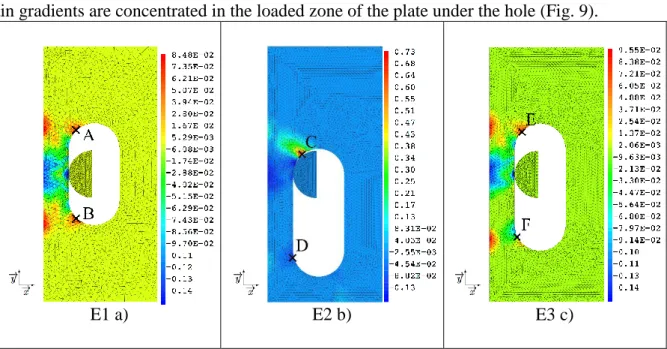
Strain gradients are concentrated in the loaded zone of the plate under the hole (Fig. 9).
E1 a) E2 b) E3 c)
Fig. 9. Strain map a) xx on E1 b) xx on E2 c) xx on E3
For all the specimens E1 and E3, plastic deformation is localized in the zones represented by the points (A, B, E, F points) appear on both sides of the hole. The shifting of the bolt induces an asymmetry of the strain distribution around the hole.
Due to the shifting of the bolt for specimen E2, a large strain zone is visible in xx map (see point C, Fig. 9).
Concerning specimen E2, the bolt is pressed down on the side of the hole. Because of that, the shearing is very important around point C. In this case, the flexion of the end distance of the plate develops a plastic hinging point at the opposite hole’s side of the contact point (point D).
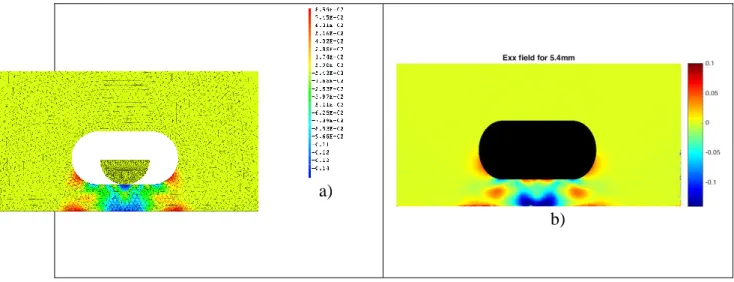
Comparisons of strain maps obtained by the numerical and experimental ways for the three specimens E1, E2 and E3 are presented in Fig. 10, Fig. 11 and Fig. 12 respectively.
a)
b)
Fig. 10xx strain field for E1 a) numerical field b) experimental field (Global displacement = 5.4mm)
a) b)
Fig. 11. xy strain field for E2 a) numerical field b), experimental field (Global displacement = 3.8mm)
a) b)
Fig. 12. xx strain field for E3 a) numerical field, b) experimental field (Global displacement = 6.2mm)
The tendency of strain distributions are similar comparing experimental and numerical strain maps for the specimens E1 and E3. However, some large differences are observed in term of strain values for the specimen E2.
Gradient numerical strain values are higher for the E1 and E3 specimens. It may be explained by the fact that the finite element model is a 2D model. Because of that, it presents a concentration of the strain on a few elements. The diffusion of the stress is not as important as the experimental model. Strain localization between numerical and experimental maps are similar. However, the maximum values present an important differential.
Concerning E2, all the strain and the stress are concentrated on the side of the hole. The 2D model presents its limits in that situation. A 3D model is in progress to improve the diffusion of the stress in numerical results.
6.2.1 Experimental strength
Experimental results allow to obtain the strength values for each specimen. Values are given in Table 6. They correspond to the average of two values obtained with the two specimens tested for each specimen.
Table 6. Experimental values of strength Specimen Strength (kN)
E1 24,20 ± 0.1
E2 18,95 ± 0.43
E3 19,14 ± 0.05
Comparing these values to the analytical ones (Eurocode) allows to conclude that values are similar if analytical values without 0.6 coefficient are taken into account. The maximum differential of about 24% is obtained for specimen E1 while a difference of about 3.4% and 5% is obtained for specimens E2 and E3 respectively.
7 CONCLUSION
The study presented in this paper shows that Eurocode is conservative. It has been shown that the location of the bolt in the hole has an impact on the strength value. This is not considered in the available analytical approaches.
Some differences between numerical and experimental global load-displacement curves have been observed. The stress distribution at the contact surface may be one of the explanation of these differences. A 3D numerical model should confirm the hypothesis.
Finally, full field measurement technique allows to clearly visualize strain gradients around the bolt and to obtain both qualitative and quantitative information at each stage of the loading. They are also of great importance to improve a numerical model.
8 ACKNOWLEDGEMENT :
The authors are grateful to the AUGC: « Association Universitaire de Génie Civil » for its financial support.
9 BIBLIOGRAPHY
[1] S. S. Law, Z. M. Wu, and S. L. Chan, “Analytical model of a slotted bolted connection element and its behaviour under dynamic load,” J. Sound Vib., vol. 292, no. 3–5, pp. 777–787, May 2006.
[2] F. Wald, Z. Sokol, M. Moal, V. Mazura, and J.-P. Muzeau, “Stiffness of cover plate connections with slotted holes,” J. Constr. Steel Res., vol. 60, no. 3–5, pp. 621–634, Mar. 2004. [3] T. Dang Hoang, C. Herbelot, and A. Imad, “On failure mode analysis in a bolted single lap joint under tension-shearing,” Eng. Fail. Anal., vol. 24, pp. 9–25, Sep. 2012.
[4] T. A. D. Tajeuna, F. Légeron, P. Labossière, M. Demers, and S. Langlois, “Effect of geometrical parameters of aluminum-to-steel bolted connections,” Eng. Struct., vol. 102, pp. 344– 357, Nov. 2015.
[5] L. Champaney, “Une nouvelle approche modulaire pour l’analyse d’assemblages de structures tridimensionnelles,” École normale supérieure de Cachan-ENS Cachan, 1996.
[6] F. Hild and S. Roux, “Digital image correlation: from displacement measurement to identification of elastic properties–a review,” Strain, vol. 42, no. 2, pp. 69–80, 2006.
[7] E. Toussaint, S. Durif, A. Bouchaïr, and M. Grédiac, “Strain measurements and analyses around the bolt holes of structural steel plate connections using full-field measurements,” Eng.
[8] B. Pan and K. Li, “A fast digital image correlation method for deformation measurement,”


