HAL Id: hal-00821199
https://hal.archives-ouvertes.fr/hal-00821199
Submitted on 15 Jul 2013
HAL is a multi-disciplinary open access
archive for the deposit and dissemination of
sci-entific research documents, whether they are
pub-lished or not. The documents may come from
teaching and research institutions in France or
abroad, or from public or private research centers.
L’archive ouverte pluridisciplinaire HAL, est
destinée au dépôt et à la diffusion de documents
scientifiques de niveau recherche, publiés ou non,
émanant des établissements d’enseignement et de
recherche français ou étrangers, des laboratoires
publics ou privés.
Emissions halted of the potent greenhouse gas SF5CF3
W. T. Sturges, D. E. Oram, J. Laube, C.E. Reeves, M.J. Newland, C. Hogan,
Patricia Martinerie, Emmanuel Witrant, C.-A.-M. Brenninkmeijer, T.J.
Schuck, et al.
To cite this version:
W. T. Sturges, D. E. Oram, J. Laube, C.E. Reeves, M.J. Newland, et al.. Emissions halted of the
potent greenhouse gas SF5CF3. Atmospheric Chemistry and Physics, European Geosciences Union,
2012, 12, pp.3653-3658. �10.5194/acp-12-3653-2012�. �hal-00821199�
www.atmos-chem-phys.net/12/3653/2012/ doi:10.5194/acp-12-3653-2012
© Author(s) 2012. CC Attribution 3.0 License.
Chemistry
and Physics
Emissions halted of the potent greenhouse gas SF
5
CF
3
W. T. Sturges1, D. E. Oram1,2, J. C. Laube1, C. E. Reeves1, M. J. Newland1, C. Hogan1, P. Martinerie3, E. Witrant4, C. A. M. Brenninkmeijer5, T. J. Schuck5, and P. J. Fraser6
1The School of Environmental Sciences, University of East Anglia, Norwich NR4 7TJ, UK
2National Centre for Atmospheric Science, School of Environmental Sciences, Univ. of East Anglia, Norwich NR4 7TJ, UK 3UJF – Grenoble 1/CNRS, Laboratoire de Glaciologie et G´eophysique de l’Environnement (LGGE) UMR5183, Grenoble,
38041, France
4Grenoble Image Parole Signal Automatique (GIPSA-lab), Universit´e Joseph Fourier/CNRS, BP 46, 38 402 Saint Martin
d’H`eres, France
5Max Planck Institute for Chemistry, Air Chemistry Division, Mainz, Germany
6Centre for Australian Weather and Climate Research, Commonwealth Scientific and Industrial Research Organisation,
Aspendale, Victoria 3195, Australia
Correspondence to: W. T. Sturges ([email protected])
Received: 22 December 2011 – Published in Atmos. Chem. Phys. Discuss.: 10 January 2012 Revised: 13 March 2012 – Accepted: 29 March 2012 – Published: 19 April 2012
Abstract. Long term measurements in background air (Cape
Grim, Tasmania) and firn air (NEEM, Greenland) of the po-tent long-lived greenhouse gas SF5CF3show that emissions
declined after the late 1990s, having grown since the 1950s, and became indistinguishable from zero after 2003. The tim-ing of this decline suggests that emissions of this gas may have been related to the production of certain fluorochemi-cals; production of which have been recently phased out. An earlier observation of closely correlated atmospheric abun-dances of SF5CF3 and SF6 are shown here to have likely
been purely coincidental, as their respective trends diverged after 2002. Due to its long lifetime (ca. 900 yr), atmospheric concentrations of SF5CF3 have not declined, and it is now
well mixed between hemispheres, as is also shown here from interhemispheric aircraft measurements. Total cumulative emissions of SF5CF3amount to around 5 kT.
1 Introduction
In recent years the atmospheric growth of a number of fully-fluorinated and very long-lived greenhouse gases, with life-times on the order of a thousand years or more, has been observed; e.g. CF4 and C2F6 (Worton et al., 2007), C3F8
(M¨uhle et al., 2010), c-C4F8(Oram et al., 2012), NF3(Weiss
et al., 2008) and SF6(Levin et al., 2010). These gases have
exceptionally high Global Warming Potentials (GWPs), in some cases on the order of several thousand times that of CO2, and thus their unconstrained growth would be of
con-siderable concern for the radiative forcing of climate. In 2000 we reported our discovery of another, entirely un-expected, perfluorocarbon, namely SF5CF3 (Sturges et al.,
2000). The term “super” greenhouse gases has been coined for this and other related and mainly sulfur-containing flu-orocarbon gases (Gerstell et al., 2001). The presence of this gas was initially noticed as unidentified mass chromato-graphic peaks with m/z ratios representative of CF+3 and SF+5 ions during measurements of chlorofluorocarbons and SF6
in air samples from the middle stratosphere. The appear-ance of this substappear-ance in air samples from above 32 km alti-tude immediately implied that the “mystery” compound had to be long-lived. Two features marked this compound out as exceptional. Firstly, we determined that as a molecule it had the highest radiative forcing efficiency of any gas yet measured in the atmosphere (0.57 W m−2ppb−1). Secondly,
it appeared to have grown in the atmosphere, between the mid-20th century and 1999, at almost exactly the same rate as SF6, to which it is closely chemically related. From
this circumstantial evidence we concluded that its origins might be related to those of SF6, and we conjectured that
it might be formed from high energy arc discharge in elec-trical equipment containing SF6as a high voltage dielectric.
3654 W. T. Sturges et al.: Emissions halted of the potent greenhouse gas SF5CF3
Indeed there has since been some laboratory evidence for this (Huang et al., 2005; Solovev et al., 2007). Immediately fol-lowing publication of our article, however, an open letter to the publishing journal from the company 3M stated that “one source of this compound is as a by-product of the manufac-ture of certain 3M fluorochemicals” (Santoro et al., 2000). It transpired that the relevant process was electrochemical flu-orination for the production of perfluorooctanyl sulphonate, (PFOS) and other fluorosurfactants, used in the manufacture of foams and stain-resist coatings. They went on to note that these production operations were to be imminently cur-tailed in the USA. In a subsequent personal communication, their bottom-up emission estimates were evidently close to the global emission rate that we had deduced from observa-tions.
We have updated the time series of atmospheric measure-ments from our original publication, and find that SF5CF3
has ceased to increase in the atmosphere, whereas the abun-dance of SF6 has continued to rise unabated. This clearly
demonstrates that our original supposition that SF5CF3
orig-inates from the degradation of SF6was incorrect, and that
all evidence now points to 3M being correct in their earlier assertion and that, as they predicted, emissions of this green-house gas have subsequently reduced to the point where they are no longer distinguishable by observation from zero.
2 Methodology
2.1 Sampling and analysis
The majority of the samples collected at Cape Grim, Tas-mania (40.4◦S, 144.4◦E) since 1994 were pumped directly into 3-dm3 electrochemically passivated (Rasmussen) or Silcosteel-treated (Restek Corp.) stainless steel canisters at a pressure of ca. 2 atmospheres using a metal bellows air pump. Prior to 1994, the samples analysed were sub sam-pled from the parent Cape Grim air archive contained at high pressure (ca. 30 atmospheres) in large (35 dm3) stain-less steel vessels. In all cases the air samples were collected under baseline (clean marine air) conditions. Details of the Cape Grim air archive and sampling techniques have been reported elsewhere (Oram et al., 1995; Fraser et al., 1999). Analyses were carried out using gas chromatography separa-tion followed by detecsepara-tion with an EBE configurasepara-tion triple-sector mass spectrometer (Waters/Micromass “Autospec”). Two slightly different techniques were employed using dif-ferent capillary columns in the case of the Cape Grim air samples. In the first instance samples were preconcentrated on a glass bead trap cooled to −185◦C and separated on a Chrompack KCl-passivated alumina PLOT column. In the second case the samples were preconcentrated on a Hayesep D-packed trap cooled to −78◦C. The two techniques are de-scribed in detail in Oram et al. (2012). Samples from NEEM and CARIBIC (see below) were exclusively analysed using
the GasPro column. Analytical uncertainties were assessed from the reproducibility of duplicate samples and frequent calibration standard measurements.
To determine a corresponding trend of SF5CF3 in the
Northern Hemisphere we also made measurements on air pumped from deep snow (firn) in northern Greenland (the North Greenland Eemian Ice Drilling project, NEEM; www. neem.nbi.ku.dk), which contains air dating from the early 20th century (Buizert et al., 2011). The sampling for trace gases at NEEM is described in Buizert et al. (2011) and Laube et al. (2010).
Finally, measurements were also made on 49 air sam-ples collected from a Lufthansa aircraft during four flights at cruising altitudes of 8.6 to 12.2 km between Frankfurt, Germany and Cape Town/Johannesburg, South Africa in the period October 2009 to March 2011 in the framework of the CARIBIC project (Brenninkmeijer et al., 2007; www. caribic-atmospheric.com).
2.2 2-D atmospheric modelling
A 2-D global atmospheric chemistry-transport model was used to derive “top-down” emission estimates of SF5CF3
from the measurements made at Cape Grim. The model grid is divided into 24 equal area, longitudinally-averaged bands and has 12 vertical layers each of 2 km depth. The model has been described elsewhere (Hough 1989, 1991) and has been used to study the temporal behaviour and global distribution of other halocarbons (Fraser et al., 1999; Reeves et al., 2005; Laube et al., 2010; Oram et al., 2012). The latitudinal dis-tribution of emissions is based on an even split between the two main production sites of PFOS by 3M, Decatur, Alabama (34◦N, 87◦W) and Antwerp, Belgium (51◦N, 4◦E) (Paul et al., 2009). An atmospheric lifetime of 890 yr was assumed for SF5CF3 (Montzka et al., 2011; Miller et al., 2002), and
the annual emissions in the model were adjusted until the pre-dicted concentrations matched the Cape Grim observations.
2.3 Modelling trace gas transport in firn
The relationship between past atmospheric trends and con-centration profiles in firn can be established using models of trace gas transport in firn, which is dominated by diffusion but is also subject to gravitational fractionation, firn sink-ing and gas trappsink-ing effects. Here we use a direct model of transport in firn as described by Witrant et al. (2011), which includes the main modelling principles proposed by Rom-melaere et al. (1997), Fabre et al. (2000) and Martinerie et al. (2009). We use a firn diffusivity profile for the conditions at NEEM that has been evaluated using nine reference gases: CO2, CH4, SF6, HFC-134a, CH3CCl3, 14CO2, CFC-11,
CFC-12 and CFC-113 as described in Buizert et al. (2011). The diffusion coefficient for SF5CF3 was taken to be the
same as that used in our earlier study (i.e. 0.0562 cm2s−1, or 0.467 relative to that of CO2; Sturges et al., 2000).
0.00 0.04 0.08 0.12 0.16 1955 1960 1965 1970 1975 1980 1985 1990 1995 2000 2005 2010 2015 Year S F5 C F3 ( p p t)
Cape Grim observations (GasPro) Cape Grim observations (Al-PLOT) Dome C firn air reconstruction CARIBIC flights
Fifth-order sigmoid fit +/-1 sigma sigmoid fit Atmospheric model fit 'Predicted' from SF6 0.13 0.14 0.15 0.16 0.17 2000 2005 2010
Fig. 1. The atmospheric record of SF5CF3 from measurements made in air collected at Cape Grim, Tasmania; in firn air collected at Dome Concordia, Antarctica; and in air collected between 8.6 and
12.2 km and 47◦N–28◦S from the CARIBIC aircraft. The dashed
blue-green line is a least mean squares optimisation fit to a subset of the Cape Grim (see text) and Dome Concordia measurements (pre-1978) with the uncertainty of the fit shown as black dashed lines. The red line (almost indistinguishable from the blue-green line) is the output mixing ratio from the atmospheric model run for the lo-cation of Cape Grim using the emissions shown in Fig. 2. The blue
broken line shows the “predicted” SF5CF3assuming a constant
ra-tio to SF6(see text). The inset figure is an expansion of the main
graph between the dates 2000–2011.
3 Results and discussion
The Cape Grim measurements are compiled in Fig. 1 as red diamonds for the measurements made with the GasPro cap-illary column, and green dashes for those made with the Al-PLOT capillary column. There is excellent agreement between the two sets of analyses for the overlapping pe-riods. The Al-PLOT measurements, however, had some-what lower precision and were more scattered. The rea-son for this is not entirely clear (it might relate to slightly higher column bleed) as other gases showed generally excel-lent precision by the same method (e.g. Worton et al., 2007). Also shown, as blue circles, are the measurements from the original SF5CF3 paper. These were all from measurements
in Antarctic firn air (Dome Concordia) and the dates have been estimated from co-measurements of SF6 as described
in Sturges et al. (2000). The tabulated dates so determined can be found at the Carbon Dioxide Information Analysis Center (cdiac.ornl.gov/trends/otheratg/sturges/sturges.html). The Dome C measurements usefully extend the southern hemispheric trend to dates before that of first Cape Grim measurements. The final set of measurements shown in Fig. 1 (purple squares) are the means of the measurements from the flights of the CARIBIC aircraft in 2009, 2010 and 2011 in the upper troposphere and lower stratosphere. These agree very well with the last few years of SF5CF5
measure-ments at Cape Grim, which is discussed further below.
Due to the greater scatter of the Cape Grim Al-PLOT mea-surements, we have based our subsequent model and curve fitting on the Cape Grim GasPro measurements, but we have also included the Dome C measurements prior to 1978 to de-fine the earlier part of the trend. A five-parameter sigmoid expression (SPSS, now Systat Software, SigmaPlot Version 7) has been used to fit a smoothed line to the points (dashed blue-green line), as this allows an envelope of uncertainty to be plotted based on the ±1 sigma deviation of the fit (dashed black lines). The 2-D atmospheric model output for the sur-face grid box for the latitude of Cape Grim is shown as a solid red line. This is barely distinguishable from the sig-moidal line fit, and falls entirely within the deviation of the latter, as can be better seen in the expanded panel (inset to Fig. 1). We therefore judge that the model fit represents well the observed trend.
The final curve plotted in Fig. 1, shown as a blue broken line, is a calculation of the SF5CF3abundance expected had
it exhibited the same relative molar abundance to SF6as was
assumed in the modelling study from our original paper, i.e. a ratio to SF6of 3.05 × 10⁻². After 2002 it is clear that the
apparent relationship between SF5CF3and SF6began to
di-verge, with the latter continuing to grow whilst the SF5CF3
abundance began to stabilise. It can, therefore, be concluded that the emission of SF5CF3is not linked to that of SF6,
con-trary to our original hypothesis.
The measurements in Fig. 1 demonstrate the absence of significant emissions of SF5CF3 prior to the late 1960s,
which is consistent with large-scale manufacture of PFOS having begun after 3M acquiring the patent for electrochem-ical fluorination in the 1950s. The first evidence for an un-ambiguous decrease in the atmospheric growth rate appears to have been around 2000, since which time the growth rate has declined rapidly. For the model to agree with the sig-moidal line fit, it was necessary to continue a small emission to the atmosphere after 2003 (see below). However, a model run (not shown) in which emissions were allowed to continue until 2003, and were then reduced to zero thereafter, resulted in a small decline in SF5CF3(less than 1 % or 0.001 ppt)
be-tween 2003 and 2011, but which still fell within the uncer-tainty of the measurements. Equally, a longer atmospheric lifetime would imply emissions closer to zero, as noted in a sensitivity test with a lifetime of 3000 yr (not shown).
Rosiek et al. (2007) reported an upward trend in SF5CF3
(measured by gas chromatography with a modulated electron capture detector) between 2001 and 2003 in Krakow, Poland that is not consistent with the timing of the “turn over” in northern hemispheric abundances from this study. The 2-D model used here, tuned to the Cape Grim record, sug-gests that growth in the Northern Hemisphere would have stopped after about 2001. Measurements by Busenberg and Plummer (2008) of the growth of SF5CF3(also by electron
capture detector) since the late 1980s from various sites in North America are in broad agreement with our measure-ments, and also suggest a possible turn over in concentrations
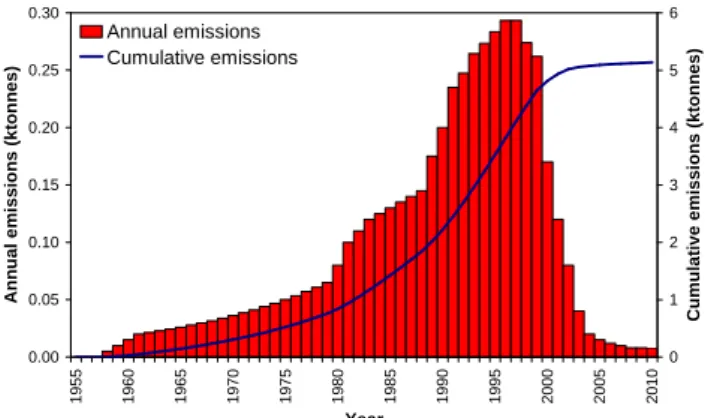
3656 W. T. Sturges et al.: Emissions halted of the potent greenhouse gas SF5CF3 0.00 0.05 0.10 0.15 0.20 0.25 0.30 1 9 5 5 1 9 6 0 1 9 6 5 1 9 7 0 1 9 7 5 1 9 8 0 1 9 8 5 1 9 9 0 1 9 9 5 2 0 0 0 2 0 0 5 2 0 1 0 Year A n n u a l e m is s io n s ( k to n n e s ) 0 1 2 3 4 5 6 C u m u la ti v e e m is s io n s ( k to n n e s ) Annual emissions Cumulative emissions
Fig. 2. The model-derived annual and cumulative emissions of
SF5CF3used to produce the atmospheric model fit scenario
pre-sented in Fig. 1 (the red line in Fig. 1).
since 2000, although it is difficult to be certain given the rel-atively large scatter in their reported measurements. It is not clear if analytical methodologies might have contributed to some of the discrepancies noted between these different stud-ies.
The annual emissions used in the atmospheric model to reproduce the observed atmospheric abundance of SF5CF3
are shown in Fig. 2. Emissions rose year-on-year from the 1960s to the 1990s, peaking in 1996 and 1997 at around 300 tonnes yr−1, before progressively declining. The decline was very rapid from about 2000 to 2003. As discussed above, we cannot confidently distinguish the emissions shown after 2003 (around 10 tonnes yr−1)from zero.
The same model run can also be used to produce a tempo-ral trend for the latitude and elevation relevant to the Green-land firn air sampling site. This trend can then be used as input to the firn diffusion model to derive an expected depth profile for SF5CF3. This is shown in Fig. 3 (line) along
with the actual measurements made in the firn air (symbols). There is very good agreement suggesting excellent compati-bility between the two sets of measurements and further val-idation of the modelled atmospheric distribution of SF5CF3.
While atmospheric abundances were rising, e.g. during the 1990s, the model computes significant global latitudinal con-centration gradients, and significant altitudinal gradients in the Northern Hemisphere. For example, for the year 1996 the model predicts 21 % higher SF5CF3mixing ratios in the
Arctic than in the Antarctic. From about 2004 onwards, how-ever, the model predicts no significant altitudinal or latitudi-nal gradient. The latter prediction is confirmed by the close similarity observed between the CARIBIC measurements in 2009, 2010 and 2011 in the upper troposphere/lower strato-sphere, and the ground level measurements from NEEM (al-beit at 3 km) and those from Cape Grim (Fig. 1). Figure 4 further illustrates that, by the date of the aircraft flights, there was no evidence of a latitudinal gradient in SF5CF3, which
also confirms the absence of further significant emissions to
0.00 0.04 0.08 0.12 0.16 0.20 0 10 20 30 40 50 60 70 80 90 Depth (m) S F5 C F3 ( p p t) Measurements Model
Fig. 3. The observed amounts (symbols) of SF5CF3in samples col-lected at different depths of firn at the NEEM drilling site, Green-land. The purple line is the result of taking the long-term trend of the gas in the atmospheric model domain box appropriate for NEEM, based on the best fit to Cape Grim (red line in Fig. 1), and used as input to the firn diffusion model.
0.12 0.13 0.14 0.15 0.16 0.17 0.18 -40 -20 0 20 40 Latitude (°N) M ix in g r a ti o ( p p t) 27/10/2009 28/10/2009 14/11/2010 20/03/2011
Fig. 4. Measurements of SF5CF3from whole air samples collected from four interhemispheric CARIBIC flights flying at 8.6–12.2 km, as a function of latitude.
the atmosphere, such that the mixing ratio of this gas had equilibrated throughout the global atmosphere.
3M stated that a phase-out of PFOS manufacture was de-cided upon in 2000 (statement on “3M’s Phase Out and New Technologies” at solutions.3m.com/wps/portal/3M/en US/PFOS/PFOA/Information/phase-out-technologies/), but also that overall greenhouse gas emissions (not just SF5CF3)
had been reduced 40 % since 1995 (Santoro, 2000). The PFOS phase-out was supposedly completed in 2002 (see “statement” above on 3M’s web site). Our results con-firm that there was indeed a rapid decline in emissions be-tween 2000 and 2003, although the uncertainties in our observations preclude us from determining whether emis-sions actually ceased in 2003. Nevertheless, these find-ings strongly suggest that SF5CF3 emissions are indeed
uniquely associated with such fluorochemical production. 3M state that associated fluorochemical production contin-ued via a subsidiary (Dyneon), albeit using perfluorooctanoic
acid (PFOA) not PFOS, but this too ceased in 2008 (see 3M “statement”). A number of companies worldwide continue to manufacture related perfluorocarboxylates (Rennner, 2006) but, it appears from our observations, without incurring sub-stantial emissions of SF5CF3. 3M themselves have
subse-quently switched to processes that produce perfluorobutane sulfonate (PFBS) instead of the more toxic PFOS (3M “state-ment” and Renner, 2006).
4 Conclusions
The combined dataset from the Cape Grim atmospheric air archive, northern and southern hemispheric firn air, and interhemispheric aircraft flights results in a consistent at-mospheric trend for SF5CF3 from the mid-20th century to
2011. Although the maximum atmospheric abundance of this molecule has never exceeded more than a small amount (0.15 ppt), and thus currently contributes only minutely to climate forcing (Sturges et al., 2000), it (along with the other fully-fluorinated species referred to in the Introduction) rep-resents an essentially irreversible change to the composition of the Earth’s atmosphere and to the radiative forcing of the climate. The present cessation (or near-cessation), and pre-sumed future avoidance of further emissions of this gas, is therefore to be welcomed.
Supplementary material related to this article is
available online at: http://www.atmos-chem-phys.net/12/ 3653/2012/acp-12-3653-2012-supplement.zip.
Acknowledgements. WTS, DEO and JCL acknowledge the UK Natural Environment Research Council (NERC) for awards NE/F021194/1 (NEEM), R8/H12/38/012 (NCAS Composition) and NE/F015585/1 (NERC Fellowship) respectively. CH and MJN were both supported by NERC Doctoral Studentships. We thank Michael Leist and the staff of the Cape Grim Baseline Station and the CSIRO GASLAB for collection and maintenance of the Cape Grim air archive. The Cape Grim programme has previously received funding from the former UK Government Department of Environment (GA/4/2/57). The CARIBIC programme has previ-ously received funding from UK NERC (NER/T/S/2000/01040 and GST/02/2218) and the European Union (EVK2-GT2001-00101). We are grateful to the entire CARIBIC team and all its partners. We are indebted to Jakob Schwander of the Physics Institute at the University of Berne, Switzerland for collecting the NEEM firn air samples. NEEM is directed and organized by the Center of Ice and Climate at the Niels Bohr Institute and US NSF, Office of Polar Programs. It is supported by funding agencies and institutions in Belgium (FNRS-CFB and FWO), Canada (GSC), China (CAS), Denmark (FIST), France (IPEV, CNRS/INSU, CEA and ANR), Germany (AWI), Iceland (RannIs), Japan (NIPR), Korea (KOPRI), The Netherlands (NWO/ALW), Sweden (VR), Switzerland (SNF), United Kingdom (NERC) and the USA (US NSF, Office of Polar Programs).
Edited by: T. Blunier
References
Brenninkmeijer, C. A. M., Crutzen, P., Boumard, F., Dauer, T., Dix, B., Ebinghaus, R., Filippi, D., Fischer, H., Franke, H., Frieß, U., Heintzenberg, J., Helleis, F., Hermann, M., Kock, H. H., Koep-pel, C., Lelieveld, J., Leuenberger, M., Martinsson, B. G., Miem-czyk, S., Moret, H. P., Nguyen, H. N., Nyfeler, P., Oram, D., O’Sullivan, D., Penkett, S., Platt, U., Pupek, M., Ramonet, M., Randa, B., Reichelt, M., Rhee, T. S., Rohwer, J., Rosenfeld, K., Scharffe, D., Schlager, H., Schumann, U., Slemr, F., Sprung, D., Stock, P., Thaler, R., Valentino, F., van Velthoven, P., Waibel, A., Wandel, A., Waschitschek, K., Wiedensohler, A., Xueref-Remy, I., Zahn, A., Zech, U., and Ziereis, H.: Civil Aircraft for the reg-ular investigation of the atmosphere based on an instrumented container: The new CARIBIC system, Atmos. Chem. Phys., 7, 4953–4976, doi:10.5194/acp-7-4953-2007, 2007.
Buizert, C., Martinerie, P., Petrenko, V. V., Severinghaus, J. P., Trudinger, C. M., Witrant, E., Rosen, J. L., Orsi, A. J., Rubino, M., Etheridge, D. M., Steele, L. P., Hogan, C., Laube, J. C., Sturges, W. T., Levchenko, V. A., Smith, A. M., Levin, I., Con-way, T. J., Dlugokencky, E. J., Lang, P. M., Kawamura, K., Jenk, T. M., White, J. W. C., Sowers, T., Schwander, J., and Blunier, T.: Gas transport in firn: multiple-tracer characterisation and model intercomparison for NEEM, Northern Greenland, Atmos. Chem. Phys. Discuss., 11, 15975–16021, doi:10.5194/acpd-11-15975-2011, 2011.
Busenberg, E. and Plummer, L. N.: Dating groundwater with
tri-fluoromethyl sulfurpentafluoride (SF5CF3), sulfur hexafluoride
(SF6), CF3Cl (CFC-13), and CF2Cl2(CFC-12), Water Resour.
Res., 44, W02431, doi:10.1029/2007WR006150, 2008. Fabre, A., Barnola, J.-M., Arnaud, L., and Chappellaz, J.:
Determi-nation of gas diffusivity in polar firn: Comparison between ex-perimental measurements and inverse modelling, Geophys. Res. Lett., 27, 557–560, doi:10.1029/1999GL010780, 2000. Fraser, P. J., Oram, D. E., Reeves, C. E., Penkett, S. A., and
Mc-Culloch, A.: Southern Hemispheric halon trends (1978–1998) and global halon emissions, J. Geophys. Res., 104, 15985– 15999, 1999.
Gerstell, M. F., Francisco, J. S., Yung, Y. L., Boxe, C., and Aaltonee, E. T.: Keeping Mars warm with new super greenhouse gases, P. Natl. Acad. Sci., 98, 2154–2157, doi:10.1073/pnas.051511598, 2001.
Hough, A. M.: The development of a two-dimensional global tro-pospheric model, 1, the model transport, Atmos. Environ., 23, 1235–1261, 1989.
Hough, A. M.: Development of a two-dimensional global tropo-spheric model: Model chemistry, J. Geophys. Res., 96, 7325– 7362, 1991.
Huang, L., Zhu, L., Pan, X., Zhang, J., Ouyang, B., and Hou, H.:
One potential source of the potent greenhouse gas SF5CF3: The
reaction of SF6with fluorocarbon under discharge, Atmos.
Env-iron., 39, 1641–653, doi:10.1016/j.atmosenv.2004.11.013, 2005. Laube, J. C., Martinerie, P., Witrant, E., Blunier, T., Schwan-der, J., Brenninkmeijer, C. A. M., Schuck, T. J., BolSchwan-der, M., R¨ockmann, T., van der Veen, C., B¨onisch, H., Engel, A., Mills, G. P., Newland, M. J., Oram, D. E., Reeves, C. E., and Sturges, W. T.: Accelerating growth of HFC-227ea (1,1,1,2,3,3,3-heptafluoropropane) in the atmosphere, Atmos. Chem. Phys., 10, 5903–5910, doi:10.5194/acp-10-5903-2010, 2010.
3658 W. T. Sturges et al.: Emissions halted of the potent greenhouse gas SF5CF3
Levin, I., Naegler, T., Heinz, R., Osusko, D., Cuevas, E., Engel, A., Ilmberger, J., Langenfelds, R. L., Neininger, B., Rohden, C. v., Steele, L. P., Weller, R., Worthy, D. E., and Zimov, S. A.: The global SF6 source inferred from long-term high precision atmo-spheric measurements and its comparison with emission invento-ries, Atmos. Chem. Phys., 10, 2655–2662, doi:10.5194/acp-10-2655-2010, 2010.
Martinerie, P., Nourtier-Mazauric, E., Barnola, J.-M., Sturges, W. T., Worton, D. R., Atlas, E., Gohar, L. K., Shine, K. P., and Brasseur, G. P.: Long-lived halocarbon trends and budgets from atmospheric chemistry modelling constrained with mea-surements in polar firn, Atmos. Chem. Phys., 9, 3911–3934, doi:10.5194/acp-9-3911-2009, 2009.
Miller, T. M., Arnold, S. T., Viggiano, A. A., and Knighton, W. B.:
Electron attachment of SF5CF3 (296–563 K) and calculations
of the neutral and anion thermochemistry, J. Chem. Phys., 116, 6021–6027, doi:10.1063/1.1457442, 2002.
Montzka, S. A., Reimann, S. (Coordinating Lead Authors), Engel, A., Kr¨uger, K., O’Doherty, S., Sturges, W., Blake, D., Dorf, M., Fraser, P., Froidevaux, L., Jucks, K., Kreher, K., Kurylo, M., Mellouki, A., Miller, J., Nielsen, O.-J., Orkin, V., Prinn, R., Rhew, R., Santee, M., Stohl, A., and Verdonik, D.: Scien-tific Assessment of Ozone Depletion: 2010, Global Ozone Re-search and Monitoring Project, Report No. 52, 516 pp., Chapter 1, Ozone-Depleting Substances (ODSs) and Related Chemicals, World Meteorological Organization, Geneva, Switzerland, 2011. M¨uhle, J., Ganesan, A. L., Miller, B. R., Salameh, P. K., Harth, C. M., Greally, B. R., Rigby, M., Porter, L. W., Steele, L. P., Trudinger, C. M., Krummel, P. B., O’Doherty, S., Fraser, P. J., Simmonds, P. G., Prinn, R. G., and Weiss, R. F.: Perflu-orocarbons in the global atmosphere: tetrafluoromethane, hex-afluoroethane, and octafluoropropane, Atmos. Chem. Phys., 10, 5145–5164, doi:10.5194/acp-10-5145-2010, 2010.
Oram, D. E., Reeves, C. E., Fraser, P. J., and Penkett, S. A.: Mea-surements of HCFC-142b and HCFC-141b in the Cape Grim air archive: 1978–1993, Geophys. Res. Lett., 22, 2741–2744, doi:10.1029/95GL02849, 1995.
Oram, D. E., Mani, F. S., Laube, J. C., Newland, M. J., Reeves, C. E., Sturges, W. T., Penkett, S. A., Brenninkmeijer, C. A. M., R¨ockmann, T., and Fraser, P. J.: Long-term tropospheric trend of octafluorocyclobutane (c-C4F8 or PFC-318), Atmos. Chem. Phys., 12, 261–269, doi:10.5194/acp-12-261-2012, 2012. Paul, A. G., Jones, K. C., and Sweetman, A. J.: A First Global
Production, Emission and Environmental Inventory for Per-fluorooctane Sulfonate, Environ. Sci. Technol., 43, 386–392, doi:10.1021/es802216n, 2009.
Reeves, C. E., Sturges, W. T., Sturrock, G. A., Preston, K., Oram, D. E., Schwander, J., Mulvaney, R., Barnola, J.-M., and Chap-pellaz, J.: Trends of halon gases in polar firn air: implications for their emission distributions, Atmos. Chem. Phys., 5, 2055–2064, doi:10.5194/acp-5-2055-2005, 2005.
Renner, R.: The long and the short of perfluorinated replacements, Environ, Sci. Technol., 40, 12–13, doi:10.1021/es062612a, 2006. Rommelaere, V., Arnaud, L., and Barnola, J.: Reconstructing recent atmospheric trace gas concentrations from polar firn and bub-bly ice data by inverse methods, J. Geophys. Res., 102, 30069– 30083, 1997.
Rosiek, J., Lasa, J., Sliwka, I., and R´o˙za´nski, K.: Application of GC
and Modulated ECD for the Determination of SF5CF3Mixing
Ratios in the Atmosphere, Chem. Anal. (Warsaw), 52, 235–242, 2007.
Santoro, M. A.: Clarifying the SF5CF3record, Science, 290, p. 935,
2000.
Solovev, S., Palmentieri, A., Potekhina, N. D., and Madey, T. E.:
Mechanism for Electron-Induced SF5CF3 Formation in
Con-densed Molecular Films, J. Phys. Chem. C, 111, 18271–18278, 2007.
Sturges, W. T., Wallington, T. J., Hurley, M. D., Shine, K. P., Sihra, K., Engel, A., Oram, D. E., Penkett, S. A., Mulvaney, R., and Brenninkmeijer, C. A. M.: A Potent Greenhouse Gas
Identified in the Atmosphere: SF5CF3, Science, 289, 611–613,
doi:10.1126/science.289.5479.611, 2000.
Weiss, R. F., M¨uhle, J., Salameh, P. K., and Harth, C. M.: Nitro-gen trifluoride in the global atmosphere, Geophys. Res. Lett., 35, L20821, doi:10.1029/2008GL035913, 2008.
Witrant, E., Martinerie, P., Hogan, C., Laube, J. C., Kawamura, K., Capron, E., Montzka, S. A., Dlugokencky, E. J., Etheridge, D., Blunier, T., and Sturges, W. T.: A new multi-gas constrained model of trace gas non-homogeneous transport in firn: evaluation and behavior at eleven polar sites, Atmos. Chem. Phys. Discuss., 11, 23029–23080, doi:10.5194/acpd-11-23029-2011, 2011. Worton, D. R., Sturges, W. T., Gohar, L. K., Shine, K. P., Martinerie,
P., Oram, D. E., Humphrey, S. P., Begley, P., Gunn, L., Barnola, J.-M., Schwander, J., and Mulvaney, R.: Atmospheric Trends
and Radiative Forcings of CF4and C2F6Inferred from Firn Air,
Environ. Sci. Technol., 41, 2184–2189, doi:10.1021/es061710t, 2007.