HAL Id: hal-01346175
https://hal.archives-ouvertes.fr/hal-01346175
Submitted on 22 Jul 2016
HAL is a multi-disciplinary open access archive for the deposit and dissemination of sci-entific research documents, whether they are pub-lished or not. The documents may come from teaching and research institutions in France or abroad, or from public or private research centers.
L’archive ouverte pluridisciplinaire HAL, est destinée au dépôt et à la diffusion de documents scientifiques de niveau recherche, publiés ou non, émanant des établissements d’enseignement et de recherche français ou étrangers, des laboratoires publics ou privés.
No evidence for change of the atmospheric helium
isotope composition since 1978 from re-analysis of the
Cape Grim Air Archive
J Mabry, Tf Lan, C Boucher, Christine Boucher, P.G. Burnard, M Brennwald, R Langenfelds, Bernard Marty
To cite this version:
J Mabry, Tf Lan, C Boucher, Christine Boucher, P.G. Burnard, et al.. No evidence for change of the atmospheric helium isotope composition since 1978 from re-analysis of the Cape Grim Air Archive. Earth and Planetary Science Letters, Elsevier, 2015, �10.1016/j.epsl.2015.07.035�. �hal-01346175�
No evidence for change of the atmospheric helium
1isotope composition since 1978 from re-analysis of
2the Cape Grim Air Archive
34
Jennifer C. Mabry1*, Tefang Lan1$, Christine Boucher1, Peter G.
5
Burnard1, Matthias S. Brennwald2, Ray Langenfelds3 and Bernard
6
Marty1.
7 8
1: Centre de Recherches Pétrographiques et Géochimiques (CRPG-CNRS), 9
Université de Lorraine, BP20, 54501 Vandoeuvre-lès-Nancy Cedex, France 10
2: Eawag, Swiss Federal Institute of Aquatic Science and Technology, Department 11
of Water Resources and Drinking Water, 8600 Dübendorf, Switzerland 12
3: Centre for Australian Weather and Climate Research / CSIRO Oceans and 13
Atmosphere Flagship, Aspendale, Victoria, Australia 14
15
* Now at: Department of Earth Sciences, University of Oxford, OX1 3AN Oxford, 16
UK; Corresponding author: [email protected] 17
$
Now at: Institute(of(Earth(Sciences,(Academia(Sinica,(11529(Taipei,(Taiwan 18
19
Abstract
21The helium isotope composition of air might have changed since the
22
industrial revolution due to the release of 4He-rich crustal helium
23
during exploitation of fossil fuels. Thereby, variation of the atmospheric
24
helium isotope ratio (3He/4He) has been proposed as a possible new
25
atmospheric tracer of industrial activity. However, the magnitude of
26
such change is debated, with possible values ranging from 0 to about
27
2‰/yr (Sano, 1989; Hoffmann and Nier, 1993; Pierson-Wickmann et
28
al., 2001; Brennwald et al., 2013; Lupton and Evans, 2013). A new
29
analytical facility for high precision (2‰, 2σ) analysis of the 3He/4He
30
ratio of air has been developed at CRPG Nancy (France) capable of
31
investigating permil level variations. Previously, Brennwald et al.
32
(2013) analyzed a selection of air samples archived since 1978 at
33
Cape Grim, Tasmania, by the Commonwealth Scientific and Industrial
34
Research Organisation (CSIRO). They reported a mean temporal
35
decrease of the 3He/4He ratio of 0.23-0.30‰/yr. Re-analysis of aliquots
36
of the same samples using the new high-precision instrument showed
37
no significant temporal decrease of the 3He/4He ratio (0.0095 ±
38
0.033‰/yr, 2σ) in the time interval 1978-2011. These new data
constrain the mean He content of globally produced natural gas to
40
about 0.034% or less, which is about 3× lower than commonly quoted.
41 42 43
Introduction
44The helium isotopic composition of air may be able to provide a new
45
tracer for studying and quantifying environmental changes resulting
46
from global warming and anthropogenic activity. Due to their light
47
masses, the two isotopes of helium escape to space through thermal
48
and non-thermal processes (Ozima and Podosek, 2002).
49
Consequently, the helium content of air is low (5.24 ppm vol.,
50
Gluckauf, 1946) and the atmospheric He isotope ratio is a transient
51
value determined by variations of the strengths of sources (outgassing
52
of the solid earth, extraterrestrial contributions) and sinks (loss to
53
space) of 3He and of 4He over time (Ozima and Podosek, 2002). The
54
He isotope residence time in the atmosphere is of the order of 104-106
55
yr (Torgersen, 1989; Kockarts, 1973), much longer than the
56
atmospheric mixing time of 10 yr. Thus, the 3He/4He ratio of modern air
57
(1.34-1.40 x 10⁻⁶, Mamyrin et al., 1969; Clarke et al., 1975; Davidson
58
et al., 1988; Hoffmann and Nier, 1993; Sano et al., 1988) should be
59
constant on a decadal timescale. However, it has been suggested that
this may no longer be the case (Sano, 1989; Pierson-Wickmann et al.,
61
2001; Brennwald et al., 2013; Lupton and Evans, 2013).
62
The exploitation of fossil fuels (coal, liquid and gaseous
63
hydrocarbons) may have released large amounts of 4He during the
64
past couple of centuries and particularly the last few decades as
65
natural gas production has more than doubled between 1971 and
66
2012 (IEA, 2014). The recent rapid release of gases from these
67
reservoirs, which have concentrated crustal helium for tens to
68
hundreds of Ma, could have decreased the 3He/4He in the atmosphere
69
(Sano, 1989; Pierson-Wickmann et al., 2001; Brennwald et al., 2013).
70
Other anthropogenic extraction industries such as mining or quarrying
71
may also liberate unknown quantities of radiogenic He into the
72
atmosphere (Sano, 2010).
73
The only potential anthropogenic source of excess 3He that could
74
increase the atmospheric 3He/4He ratio is He produced during induced
75
U or Pu fission either in nuclear reactors or in nuclear weapons
76
(Lupton and Evans, 2004). However, anthropogenic nuclear He
77
sources can be relatively well quantified and do not contribute
78
significant He to the atmosphere (Lupton and Evans, 2004).
79
Studies on the atmospheric helium variations, summarized in
80
Brennwald et al. (2013) (e.g., compilation in their Table 1), resulted in
contradictory results, indicating either decreases in the 3He/4He ratio of
82
the order of 0.1-0.3 ‰/yr during the last few decades (Sano et al.,
83
2010; Matsuda et al., 2010), or no detectable change since at least
84
1973 (Lupton and Evans, 2013) or possibly 1956 (Hoffmann and Nier,
85
1993).
86
The study of Brennwald et al. (2013) is particularly relevant,
87
because it presents results of temporal atmospheric helium variations
88
from samples periodically archived in stainless steel containers since
89
1978 (Cape Grim Air Archive (CGAA), Tasmania; Langenfelds et al.,
90
1996). As these samples were collected from a single location,
91
Brennwald et al. (2013) argued that potential problems due to
92
geographical heterogeneities should not apply. Based on a statistical
93
analysis of repeated runs, Brennwald et al. reported a mean decrease
94
of the 3He/4He ratio of 0.23 to 0.30‰/yr during this period of time. In
95
contrast, Lupton and Evans (2013) did not observe any significant
96
difference between 3He/4He ratios measured in air samples taken at a
97
single location (La Jolla, California, USA) in 1973 and 2013. Together
98
with other data from different locations and periods of time, they
99
derived a mean rate of decrease of the 3He/4He ratio of
100
(0.014 ± 0.045)‰/yr (2σ), which is consistent with zero rate of change
101
over a 40-year period.
We have developed a dedicated facility at CRPG Nancy (France)
103
that permits the analysis of the 3He/4He ratio of air with a precision for
104
individual measurements of about 2‰ (2σ, Mabry et al., 2014) which
105
compares to about 14‰ (2σ, Brennwald et al., 2013). In order to
106
further investigate and better constrain the results reported by
107
Brennwald et al. (2013), we have analyzed aliquots of the same air
108
samples from the CGAA, as well as 5 further samples from years not
109
analyzed by Brennwald et al. (2013).
110 111
Method
112The CGAA is a series of air samples collected typically every three
113
months since 1978 at Cape Grim on the north-west tip of Tasmania.
114
For each sample, 1-2 m3STP of air is collected and stored in 35-L
115
stainless steel tanks. The sampling and storage conditions of the air
116
samples were considered with great care to avoid
117
pollution/contamination from cities and industry during sampling or
118
modification of the sampled air during storage. This is necessary to
119
provide a true baseline air sample for the southern hemisphere that
120
could be used for many years. Details of the CGAA sampling
121
procedure are documented in Langenfelds et al. (1996) and Brennwald
122
et al. (2013).
Subsamples for 3He/4He analysis were chosen from a selection of
124
ten archive tanks spanning the time period 1978 − 2011: 1978, 1979,
125
1984, 1988, 1993, 1997, 2000, 2004, 2008, 2011 (Table 1). Multiple
126
subsamples were collected from each tank in 1.2-m-long, 3/8’’-OD
127
copper tubes, which were sealed by cold-welding with a crimping tool
128
(Brennwald et al., 2013).
129
For measurement, a roughly 10 to 15 cm3 portion of the copper
130
tube is sealed off with a steel clamp and attached to the extraction line
131
using Swagelok Ultra-torr tube fittings and wrench-tightened. The
132
sample manifold is then evacuated, the pump isolated, and the copper
133
tube is opened to release the air sample into the extraction line for
134
purification and then measurement. A full description of the sample
135
processing and analysis is given in Mabry et al. (2013). Everything
136
aside from helium and neon is removed from the sample gas using a
137
series of getters and charcoal fingers. Then, the neon is separated
138
from helium using a cryo trap so that only the helium remains to be
139
admitted into the mass spectrometer. After purification of the sample, a
140
series of eleven standard-bracketed measurements are made. The
141
standard used for the bracketing measurements is derived from a
142
purified air standard collected from the Brittany coast. Note that this
143
standard He is enriched by 3.3% relative to the He isotope
composition of air, as a result of isotope fractionation during handling
145
and purification of a large quantity of air. We attempted the purification
146
procedure twice and obtained the same fractionation. The cause of
147
this fractionation, possibly related to thermal effects between hot traps
148
and traps at liquid N2 temperature, are not fully elucidated. For our
149
purpose however, the absolute value of the running standard has no
150
bearing on the results (provided that its 3He/4He composition is close
151
to that of air), because all samples are normalized to this common
152
running standard and therefore can be inter-compared. In particular,
153
we continuously calibrate atmospheric helium from local air (Brabois
154
Park close to Nancy) against this standard (see below). Gas pressures
155
of the purified sample aliquots are matched to within 2% of the
156
standard aliquot pressures through the use of an adjustable volume in
157
order to eliminate pressure effects in the mass spectrometer.
158
Additionally, local air sampled in a park near CRPG (Brabois Air) is
159
analyzed periodically to compare all samples under the same analysis
160
and sampling conditions, and so, to monitor the continued efficacy of
161
the purification procedure and measurement stability. The measured
162
3He/4He values of Brabois Air samples were very stable (standard
163
error 0.33 ‰, 2σ, N=83) over a year of measurements (Mabry et al.,
2013) over the same time period the CGAA sample measurements
165
were made.
166
167
Results and Discussion
168Helium in the Cape Grim Air Archive 169
In Table 1, we report measurements from a selection of
copper-170
tube subsamples from the CGAA. Particular effort was made to make
171
multiple measurements from the earliest (1978, 1979) and latest
172
(2008, 2011) subsamples since these would be the most likely to show
173
a detectable difference and would best constrain the trend over the
174
time period.
175
Three of the data points are statistically significant outliers. The
176
3
He/4He from 1988 and 2004 are 10-20‰ lower than all the other data
177
points, while the 3He/4He ratio of the 1984 subsample is about 4‰
178
lower than in the other samples (excluding 1988 and 2004). A
179
generalized extreme Studentized deviate (GESD) test (Appendix A,
180
Rosner, 1983) confirms the 1988 and 2004 data points as outliers with
181
99% confidence whether the test is run using the ratios or the
182
residuals of a best-fit linear time trend. This test assumes the dataset
is approximately normally distributed which we confirmed by a normal
184
probability plot (not shown).
185
The 1984 tank at CSIRO is suspected of having a small leak as was
186
noted in Brennwald et al. (2013). The nitrogen isotopes in this
187
particular storage tank were detectably fractionated and additional
188
testing showed a change in the relative concentrations of H2, CH4,
189
CO2, and N2O over time (Brennwald et al., 2013). These indicate a
190
small leak in this storage tank which would lead to a decrease in the
191
3He/4He over time as slightly more 3He effused out of the tank relative
192
to 4He, consistent with our data showing a lower 3He/4He(ratio(relative(
193
to( the( other( samples. We can correct for this effect using observed
194
changes in the concentrations of H2, CH4, CO2, and N2O and
195
Graham’s Law to calculate the expected fractionation of the helium
196
isotopes (as in Brennwald et al., 2013). The correction increases the
197
1984 3He/4He by about 3.5‰,( bringing( it to well within the scatter of
198
the rest of the data excluding 1988 and 2004 (Table 1). Neither the
199
1988 nor 2004 tanks at CSIRO show any evidence of leakage. Thus, it
200
seems likely that these samples were fractionated at some point after
201
subsampling, e.g., during storage or aliquoting of the subsamples. In
202
the following discussion, we will consider both the uncorrected and
203
effusion-corrected 1984 data but will exclude the 1988 and 2004 data.
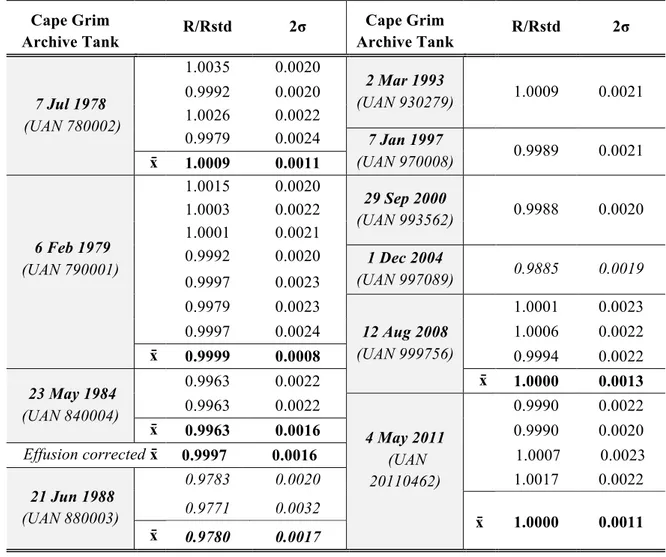
Table 1: Helium isotope ratios from different subsamples of the Cape Grim Air
205
Archive relative to our standard (R/Rstd) and then normalized to the overall mean 206
of the data. Where more than one measurement was made, the error-weighted 207
mean (x̄) and the error of the mean is reported. Numbers in italics have been 208
identified as statistical outliers. 209 Cape Grim Archive Tank R/Rstd 2σ Cape Grim Archive Tank R/Rstd 2σ 7 Jul 1978 (UAN 780002) 1.0035 0.0020 2 Mar 1993 (UAN 930279) 1.0009 0.0021 0.9992 0.0020 1.0026 0.0022 0.9979 0.0024 7 Jan 1997 (UAN 970008) 0.9989 0.0021 x̄ 1.0009 0.0011 6 Feb 1979 (UAN 790001) 1.0015 0.0020 29 Sep 2000 (UAN 993562) 0.9988 0.0020 1.0003 0.0022 1.0001 0.0021 0.9992 0.0020 1 Dec 2004 (UAN 997089) 0.9885 0.0019 0.9997 0.0023 0.9979 0.0023 12 Aug 2008 (UAN 999756) 1.0001 0.0023 0.9997 0.0024 1.0006 0.0022 x̄ 0.9999 0.0008 0.9994 0.0022 23 May 1984 (UAN 840004) 0.9963 0.0022 x̄ 1.0000 0.0013 0.9963 0.0022 4 May 2011 (UAN 20110462) 0.9990 0.0022 x̄ 0.9963 0.0016 0.9990 0.0020 Effusion corrected x̄ 0.9997 0.0016 1.0007 0.0023 21 Jun 1988 (UAN 880003) 0.9783 0.0020 1.0017 0.0022 0.9771 0.0032 x̄ 1.0000 0.0011 x̄ 0.9780 0.0017 210
An error-weighted least-squares fit (e.g. Baird, 1995) of the
211
3
He/4He with the uncorrected 1984 ratio (excluding 1988 and 2004)
212
results in a trend line with a slope that is essentially zero: (0.000 ±
213
0.033)‰/yr (2σ, Fig 1b). If the potential effusion effect on the 3He/4He
214
value obtained from the 1984 tank is considered, the slope
corresponds to a 3He/4He decrease of (0.0095 ± 0.033)‰/yr (2σ,
216
Fig 1b). The 3He/4He time series is therefore consistent with a constant
217
3
He/4He ratio and is constrained to a rate of decrease of less than
218
0.033‰/yr (2σ, assuming no effusion) or 0.042‰/yr (considering the
219
potential effusion effect of the 1984 tank) during 1978–2011.
220
This contrasts with the measurements of the CGGA reported by
221
Brennwald et al. (2013) of a decrease of 3He/4He during 1978–2011 of
222
(0.23 – 0.30 ± 0.16)‰/yr (2σ, Fig 1b). Although Brennwald et al. find
223
that their data are, in a statistical sense, more likely to be explained(by(
224 a(linear(decrease(than(by(a(constant(3 He/4He,(their(data(does(not(rule( 225 out(the(possibility(of(a(constant(3 He/4He(per(se.(The(new(measurement( 226
method( used( here( yields( much( less( scatter( of( the( data( for( replicate(
227
analyses( of( the( same( subsample( as( compared( to( those( reported( in(
228
Brennwald(et(al.((Fig(1a).(The(data(of(this(work(and(Brennwald(et(al.(
229
do( overlap( at( the( 2σ-level (Fig 1b) and thus taken together are
230
consistent with no(statistically(significant(change(in(the(helium(isotopes(
231
of(the(Cape(Grim(Air(Archive(over(the(measured(time(period,(but(the(
232
new( data( better( constrain( the( upper( limit( of( possible( change.
233
Furthermore,( this( result( is( in( good( agreement( with( recently( published(
234
data(by(Lupton(and(Evans((2013),(who(report(no(significant(change(in(
the(helium(isotopic(ratio((Fig(1b)(in(air(over(the(last(few(decades(and(a(
236
maximum(possible(decrease(of(3He/4He(of(0.059‰/yr (2σ).(
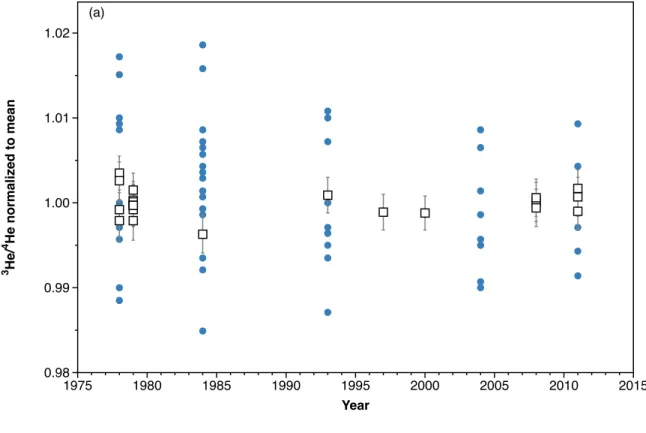
Figure 1: (a) The individual 3He/4He values from replicate analyses reported in Brennwald et al.
238
2013 (solid circles) and those measured in this work (open squares). Data are normalized to the
239
mean value of each respective data set to allow for direct comparison. (b) Shows the
error-240
weighted means of the individual replicate measurements on subsamples. The effusion corrected
241
1984 mean is shown with an open diamond. The error-weighted best-fit lines are shown for
242
Brennwald et al. 2013 (dashed line), this work with 1984 effusion corrected (solid line) and
243
uncorrected (dotted line). Also shown for comparison are data from Lupton and Evans (2013, solid
244
triangles). All errors are 2σ.
245 (a) 3 He/ 4 H e n o rm a li ze d to m e a n 0.98 0.99 1.00 1.01 1.02 Year 1975 1980 1985 1990 1995 2000 2005 2010 2015
(( Brennwald(et(al.((2013)(also(measured(He/Ne(ratios(of(the(same(
246
samples( and( did( not( observe( any( significant( trend( if( the( uncorrected(
247 1984(data(are(excluded.(If(the(change(in(helium(isotopic(ratio(were(due( 248 to(excess(4He(released(into(the(atmosphere(as(theorized,(this(should( 249 manifest(also(as(an(increasing(He/Ne(ratio(over(the(same(time(period.( 250
The( fact( that( they( saw( no( change( in( this( ratio( was( at( odds( with( their(
251
helium( isotope( data,( but( is( consistent( with( the( new( measurements( in(
252
this(work.((
253
Helium'in'natural'gas' 254
( The( constancy( of( the(3He/4He( ratio( over( the( last( few( decades( is(
255
inconsistent(with(available(estimates(for(He(isotope(fluxes(during(this(
256
period, which predict a decrease of the 3
He/4He ratio of about 0.1 ‰/yr
257 (b) Effusion correction 3 He/ 4 H e n o rm a li ze d to m e a n 0.995 1.000 1.005 Year 1970 1975 1980 1985 1990 1995 2000 2005 2010 2015
(Sano, 2010). These predictions are dependent on the global average
258
He content of natural gas, which has been estimated to be 0.1-0.25%
259
(Oliver et al., 1984). However, barring a credible source of excess 3He,
260
the data sets from this work and Lupton(and(Evans((2013) point to this
261
being a significant overestimation of the mean helium content in
262
natural gas produced globally.
263
These predicted He concentrations come primarily from the U.S.
264
Bureau of Land Management’s (previously Bureau of Mines) survey of
265
natural gas compositions (see e.g BLM, 2008). A straight average of
266
the helium compositions contained in this database yield an average
267
helium content of around 0.25 – 0.3%. However, Lupton( and( Evans(
268
(2013) noted that this data shows an inverse correlation between
269
helium content and reported production rate (open flow) of the well,
270
indicating that there may be an inverse relationship between helium
271
content and field size. Weighting the helium data by open flow brings
272
the average down to around 0.15%. Additionally, this database may
273
over-represent higher helium wells since it includes primarily data from
274
U.S. wells (~16,700 U.S. records vs 133 non-U.S.) which may have a
275
higher helium content then the rest of the world (non-U.S. average
276
helium content ~ 0.06%). And this database may even over-sample
277
higher helium wells within the U.S. as well since helium is an important
commodity. These factors suggest that the true average helium
279
composition is likely less than 0.15%.
280
If we look directly at helium production, Mohr and Ward (2014)
281
estimate that ~2.0 × 10¹¹ moles were produced world wide between
282
1921 and 2012. Assuming most of this helium made its way into the
283
atmosphere within a few years, it would lead to a decrease in the
284
atmospheric 3He/4He of about 0.0025‰/yr (or about 0.225‰ over the
285
91-year span). Narrowing the focus to just the period 1978-2011, we
286
have about 1.5 × 10¹¹ moles produced world wide (U.S. Geological
287
Survey, 2014), leading to a decrease in the atmospheric 3He/4He of
288
about 0.005‰/yr (or about 0.15‰ over the 33-year span). If we further
289
assume that helium is being extracted from most of the high-helium
290
natural gas wells, then the average helium content for the remaining
291
wells would be much lower. After accounting for helium production and
292
using an average natural gas production over the last three decades of
293
~1 × 10¹⁴ mol/yr (IEA, 2014), then we find the average helium content
294
of natural gas consistent with our data is at most 0.034% (2σ
295
maximum). This is roughly 3 - 7× lower than the commonly quoted
296 values of 0.1-0.25%. 297 ' 298
Conclusion
299We( have( reTanalyzed( the( He( isotope( composition( of( a( series( of( air(
300
aliquots( sampled( at( Cape( Grim,( Tasmania,( and( stored( in( stainless(
301
steel( taken( by( CSIRO.( We do not observe any significant change in
302
the(3He/4He( ratio over this time period and find the maximum rate of
303
decrease to be 0.033(–(0.042‰/yr (2σ); two outliers (1988 and 2004)
304
have been excluded from the compilation. We do not reproduce the
305
result( of( Brennwald( et( al.( (2013),( who,( based( on( the( analysis( of( air(
306
aliquots( from( the( same( series( reported( a( decrease( of( (0.23 – 0.30 ±
307
0.16)‰/yr of( the(3He/4He( ratio between 1978 and 2011. Our results
308
are consistent with previous reports that the He isotope composition of
309
air has not changed by more than 0.059‰/yr (2σ) between 1973 and
310
2013 (Lupton and Evans, 2013), and with the results of Hoffmann and
311
Nier (1993) who concluded there was no significant change in the
312
3He/4He(ratio(based(on(measurements(done(on(air(collected(between(
313
1956(and(1988. Our data suggests that the commonly reported mean
314
concentration of helium in natural gas is significantly over-estimated
315
(at least 3×) and is likely no more than 0.034%.
316
Given the inconsistency of reported atmospheric 3He/4He trends in
317
the literature, the discrepancy in measurements of the same CGAA
318
samples reported here and by Brennwald et al. (2013), and the
319
unexplained fractionation of the 1988 and 2004 samples, it is proposed
that a new subset of CGAA samples should be prepared by CSIRO
321
and analyzed at CRPG. These samples will be filled in stainless steel
322
flasks with valves, rather than the copper tubes used previously, and
323
will extend the time series to at least 2015. (
324
(
325
Acknowledgments 326
This project has been funded by the French Agence Nationale de la Recherche 327
(Project VIHA2) and by the European Research Council under the European
328
Community’s Seventh Framework Programme (FP7/2010-2016 grant agreement
329
no. 267255). The Deep Carbon Observatory also provided funding support. We
330
acknowledge the CSIRO and Cape Grim Baseline Air Pollution Station staff who
331
assisted with collection, analysis and maintenance of the CGAA samples, and Dr.
332
Paul Steele for helpful discussions relating to this work. Thanks also to helpful
333
comments from two anonymous reviewers, and to Editor Derek Vance.
334
(
335
Appendix'A:'Generalized'ESD'test'
336
For a data set which is approximately normally distributed, with mean (x̅) and
337
standard deviation (σ) the generalized extreme Studentized deviate (GESD) test
338
(Rosner, 1983) can detect multiple outliers. The test null hypothesis is that there
339
are no outliers in the data set, and the alternate hypothesis is that there are up to r
340
outliers. The test statistic (Ri)
341
!" = $%&'")'" − '
is calculated for the most extreme outlier first (maximum |xi − x̅|), and then that
343
data point (xi) is removed and the test statistic is recalculated until all potential
344
outliers have been removed.
345
After calculating the test statistic for each potential outlier (R1, R2, …, Rr),
346
the critical values can be calculated for significance level α: 347 *"$ = $ + − , -.,01"12 + − , − 1 + -.,01"125 + − , + 1 $, = 1, 2, … , 8 348 where 349 9 = 1 − : 2 + − , + 1 ( 350 ( 351
and tp,ν represents the pth percentile of a t distribution with ν degrees of freedom.
352
The number of outliers is determined by finding the largest i such that Ri > λi.
353 ' 354
References(
355
Baird, D.C., 1995. Experimentation: An Introduction to Measurement Theory and 356
Experiment Design, 3rd ed. Prentice-Hall, Englewood Cliffs, New Jersey. 357
Brennwald, M.S., Vogel, N., Figura, S., Vollmer, M.K., Langenfelds, R., Paul Steele, L., 358
Maden, C., Kipfer, R., 2013. Concentrations and isotope ratios of helium and other 359
noble gases in the Earth’s atmosphere during 1978–2011. Earth Planet. Sci. Lett. 360
366, 27–37. doi:10.1016/j.epsl.2013.01.039 361
BLM, 2008. Analyses of natural gases, 1917– October 2008, U.S. Bureau of Mines 362
Publication PB2009500006, National Technical Information Service, Alexandria, VA. 363
Clarke, W.B., Jenkins, W.J., Top, Z., 1976. Determination of tritium by mass spectrometric 364
measurement of 3He. Int. J. Appl. Radiat. Isot. 27, 515–522. doi:10.1016/0020-365
708X(76)90082-X 366
Davidson, T.A., Emerson, D.E., 1990. Direct Determination of the Helium 3 Content of 367
Atmospheric Air by Mass Spectrometry. J. Geophys. Res. 95, 3565–3569. 368
Gluckauf, E., 1946. A Micro-Analysis of the Helium and Neon Contents of Air. Proc. R. 369
Soc. A Math. Phys. Eng. Sci. 185, 98–119. doi:10.1098/rspa.1946.0007 370
Hoffman, J.H., Nier, A.O., 1993. Atmospheric Helium Isotopic Ratio. Geophys. Res. Lett. 371
20, 121–123. doi:10.1002/jms.1057 372
IEA, 2014. Key world energy statistics 2014, International Energy Agency, Paris. 373
(Available at 374
https://www.iea.org/publications/freepublications/publication/KeyWorld2014.pdf) 375
Kockarts, G., 1973. Helium in the terrestrial atmosphere. Space Sci. Rev. 14, 723–757. 376
Langenfelds, R.L., Fraser, P.J., Francey, R.J., Steele, L.P., Porter, L.W., Allison, C.E., 377
1996. The Cape Grim Air Archive: the first seventeen years, 1978-1995, in: Baseline 378
94-95. Bureau of Meteorology and CSIRO Division of Atmospheric Research, 379
Melbourne, pp. 53–70. 380
Lupton, J., Evans, L., 2004. The atmospheric helium isotope ratio: Is it changing? 381
Geophys. Res. Lett. 31, 4. doi:L13101 10.1029/2004gl020041 382
Lupton, J., Evans, L., 2013. Changes in the atmospheric helium isotope ratio over the past 383
40 years. Geophys. Res. Lett. 40, 6271–6275. doi:10.1002/2013GL057681 384
Mabry, J., Lan, T., Burnard, P., Marty, B., 2013. High-precision helium isotope 385
measurements in air. J. Anal. At. Spectrom. 28, 1903. doi:10.1039/c3ja50155h 386
Mamyrin, B.A., Anufriev, G.S., Kamenskii, I.L., Tolstikhin, I.N., 1970. Determination of the 387
isotopic composition of atmospheric helium. Geochem. Int. (Engl. Transl.) 7, 498– 388
505. 389
Matsuda, J.-I., Matsumoto, T., Suzuki, A., 2010. Helium in old porcelain: The historical 390
variation of the He isotopic composition in air. Geochem. J. 44, e5–e9. 391
Mohr, S., Ward, J., 2014. Helium Production and Possible Projection. Minerals 4, 130– 392
144. doi:10.3390/min4010130 393
Oliver, B.M., Bradley, J.G., Farrar IV, H., 1984. Helium concentration in the Earth’s lower 394
atmosphere. Geochim. Cosmochim. Acta 48, 1759–1767. 395
Ozima, M., Podosek, F.A., 2002. Noble Gas Geochemistry, 2nd ed. Cambridge University 396
Press. 397
Pierson-Wickmann, A.-C., Marty, B., Ploquin, A., 2001. Helium trapped in historical slags: 398
a search for temporal variation of the He isotopic composition of air. Earth Planet. Sci. 399
Lett. 194, 165–175. 400
Rosner, B, 1983. Percentage Points for a Generalized ESD Many-Outlier Procedure, 401
Technometrics, 25(2), 165-172. 402
Sano, Y., Furukawa, Y., Takahata, N., 2010. Atmospheric helium isotope ratio: Possible 403
temporal and spatial variations. Geochim. Cosmochim. Acta 74, 4893–4901. 404
doi:10.1016/j.gca.2010.06.003 405
Sano, Y., Wakita, H., 1988. Precise measurement of helium isotopes in terrestrial gases. 406
Bull. Chem. Soc. Jpn. 61, 1153–1157. 407
Sano, Y., Wakita, H., Makide, Y., Tominaga, T., 1989. A ten-year decrease in the 408
atmospheric helium isotope ratio possibly caused by human activity. Geophys. Res. 409
Lett. 16, 1371–1374. doi:10.1029/GL016i012p01371 410
Torgersen, T., 1989. Terrestrial helium degassing fluxes and the atmospheric helium 411
budget: Implications with respect to the degassing processes of continental crust. 412
Chem. Geol. Isot. Geosci. Sect. 79, 1–14. doi:10.1016/0168-9622(89)90002-X 413
U.S. Geological Survey, 2014. Helium statistics (through 2013; last modified 30 January 414
2015), in Kelly, T.D., and Matos, G.R., comps., Historical statistics for mineral and 415
material commodities in the United States (2013 version): U.S. Geological Survey 416
Data Series 140, accessed 28 June 2015, at 417
http://minerals.usgs.gov/minerals/pubs/historical-statistics/. 418
419