HAL Id: hal-02069843
https://hal.archives-ouvertes.fr/hal-02069843
Submitted on 15 Apr 2021
HAL is a multi-disciplinary open access archive for the deposit and dissemination of sci-entific research documents, whether they are pub-lished or not. The documents may come from teaching and research institutions in France or abroad, or from public or private research centers.
L’archive ouverte pluridisciplinaire HAL, est destinée au dépôt et à la diffusion de documents scientifiques de niveau recherche, publiés ou non, émanant des établissements d’enseignement et de recherche français ou étrangers, des laboratoires publics ou privés.
Low sedimentary accumulation of lead caused by weak
downward export of organic matter in Hudson Bay,
northern Canada
Benoit Thibodeau, Christophe Migon, Aurélie Dufour, André Poirier, Xavier
Mari, Bassam Ghaleb, Louis Legendre
To cite this version:
Benoit Thibodeau, Christophe Migon, Aurélie Dufour, André Poirier, Xavier Mari, et al.. Low sed-imentary accumulation of lead caused by weak downward export of organic matter in Hudson Bay, northern Canada. Biogeochemistry, Springer Verlag, 2017, 136 (3), pp.279-291. �10.1007/s10533-017-0395-9�. �hal-02069843�
Low sedimentary accumulation of lead caused by weak downward export of organic matter
1
in Hudson Bay, northern Canada
2 3 4
Benoit Thibodeau1,2, Christophe Migon3, Aurélie Dufour3, André Poirier4, Xavier Mari3,5, 5
Bassam Ghaleb4 and Louis Legendre3 6
7 8 9 10
1Department of Earth Sciences, The University of Hong Kong, Pokfulam Road, Hong Kong
11
2Swire Institute for Marine Science, The University of Hong Kong, Cape d'Aguilar Road, Shek
12
O, Hong Kong SAR 13
3Sorbonne Universités, UPMC, Université Paris 06, CNRS, Laboratoire d’Océanographie de
14
Villefranche-sur-mer (LOV), 181 Chemin du Lazaret, 06230 Villefranche-sur-Mer, France 15
4Geotop, Université du Québec à Montréal, Montréal, Canada
16
5Aix Marseille Université, CNRS/INSU, Université de Toulon, IRD, Mediterranean Institute of
17
Oceanography (MIO) UM 110, 13288, Marseille, France 18
19 20 21 22
Keywords: Vertical transfer, particulate matter, oligotrophy, ocean, climate change; carbon 23
budget 24
25
Abstract
26
Atmospheric input of anthropogenic lead increased globally over the last centuries. The 27
present study shows that the concentrations of lead in sediment cores from low-productivity 28
Hudson Bay, northern Canada, remained relatively constant over the last centuries. The lack of 29
imprint of the increased anthropogenic lead input in this marine environment is not consistent 30
with the increased lead concentrations in nearby lakes over the same period. In addition, the 31
observed trend in lead isotopic composition in our cores suggests an apparent progressive 32
overprint of anthropogenic lead during the 1900’s. In other words, isotopes clearly registered the 33
increasingly anthropogenic nature of lead in the sedimentary record, but total lead concentrations 34
remained constant, indicating that some process limited the export of lead to the sediment. These 35
observations point to a long-term limitation of the downward export of particles in Hudson Bay. 36
Given that the source of lead was the same for both Hudson Bay and neighboring high-37
productivity lakes, we hypothesize that the very low primary productivity of Hudson Bay waters 38
was responsible for the low vertical export of lead to marine sediments. We further propose that 39
primary productivity is the most important factor that generally drives the vertical export of 40
particulate matter, and thus hydrophobic contaminants, in near-oligotrophic marine environments. 41
43
1. Introduction
44
Atmospheric transportation of anthropogenic contaminants over thousands of kilometers 45
was reported in the late 1970s as the main mechanism explaining the presence of contaminants at 46
high latitude (Rahn et al. 1977; Barrie et al. 1981). However, the precise mechanisms by which 47
insoluble contaminants deposited at the water surface are exported to depth are still not 48
completely resolved. The settling velocity of individual atmospheric particles with a diameter 49
<5 µm (e.g. dust, sea spray, volcanic ash, anthropogenic material (De Angelis and Gaudichet 50
1991)) is null or very low in seawater, based on Stokes’s law (Buat-Ménard et al. 1989), and their 51
removal from the surface ocean depends on their aggregation with larger particulate biogenic 52
material. The adsorption/aggregation of lithogenic atmospheric material (mostly dust) on/with 53
organic particles are likely to increase the density, and thus the settling velocity of the resulting 54
aggregates (Deuser et al. 1983; Fowler et al. 1987; Alldredge and Silver 1988; Jackson and Burd 55
1998; Armstrong et al. 2002; Francois et al. 2002; Turner 2002; Burd and Jackson 2009). 56
However, recent studies indicate that, even if this ‘ballast effect’ probably increases the settling 57
velocity of the sinking material, it may not be the main determinant of the downward export flux 58
(Passow 2004; Heimbürger et al. 2014). 59
Tight coupling between primary productivity and downward fluxes of particulate organic 60
carbon (POC) has been observed in various marine regions (Gačić et al. 2002; Migon et al. 2002; 61
Boyce et al. 2010; Passow and Carlson 2012; Yool et al. 2013; Turner 2015). This indicates that 62
biological productivity can lead to efficient export of atmospheric material to the sediment by 63
inclusion of biogenic material in mineral-organic aggregates. Given that phytoplankton dynamics 64
is controlled by nutrient availability, the environmental conditions that control limiting nutrients 65
ultimately control the downward export of POC (Lampitt et al. 2010; Heimbürger et al. 2013). 66
Climate in the Arctic and more generally at high latitudes underwent dramatic changes 67
during the past decades (Macdonald et al. 2005). The 20th century was the warmest period in the 68
Arctic in at least 44,000 years (Miller et al. 2013), and environmental changes included increases 69
in precipitation and river discharge as well as declines in snow cover and sea-ice extent (ACIA 70
2004). While the effects of such changes on primary productivity could be variable over Arctic 71
shelves (Michel et al. 2015), they may have important consequences on the rates of contaminant 72
scavenging and export from surface to deep water. For example, Outridge et al. (2007) suggested 73
that the 20th century increase in the accumulation of Hg in the sediment of a Canadian high Arctic 74
lake had largely been driven by an increase in autochthonous primary productivity since 1854. 75
In the present study, we hypothesized that low primary productivity was the main forcing 76
factor that determined the sedimentation of atmospherically-deposited matter in Hudson Bay 77
during the last centuries. To test this hypothesis, we investigated the concentration and isotopic 78
signature of Pb in two sediment cores from Hudson Bay, and compared these values with already 79
published sedimentary records from nearby high-productivity lakes (Outridge et al. 2002). We 80
used Pb because its multiple isotopes allow the identification of sources. Moreover, the pollution 81
history of Pb is well documented, especially around Hudson Bay where Pb was measured in lake 82
sediments. Our hypothesis would be rejected if (1) the sedimentary accumulation of Pb during 83
the last century were the same in the sedimentary records of both low-productivity Hudson Bay 84
and high-productivity nearby lakes, thus indicating that primary productivity did not play a key 85
role in the vertical export of Pb, or (2) the recent isotopic composition of records from Hudson 86
Bay and surrounding lakes were not recording the same anthropogenic signal. 87
88
2. Materials and Methods
89
2.1. Study area
90
Hudson Bay has an area of about 841,000 km2, an average depth of 125 m (maximum 91
depth of 250 m), and slopes generally less than 2 degrees (Prinsenberg 1986). Dense cold saline 92
water enters the Bay from the northwest (Hudson Strait and Foxe Basin, located in the north of 93
Hudson Bay; Fig. 1). Circulation inside the Bay is cyclonic, with surface currents averaging 94
5 cm s-1 in summer, and 2-3 cm s-1 in winter when the Bay is ice-covered (Saucier and Dionne 95
1998). There is a surface outflow of relatively warm and fresh water to the northeast of the Bay 96
towards Hudson Strait. Estimates of the residence time of surface (fresh) water are quite variable 97
in the literature, i.e. they range from the order of one month to more than 6 years (Prinsenberg 98
1984; Jones and Anderson 1994; Granskog et al. 2009). Many rivers discharge freshwater in the 99
southern part of Hudson Bay, causing a strong latitudinal surface salinity gradient. The annual 100
discharge (710 km3 yr-1) is equivalent to an annual freshwater yield of about 65 cm over the 101
whole bay (Prinsenberg 1986). This freshwater inflow has a profound influence on the physical, 102
chemical and biological properties of the Bay because it fosters stratification of the water column, 103
which usually reduces vertical mixing and thus upward transport of nutrients (Prinsenberg 1986). 104
Although the intense stratification may suggest that Hudson Bay is oligotrophic, a recent study 105
indicates that even if the riverine inputs are relatively minor sources of nitrate, the inputs of 106
freshwater favor rather than impede primary productivity inshore by indirectly fostering the 107
entrainment and upwelling of deeper water to the surface (Kuzyk et al. 2010a). Because Hudson 108
Bay is semi-enclosed within the Canadian Shield, its geochemical characteristics are strongly 109
influenced by local factors such as the geological substrates that are drained by river runoff, wet 110
and dry atmospheric depositions, and seasonal sea-ice formation and melt. 111
112
113
Fig. 1: Map of Hudson Bay with major currents. The two red dots indicate the locations of our two
114
sediment cores at about 60°N (Stations HB-6 and A), the yellow dots indicate the locations of the two
115
lakes to which our data are compared in the discussion and the two straight arrows on the eastern side of
116
James Bay represent major river inputs.
117 118
Despite its remote location, Hudson Bay is subject to anthropogenic contamination 119
through medium to long-range atmospheric transport, as is most of Northern Canada (Barrie et al. 120
1992; Outridge et al. 2002; Outridge et al. 2007; Kuzyk et al. 2010a; Outridge et al. 2011). The 121
different potential sources of anthropogenic lead contamination in the Arctic were traced using 122
lead isotopes, as each source is characterized by a specific isotopic signature linked essentially to 123
the mined ore deposits (Sturges and Barrie 1987; Sturges et al. 1993). The sources thus identified 124
were located in Canada, the USA, Europe and Russia (Sturges and Barrie 1987; Sturges and 125 Barrie 1989). 126 127 2.2. Sediment cores 128
The two sediment cores used for this study (Table 1) were chosen to capture the 129
characteristics of water masses that enter Hudson Bay (station HB-6), and those that are at the 130
end of the cyclonic gyre (station A). The two cores were collected using a box-corer during the 131
MERICA cruise (étude des MERs Intérieures du Canada) in summers 2003 (station A) and 2004 132
(station HB-6). The sediment cores were collected and provided to us by Michel Starr (Maurice 133
Lamontagne Institute, Fisheries and Oceans Canada). Cores were stored in a cold room at 4°C 134
until 2006, when sub-samples were dried, crushed and stored at room temperature in the 135
laboratory. Analyses reported in this paper were performed in 2007 and 2010. Due to the 136
respective geographic locations of the two coring stations, the allochtonous material that reached 137
stations HB-6 and A originated from the western and eastern coasts of the Bay, respectively. The 138
proportion of marine organic carbon in the surface sediment in the vicinity of cores A and HB-6 139
was 80 to 85% of the total organic carbon, respectively (Kuzyk et al. 2009), stressing the 140
importance of autochthonous organic matter in the total organic sediment load of the two areas. 141
142
Station Lat. (°N) Long. (°W) Depth (m) Core length (cm) HB-6 60.94° 91.78° 120 24
A 60.17° 79.00° 130 30
Table 1: Characteristics of the two coring stations and cores. 143
144
2.3. Chronostratigraphy
145
The activity of 210Pb of dried and ground sediment samples was obtained indirectly by 146
measuring the decay rate of its daughter isotope 210Po (t1/2 = 138.4 days; a = 5.30 MeV) by alpha
147
spectrometry. Measurements were carried out more than 2 years after sampling to ensure that 148
secular equilibrium was reached. A 209Po spike was added to the samples to determine the 149
extraction efficiency. Polonium was extracted and purified by chemical treatments (reacted 150
sequentially with HCl, HNO3, HF and H2O2) and deposited on a silver disk (Flynn 1968). The
151
209Po and 210Po activities were measured with a silicon surface barrier a-spectrometer
152
(EGG&ORTEC type 576A). 153
Cesium-137 was measured on dried and ground sediment samples (1 cm3) by g-ray 154
spectrometry at 661.6 keV (g-ray yield = 85 %) using a low-background high-purity Ge well 155
detector (Canberra). Standard sediment (IAEA-300) was used to calibrate the yield of the 156
detector. Uncertainties were estimated for counting errors following the protocol of Not et al. 157
(2008). 158
Sedimentation accumulation rates (SAR) were calculated using the radioactive decay 159
constant (λ = 0.03114 yr-1) of 210Pb and the slope of the linear regression of the logarithm of
160
excess 210Pb (i.e. 210Pb scavenged from the water column) following the constant flux and
161
constant sedimentation model (CFCS), previously described by Sanchez-Cabeza and Ruiz-162
Fernández (2012). Excess 210Pb was estimated from the 210Pb activity (Fig 2; data in the online
163
supplement) minus the supported 210Pb (i.e. the 210Pb produced locally from 226Ra disintegration) 164
over depth. The supported 210Pb was estimated using the asymptotic value of 210Pb data at the 165
bottom of the core. The linear regression for sedimentation rates was applied to the middle part of 166
the core to avoid potential modern disturbance by bioturbation in the upper part of the core. We 167
considered that the topmost part of the core corresponded to the present time, as no sediment had 168
been lost during sampling. For the bottom part of the core, where no excess 210Pb was measured, 169
we assumed a constant sedimentation rate. 170
171
2.4. Isotope geochemistry
172
In a clean-room (class 100) environment, about 50 mg of dry sedimentary material were 173
dissolved in a Teflon bomb with a mixture of HF–HNO3 (10:1 ratio) on a hot plate at 110°C for
174
48 h, and then evaporated to dryness with a drop of HBr to help conversion to PbBr2. In order to
175
ensure high purity of the separated Pb, double-pass ion chromatography was performed on AG1-176
X8 resin in dilute HBr medium to remove matrix elements, followed by elution of Pb phase in 177
6M HCl (similar to Manhes et al., 1978). The procedural blank value was negligible (i.e. average 178
value of 42 pg Pb for 1,250,000 pg Pb of sample). Mass spectrometry was done on an IsoProbe 179
multi-collector ICP-MS, with an Aridus desolvating membrane as the introduction system. A 180
transmission of 480 V/ppm was achieved using this set-up. All isotopes of Pb were measured on 181
Faraday detectors with 1011 W resistors, with amplifiers cross-calibrated in the morning during 182
the plasma warm-up time. Mass bias of samples was obtained using the NBS-991 Tl doping 183
technique (with a Pb/Tl = 10 to 12), and the correlation between Pb and Tl mass biases was 184
calculated from the repeated analysis of NBS-981 (Belshaw et al. 1998). Long-term 185
reproducibility of the internal standard was better than 0.03% on isotopic ratios normalized to 186
204Pb. The external analytical uncertainty on the isotopic ratios normalized to 204Pb is on the third
187
digit (4th digit for the 206Pb/207Pb ratio). Any larger change in isotopic composition was thus
188
considered as significant. All reagents used were distilled in sub-boiling stills, and subsequently 189
diluted with Milli-Q water. 190
191
2.5. Lead and aluminium analysis
192
Lead concentrations were measured on sediment core samples, and aluminum (Al) 193
concentrations were used to normalize Pb. Aluminum was considered to be a purely lithogenic 194
element representative of the input of the detrital component into the sediment. Indeed, very little 195
or no Al of anthropogenic origin is thought to reach the study region, as the Hudson Bay is 196
extremely remote and there is no significant industrial release of Al in these water. Moreover, 197
aluminum is commonly used to normalize various elements because its natural sources highly 198
exceed its anthropogenic sources (Daskalakis and O’Connor 1995; Heimbürger et al. 2012; 199
Heimbürger et al. 2014; St. Pierre et al. 2015). All reagents were certified Suprapur® and
200
provided by Merck (Darmstadt, Germany). All samples were handled under laminar airflow in a 201
class-100 clean room. Dry bulk sediments were ground using an agate mortar. Thirty milligrams 202
of ground sediment were weighted using a precision balance (Sartorius MC 1, accuracy 0.01 mg), 203
and transferred to a Teflon flask. The organic and carbonate matrices were destroyed as follows: 204
2 mL HCl 37% and 1 mL HNO3 65% were added to the flask and heated at 130°C for 4 h. Next,
205
1 mL of HF 40% and 2 mL HNO3 65% were added to the flask to dissolve the silicate material,
206
which was then heated at 130°C for 4 h or until complete evaporation. The residue was 207
ultrasonically dissolved in 1 mL HNO3 1N, and made up to 9 mL with Milli-Q water. Trace
208
metal concentrations were measured using an Inductively Coupled Plasma Optical Emission 209
Spectrometer (SPECTRO ARCOS™) equipped with an autosampler (CETAC ASX-260™) and 210
an ultrasonic nebulizer (CETAC U5000AT™). Analytical procedures were validated using 211
international certified reference material (CRM) for sediment (NCS DC 75305 and IAEA-433), 212
aerosol (B3-0562). Replicates of CRM were always within the quoted confidence intervals 213
(values corresponding to "Certified" in Table 2). Detection limits (0.05 µg L-1 for Al, 0.01 µg L-1
214
for Pb) were defined as three times the standard deviation of blank measurements for each metal, 215
and relative standard deviations were always <10% (results of the validation procedure are given 216
in Table 2). The anthropogenic enrichment of samples was estimated based on the Pb/Al ratio of 217
each sample divided by the Pb/Al ratio of the oldest samples in each core, which represent the 218
closest to natural background value available for our region. As Al indicates terrestrial input, this 219
index was used as a qualitative index of the sedimentary accumulation trend of non-terrestrial Pb. 220 221 NCS-DC 75305 (µg g-1) IAEA 433 (µg g-1) B3-0562 (µg g-1) Aluminium Measured (mean) Certified 4.03 ± 0.297 4.08 ± 0.16 80.39 ± 3.030 78.30 ± 4.30 108.56 ± 1.37 107.91 ± 0.98 Lead Measured (mean) Certified 22.2 ± 0.622 22.0 ± 1.1 26.5 ± 0.329 26.0 ± 0.6 16.94 ± 0.334 17.055 ± 0.195 222
Table 2: Certified reference material (CRM) validation results. Measurements were averaged 223 from 3 replicates. 224 225 3. Results 226 3.1. Chronostratigraphy 227
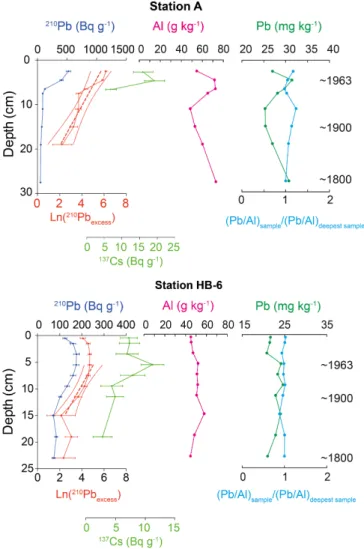
The chronology of all cores was based on 210Pb (Fig. 2, blue curves). At station A, the 228
surface sample was lost, and the first sample was thus at 2 cm. The 210Pb values decreased almost 229
linearly from 523 Bq g-1 at 2 cm to 88 Bq g-1 at 8 cm, after which they decreased slowly until 230
they reached the supported value of ~50 Bq g-1 at 27.5 cm. At station HB-6, 210Pb was about 231
123 Bq g-1 at the surface of the core, and progressively increased to 176 Bq g-1 at 6 cm, after
232
which it decreased linearly to reach the supported value of ~73 Bq g-1 at 15 cm. 233
We estimated the SAR using two approaches. Firstly, the CFCS model estimate yielded 234
sedimentation rates between 0.141 ± 0.032 cm yr-1 (r2 = 0.86) and 0.114 ± 0.024 cm yr-1 235
(r2 = 0.92) for cores A and HB-6, respectively. Secondly, 137Cs values peaked at 4.5 and 5.5 cm 236
for cores A and HB-6, respectively (Fig. 2). We calculated the SAR by dividing the depth of the 237
peak depth (4.5 and 5.5 cm) by the number of years between the time of sampling and 1963. 238
These 137Cs-derived sedimentation rates were consistent with the CFCS-derived rate (0.113 and 239
0.134 cm yr-1 for cores A and HB-6 respectively). 240
We hypothesized that the sedimentation rate was constant over the whole period covered 241
by each core, and estimated the age of the sediment by dividing its depth in the core (cm) using 242
constant sedimentation rates of 0.094 to 0.141 and 0.115 to 0.192 cm yr-1 for cores HB-6 and A, 243
respectively. The estimated years corresponding to different depths in each core are indicated in 244
Fig. 2 (dashed horizontal lines, corresponding to the range of sedimentation rate estimates for 245
each core). 246
Our estimated sedimentation rates are based on the assumptions that the topmost part of 247
the cores corresponded to the present time, and we used a constant sedimentation rate for the 248
bottom part. Despite the resulting uncertainties, our estimates of 0.094 to 0.141 and 0.115 to 249
0.192 cm yr-1 for cores HB-6 and A, respectively are consistent with values previously estimated 250
for these marine areas of Hudson Bay, i.e. 0.05 to 0.17 cm yr-1 (Kuzyk et al. 2009; Hare et al. 251
2010). We also observed a 206Pb/207Pb profile shift from the natural background to anthropogenic
252
value in the 1800’s, a sharper shift during the 1900’s, and a strong dominance of anthropogenic 253
lead in the late 1900’s (Fig. 3). However, because the resulting age estimates must be taken with 254
caution, we do not discuss here the precise timing of past events, but we examine instead the 255
general temporal trends of the lead concentrations and the isotope signature. 256
258
Fig. 2: Vertical profiles of 210Pb, 137Cs, Al and Pb in cores A (top) and HB-6 (bottom). Left panels. 210Pb
259
(Bq g-1; blue, upper scale) and natural log of excess lead-210 (red, lower scale); different scales are used
260
for the two stations. Red dashed lines: linear regressions of natural log of excess lead-210 on depth and
261
their 95% confidence intervals. Middle panels. Profiles of Al (pink, mg kg-1). Right panels. Pb
262
concentration (green, mg kg-1, upper scale), and enrichment ratio of Pb normalized to Al (blue, bottom
263
scale). The dashed horizontal lines correspond to increasing age with depth (years are indicated), and the
264
intervals indicate the uncertainties in our estimates. In the right panel, the enrichment ratio of Pb
265
normalized to Al is provided on a 0-to-2 scale, where 1 indicates no enrichment compared to the oldest
266
value recorded at the site, 2 represents a 2-time enrichment, and a value between 0 and 1 represents a
267
decrease of Pb/Al compared to the oldest recorded value.
268 269
3.2. Lead geochemistry
270
Bottom-to-top variations in concentrations of Al and Pb were different in the two cores 271
(Fig. 2, left and middle panels). At station A, Al and Pb increased by ∼30% from 10 to 4 cm (i.e. 272
from the 1800’s to the early 1900’s), after which they both decreased in the topmost samples. At 273
station HB-6, there was no strong vertical variation in either the Al or Pb profile. In both cores, 274
variations in the enrichment ratio normalized to Al were small (Fig. 2, right panel). There was a 275
strong positive correlation between Pb and Al in the two cores (station A: r = 0.95, Prob <0.0005; 276
station HB-6: r = 0.83, Prob <0.005). 277
278 279
Fig. 3: 206Pb/207Pb ratio in cores HB-6 and A. The dashed vertical line represents the isotopic value of the
280
Arctic anthropogenic Pb (1.16; Sturges et al. 1993). The error bars are smaller than the dots (see text for
281
details).
282 283
Concerning the isotopes, there was a shift in 206Pb/207Pb in core A from 1.09 at the bottom
284
to about 1.16 in the topmost centimeters (Fig. 3). In core HB-6, the pattern was opposite, with the 285
bottom-to-top ratio shifting from 1.22 to 1.17. The isotopic values of the two cores converged at 286
the top. We also investigated the variations in 204Pb, 206Pb and 208Pb as it had been suggested that 287
normalizing 206Pb and 208Pb to 204Pb generally allows to distinguish between three mixed end-288
members (Ellam 2010). In the scatter diagram of 208/204Pb vs 206/204Pb (Fig. 4; values in the 289
supplemental material), the ratios from the two cores are very far apart for the oldest samples and 290
progressively converge toward similar values for the most recent samples. 291
292
293
Fig. 4. Plot of the isotopic ratios 208/204Pb on 206/204Pb, along with national aerosol averaged values for two
294
different potential source regions (grey boxes), i.e. Canada and the USA in the 1980’s (Sturges and Barrie
295
1987; Graney et al. 1995; Poirier 2006). Each sample is labelled with its depth (in cm) in its core to
296
highlight the temporal convergence of the isotope ratios from the two cores toward the same values.
297 298
4. Discussion
299
4.1. Historical variations in the sources of Pb
300
The Hudson Bay is characterized by intense sediment resuspension due to postglacial 301
isostatic rebound (Hare et al. 2008; Kuzyk et al. 2009), which can dilute anthropogenic inputs in 302
surface sediments (Hare et al. 2010). This could partly mask the sedimentary record of 303
anthropogenic Pb, and thus prevent the use of our sediment records to investigate the vertical 304
export of Pb during the last centuries. However, our cores clearly recorded Pb of anthropogenic 305
origin, as shown by the convergent trend toward the anthropogenic value of 1.16 (Sturges and 306
Barrie 1987) in Figure 3, and are thus suitable for investigating the vertical export dynamics of 307
anthropogenic Pb as shown by the 210Pb chronology, which was corroborated by a secondary 308
stratigraphic marker (137Cs). 309
Because Al in sediments traces the terrestrial inputs, the correlation between Pb and Al 310
provides information on the importance of lithogenic inputs in the accumulation of Pb (Brumsack 311
2006). The strong positive correlations of Pb and Al in the two cores (Section 3.2) indicate that 312
the historical Pb accumulation was strongly controlled by terrestrial inputs. In addition, the 313
vertical export of terrestrial or atmospheric Pb from surface waters to the sediment would have 314
different effects on Pb concentration normalized to Al, i.e. terrestrial Pb would be deposited 315
together with terrestrial Al, hence constant Pb normalized to Al, whereas atmospheric Pb would 316
not be deposited together with terrestrial Al, hence higher Pb normalized to Al (Daskalakis and 317
O’Connor 1995; Heimbürger et al. 2012; Heimbürger et al. 2014). Moreover, enrichment factors 318
of mercury relative to aluminium have been similarly used to identify the source of mercury 319
(atmosphere against underlying soils) by St. Pierre et al. (2015). At our two stations, there were 320
no strong variations in the enrichment ratio of Pb normalized to Al along the cores, indicating 321
that the sedimentary accumulation of airborne Pb remained constant during the last 200 years in 322
the two cores. 323
Irrespective of the isotope considered, the two cores were characterized by a trend 324
(i.e. older to recent) that converged toward a value half way between typical historical Canadian 325
and USA lead emissions (Figs. 3 and 4). The oldest samples in the two cores were characterized 326
by opposite 206Pb/207Pb, 206Pb/204Pb and 208Pb/204Pb isotopic signatures (Figs. 3 and 4), meaning 327
that early-industrial Pb inputs (i.e. between 1800 and 1900) originated from different sources in 328
the western and eastern parts of Hudson Bay. The temporal trends of 206Pb/204Pb and 208Pb/204Pb 329
in core HB-6 are similar to those observed in two Hudson Bay lakes (Outridge et al. 2002), 330
suggesting similar industrial sources of lead on the western side of the Bay. The early-331
industrial 206Pb/207Pb isotopic signature was different in cores A and HB-6 (1.10 and 1.22, 332
respectively), on the eastern and western sides of the Bay, respectively. This probably reflected 333
the spatial heterogeneity that exists in the different potential sources of Pb (with different isotopic 334
signatures) in the Canadian shield, which surrounds most of Hudson Bay (GEOROC 2003). The 335
isotopic ratio values toward which the two cores converged were the same as in surrounding 336
lakes on the two sides of Hudson Bay (Fig. 3 in this study, and Figs. 6 and 7 in Outridge et al. 337
2002). Irrespective of the early-industrial sources, the fact that the isotopic composition in the 338
two cores started with different values and converged toward a single value indicates that both 339
cores recorded the imprint of medium to long-range anthropogenic Pb deposition during the last 340
century. 341
4.2. Effect of primary productivity on the sedimentary Pb record
343
Local anthropogenic inputs of metals are low in the Hudson Bay area because of its 344
remote location and the scarcity of industries. Hence, medium to long-range atmospheric 345
transport was presumably the main source of anthropogenic contaminants. A small increase from 346
25 to 30 mg kg-1 in Pb concentration was observed in sediment core A around 6 and 7 cm (Fig. 2). 347
However, because a similar increase was also observed in Al, Pb normalized to Al was mostly 348
constant, which suggested that Pb was of terrestrial origin. This is consistent with the slight 349
reduction in 206Pb/207Pb near 6 and 7 cm in core A indicating a transient return to more terrestrial 350
(background) values. This transient increase in terrestrial input could be related to increased 351
precipitation due to the climatic variability of Hudson Bay (Guiot 1987). In core HB-6, the record
352
showed no sign of increase in either Pb concentration or Pb/Al, suggesting relatively constant Pb 353
input (terrestrial and atmospheric) during the last two centuries in this part of the bay. The ~20% 354
increase in Pb concentration in core A is much smaller than the three- to five-fold increase in Pb 355
concentration in the recent sediments (last century) of two lakes in the Hudson Bay (Outridge et 356
al. 2002). The observed increase in Pb in lake sediments was attributed by Outridge et al. (2002) 357
to medium to long-range atmospheric inputs of anthropogenic Pb originating from Eurasia and 358
North America. Because waters of the lakes and Hudson Bay should have been both exposed to 359
similar inputs of atmospheric materials, the difference in Pb accumulation between the two 360
environments indicates that the transfer mechanisms of Pb to the sediment where different in the 361
two environments, assuming no diagenetic or post-sampling effect on Pb concentrations. The 362
206Pb/207Pb isotopic values (Fig. 3) show, for the cores on the two sides of the Hudson Bay, an
363
apparent progressive overprint of anthropogenic lead (from bottom to top of cores) during the 364
1900’s, whose isotopic ratio reflects a mixed Canada-USA aerosol origin (206Pb/207Pb = 1.16-365
1.17; Sturges and Barrie 1987). In other words, despite a globally increased atmospheric import 366
of anthropogenic lead (Nriagu 1996), the amount of Pb deposited in Hudson Bay’s sediment did 367
not change dramatically during the last century, but the sources of emission changed as shown by 368
changes in the isotope ratios. This indicates that sedimentary accumulation of anthropogenic Pb 369
was limited in Hudson Bay by a factor that acted differently in the bay than in surrounding lakes. 370
Assuming a typical sinking velocity of 20 to 200 m d-1 for Pb when packaged within 371
biogenic aggregates (Alldredge and Gotschalk 1988; Armstrong et al. 2009; McDonnell and 372
Buesseler 2010), i.e. when sedimentation is driven by biological productivity, surface Pb would 373
reach 250 m (i.e. the maximum depth of Hudson Bay) within less than 15 days (the depths of 374
coring sites HB-6 and A were 120 and 130 m, respectively). Hence even if the estimates of the 375
residence time of Hudson surface waters vary over a wide range in the literature (i.e. from one 376
month to 6 years, Section 2.1), Pb packaged within biogenic aggregates should sediment within 377
the Bay. As a result, the only ways by which Pb would have not reached the sediment should 378
have been either a lack of aggregation due to very low biological productivity, and/or a very low 379
sinking velocity of the Pb-containing aggregates, i.e. <<20 m d-1. These two conditions would 380
have led Pb to be flushed out of the bay. 381
Our results and previously published data show that the sedimentary accumulation of Pb 382
in the last century was not the same in the records of low-productivity Hudson Bay as in the high-383
productivity nearby lakes, whereas the recent isotopic composition was the same in sediments 384
from both Hudson Bay and the surrounding lakes (Outridge et al. 2002). Hence, we cannot reject 385
our initial hypothesis that primary productivity was the main forcing factor determining the 386
sedimentation of airborne matter. This hypothesis is consistent with the suggestion from previous 387
studies that sedimentary sequences in Hudson Bay did not always record directly the atmospheric 388
deposition of allochthonous matter, but could be affected by low primary productivity. For 389
example and similarly to our Pb observations, it was recently suggested that the sedimentation of 390
polychlorinated biphenyl (PCBs) was exceptionally low in Hudson Bay, because the very low 391
productivity in the Bay and the resulting weak downward flux of organic matter inhibited the 392
transfer of PCBs from surface to depth and, therefore, their sedimentation (Kuzyk et al. 2010a). 393
Such a relationship between primary productivity and the downward flux of aggregates may be a 394
typical feature of many environments in the world ocean (Passow 2004; Heimbürger et al. 2014). 395
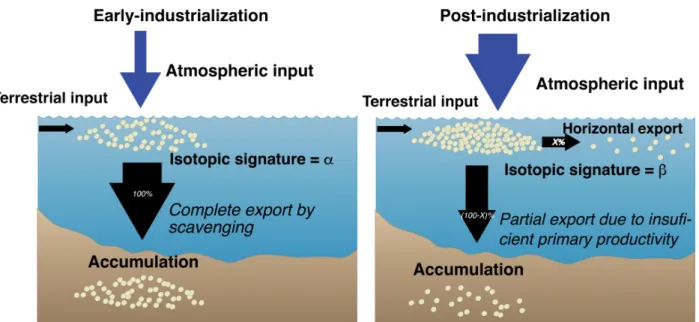
The conceptual model in Fig. 5 summarizes the above ideas, illustrating the early-396
industrial and post-industrial situations in Hudson Bay. In the early-industrial model, atmospheric 397
inputs of Pb were low, and this Pb was characterized by the local isotopic signature a. Most Pb, 398
perhaps all, was exported downwards and accumulated in the sediment after being scavenged by 399
organic particles, thus transferring the isotopic signature of Pb from surface waters to the 400
sediment. The post-industrialization model is characterized by a higher rate of Pb input from the 401
atmosphere to the surface water due to the enhanced medium to long-range transport of 402
anthropogenic Pb (Outridge et al. 2002). This Pb is characterized by the different isotopic 403
signature b, which reflects its mixed local and anthropogenic origins. The similar concentration 404
of Pb accumulated in the sediment is explained by a limitation of its export by the low primary 405
productivity of Hudson Bay, which restricts the availability of organic particles to scavenge Pb 406
and export it to the sediment. As a consequence, despite a likely increase in atmospheric 407
deposition of Pb with increased industrialization, its accumulation was similar after and before 408
industrialization, but its isotopic signature was different in the two periods. 409
410
411
Fig. 5. Schematic representation of our hypothesis on the atmospheric and water-column fluxes of
412
contaminants before and after industrialization in Hudson Bay. The illustrated mechanisms explain both
413
the absence of difference in Pb sedimentary accumulation, and the change in the isotopic signatures of
414
sediments from the early-industrial to the post-industrial period.
415 416
Enhanced atmospheric inputs of contaminants in the last century were not significantly 417
recorded in Hudson Bay sediments, presumably because of the exceptionally low productivity of 418
the Bay (Kuzyk et al. 2009), which prevented the efficient transfer of chemical elements from the 419
water column to the sediment. However, the signature of the Pb isotopes suggests a shift from 420
local input to medium to long-range anthropogenic inputs during the 20th century, which thus 421
recorded the signature of the last century. This is consistent with our hypothesis that low primary 422
productivity was the main forcing factor that determined the sedimentation of atmospherically-423
deposited matter in Hudson Bay during the last century. This observation is globally significant 424
as Hudson Bay is extremely sensitive to warming, with an increase of 0.47°C per decade over the 425
last 50 years (Mulder et al. 2016). Warming will lead to increased river discharge, which could 426
enhance primary productivity in the Hudson Bay because river discharge promotes the upwelling 427
of deep waters (Kuzyk et al. 2010a; Kuzyk et al. 2010b). If Arctic regions are currently warming 428
up, one may expect increasing fluxes of nutrients to Hudson Bay, in the northern part of Canada. 429
It may therefore also be expected that the magnitude of primary productivity in Hudson Bay will 430
increase as well, which would lead to an increase in export fluxes of atmospherically-deposited 431
contaminants, once packaged with particulate biogenic matter. 432
433
4.3. Possible effect of transparent exopolymer particles (TEP)
434
It was mentioned above that one of the possible explanations to our observations was that 435
the Pb-containing aggregates sank at very low velocity. This could have occurred if the 436
aggregates formed in Hudson Bay had been neutrally buoyant, and had thus remained in surface 437
waters long enough to be flushed out of the Bay. While there are multiple factors that can 438
influence the particle settling velocity (Maggi 2013), the accumulation of positively buoyant 439
transparent exopolymer particles (TEP) in oligotrophic surface waters is hypothesized to 440
contribute to slowing down the downward export flux (Azetsu-Scott and Passow 2004, Mari et al. 441
2017). 442
The increase of TEP volume concentration in surface waters is a significant feature in 443
some oligotrophic waters, e.g. the Mediterranean Sea (Mari et al. 2001; Bar-Zeev et al. 2011), the 444
Pacific Ocean (Wurl et al. 2011; Kodama et al. 2014), and Hudson Bay (Michel et al. 2006). The 445
limited TEP dataset for Hudson Bay is characterized by a sub-surface maximum around 50 m 446
where it co-occurs with the chlorophyll a maximum, suggesting a link between the two (Michel 447
et al. 2006). Nutrient limitation increases the production of TEP by phytoplankton and lowers 448
their bacterial degradation, and the two processes contribute to TEP accumulation in surface 449
waters (Mari et al. 2001, 2017).Owing to their high stickiness, TEP are often seen as a catalyst of 450
aggregation, and thus a key component for the formation of fast-sinking aggregates (Passow et al. 451
2001), but (Mari et al. 2017) proposed that a system with high volume concentration of low-452
density TEP and low concentration of dense particles in surface waters should be characterized 453
by low downward POC export (Mari et al. 2017). The latter conditions are those observed during 454
periods of severe oligotrophy in Hudson Bay, where the accumulation of TEP in surface waters 455
could have enhanced the residence time of TEP-associated elements (e.g. Pb) and particles 456
(e.g. mineral dust) in surface, thus favoring their horizontal export out of the bay instead of 457 downward export. 458 459 Acknowledgements 460
All data used in this paper are available in the online supplement. Funding was provided by the 461
Fonds Québécois de la Recherche sur la Nature et les Technologies through an international 462
doctoral internship grant awarded to BT. We thank M. Starr, and the monitoring program for 463
Canadian interior seas (MERICA) funded by the Canadian Department of Fisheries and Oceans, 464
Natural Resources Canada, and the Canadian Coast Guard for providing the cores and the ship 465
time. We are grateful to R. Losno (Institut de physique du globe de Paris) for his assistance with 466
trace metal analyses. We are thankful to the two anonymous reviewers for their constructive input. 467
References
469
ACIA (2004) Impacts of a Warming Arctic: Arctic Climate Impact Assessment. ACIA Overv. Rep. 140.
470
Alldredge AL, Gotschalk C (1988) In situ settling behavior of marine snow. Limnol Oceanogr 33:339–35. doi:
471
10.4319/lo.1988.33.3.0339
472
Alldredge AL, Silver MW (1988) Characteristics, dynamics and significance of marine snow. Prog Oceanogr 20:41–
473
82. doi: 10.1016/0079-6611(88)90053-5
474
Armstrong RA, Lee C, Hedges JI, et al (2002) A new, mechanistic model for organic carbon fluxes in the ocean
475
based on the quantitative association of POC with ballast minerals. 49:219–236. doi:
10.1016/S0967-476
0645(01)00101-1
477
Armstrong RA, Peterson ML, Lee C, Wakeham SG (2009) Settling velocity spectra and the ballast ratio hypothesis.
478
Deep Res Part II Top Stud Oceanogr 56:1470–1478. doi: 10.1016/j.dsr2.2008.11.032
479
Azetsu-Scott K, Passow U (2004) Ascending marine particles: Significance of transparent exopolymer particles
480
(TEP) in the upper ocean. Limnol Oceanogr 49:741–748. doi: 10.4319/lo.2004.49.3.0741
481
Bar-Zeev E, Berman T, Rahav E, et al (2011) Transparent exopolymer particle (TEP) dynamics in the eastern
482
Mediterranean Sea. Mar Ecol Prog Ser 431:107–118. doi: 10.3354/meps09110
483
Barrie LA, Gregor D, Hargrave B, et al (1992) Arctic contaminants: sources, occurrence and pathways. Sci Total
484
Environ 122:1–74. doi: 10.1016/0048-9697(92)90245-N
485
Barrie LA, Hoff RM, Daggupaty SM (1981) The influence of mid-latitudinal pollution sources on haze in the
486
Canadian arctic. Atmos Environ 15:1407–1419. doi: 10.1016/0004-6981(81)90347-4
487
Belshaw N, Freedman P, O’Nions R, et al (1998) A new variable dispersion double-focusing plasma mass
488
spectrometer with performance illustrated for Pb isotopes. Int J Mass Spectrom 181:51–58. doi:
489
10.1016/S1387-3806(98)14150-7
490
Boyce DG, Lewis MR, Worm B (2010) Global phytoplankton decline over the past century. Nature 466:591–596.
491
doi: 10.1038/nature09268
492
Brumsack HJ (2006) The trace metal content of recent organic carbon-rich sediments: Implications for Cretaceous
493
black shale formation. Palaeogeogr Palaeoclimatol Palaeoecol 232:344–361. doi:
494
10.1016/j.palaeo.2005.05.011
495
Buat-Ménard P, Davies J, Remoudaki E, et al (1989) Non-steady-state biological removal of atmospheric particles
496
from Mediterranean surface waters. Nature 340:131–134. doi: 10.1038/340131a0
497
Burd AB, Jackson GA (2009) Particle aggregation. Ann Rev Mar Sci 1:65–90. doi:
498
10.1146/annurev.marine.010908.163904
499
Daskalakis KD, O’Connor TP (1995) Normalization and elemental sediment contamination in the coastal United
500
States. Environ Sci Technol 29:470–477. doi: 10.1021/es00002a024
501
De Angelis M, Gaudichet A (1991) Saharan dust deposition over Mont Blanc (French Alps) during the last 30 years.
502
Tellus 43B:61–75. doi: 10.1034/j.1600-0889.1991.00005.x
503
Deuser WG, Brewer PG, Jickells TD, Commeau RF (1983) Biological control of the removal of abiogenic particles
504
from the surface ocean. Science (80- ) 219:388–391. doi: 10.1126/science.219.4583.388
505
Ellam RM (2010) The graphical presentation of lead isotope data for environmental source apportionment. Sci Total
506
Environ 408:3490–3492. doi: 10.1016/j.scitotenv.2010.03.037
507
Flynn WW (1968) The determination of low levels of polonium-210 in environmental materials. Anal Chim Acta
508
43:221–227. doi: 10.1016/S0003-2670(00)89210-7
509
Fowler SW, Buat-Ménard P, Yokoyama Y, et al (1987) Rapid removal of Chernobyl fallout from Mediterranean
510
surface waters by biological activity. Nature 329:56–58. doi: 10.1038/329056a0
511
Francois R, Honjo S, Krishfield R, Manganini S (2002) Factors controlling the flux of organic carbon to the
512
bathypelagic zone of the ocean. Global Biogeochem Cycles 16:1087. doi: 10.1029/2001gb001722
513
Gačić M, Civitarese G, Miserocchi S, et al (2002) The open-ocean convection in the Southern Adriatic: A controlling
514
mechanism of the spring phytoplankton bloom. Cont Shelf Res 22:1897–1908. doi:
10.1016/S0278-515
4343(02)00050-X
516
GEOROC (2003) Geochemistry of Rocks of the Oceans and Continents. In: MPI für Chemie/Max-Planck Inst. für
517
Chemie, Mainz, Ger.
518
Graney JR, Halliday AN, Keeler GJ, et al (1995) Isotopic record of lead pollution in lake sediments from the
519
northeastern United States. Geochim Cosmochim Acta 59:1715–1728. doi: 10.1016/0016-7037(95)00077-D
520
Granskog MA, Macdonald RW, Kuzyk ZZA, et al (2009) Coastal conduit in southwestern Hudson Bay (Canada) in
521
summer: Rapid transit of freshwater and significant loss of colored dissolved organic matter. J Geophys Res
522
Ocean 114:C08012. doi: 10.1029/2009JC005270.
Guiot J (1987) Reconstruction of seasonal temperatures in Central Canada since A.D. 1700 and detection of the 18.6-
524
and 22-year signals. Clim Change 10:249–268. doi: 10.1007/BF00143905
525
Hare AA, Stern GA, Kuzyk ZZA, et al (2010) Natural and anthropogenic mercury distribution in marine sediments
526
from Hudson Bay, Canada. Environ Sci Technol 44:5805–5811. doi: 10.1021/es100724y
527
Hare A, Stern GA, Macdonald RW, et al (2008) Contemporary and preindustrial mass budgets of mercury in the
528
Hudson Bay Marine System: The role of sediment recycling. Sci Total Environ 406:190–204. doi:
529
10.1016/j.scitotenv.2008.07.033
530
Heimbürger L-E, Cossa D, Thibodeau B, et al (2012) Natural and anthropogenic trace metals in sediments of the
531
Ligurian Sea (Northwestern Mediterranean). Chem Geol 291:141–151. doi: 10.1016/j.chemgeo.2011.10.011
532
Heimbürger LE, Lavigne H, Migon C, et al (2013) Temporal variability of vertical export flux at the DYFAMED
533
time-series station (Northwestern Mediterranean Sea). Prog Oceanogr 119:59–67. doi:
534
10.1016/j.pocean.2013.08.005
535
Heimbürger LE, Migon C, Losno R, et al (2014) Vertical export flux of metals in the Mediterranean Sea. Deep Res
536
Part I Oceanogr Res Pap 87:14–23. doi: 10.1016/j.dsr.2014.02.001
537
Jackson GA, Burd AB (1998) Aggregation in the marine environment. Environ Sci Technol 32:2805–2814. doi:
538
10.1021/es980251w
539
Jones EP, Anderson LG (1994) Northern Hudson Bay and Foxe Basin: Water masses, circulation and productivity.
540
Atmosphere-Ocean 32:361–374. doi: 10.1080/07055900.1994.9649502
541
Kodama T, Kurogi H, Okazaki M, et al (2014) Vertical distribution of transparent exopolymer particle (TEP)
542
concentration in the oligotrophic western tropical North Pacific. Mar Ecol Prog Ser 513:29–37. doi:
543
10.3354/meps10954
544
Kuzyk ZZA, Macdonald RW, Johannessen SC, et al (2009) Towards a sediment and organic carbon budget for
545
Hudson Bay. Mar Geol 264:190–208. doi: 10.1016/j.margeo.2009.05.006
546
Kuzyk ZZA, MacDonald RW, Johannessen SC, Stern GA (2010a) Biogeochemical controls on PCB deposition in
547
Hudson Bay. Environ Sci Technol 44:3280–3285. doi: 10.1021/es903832t
548
Kuzyk ZZA, Macdonald RW, Tremblay JÉ, Stern GA (2010b) Elemental and stable isotopic constraints on river
549
influence and patterns of nitrogen cycling and biological productivity in Hudson Bay. Cont Shelf Res 30:163–
550
176. doi: 10.1016/j.csr.2009.10.014
551
Lampitt RS, Salter I, de Cuevas BA, et al (2010) Long-term variability of downward particle flux in the deep
552
northeast Atlantic: Causes and trends. Deep Res Part II Top Stud Oceanogr 57:1346–1361. doi:
553
10.1016/j.dsr2.2010.01.011
554
Macdonald RW, Harner T, Fyfe J (2005) Recent climate change in the Arctic and its impact on contaminant
555
pathways and interpretation of temporal trend data. Sci. Total Environ. 342:5–86.
556
Maggi F (2013) The settling velocity of mineral, biomineral, and biological particles and aggregates in water. J
557
Geophys Res Ocean 118:2118–2132. doi: 10.1002/jgrc.20086
558
Manhes G, Minster JF, Allègre CJ (1978) Comparative uranium-thorium-lead and rubidium-strontium study of the
559
Saint Sèverin amphoterite: consequences for early solar system chronology. Earth Planet Sci Lett 39:14–24.
560
doi: 10.1016/0012-821X(78)90137-1
561
Mari X, Beauvais S, Lemée R, Pedrotti ML (2001) Non-Redfield C:N ratio of transparent exopolymeric particles in
562
the northwestern Mediterranean Sea. Limnol Oceanogr 46:1831–1836. doi: 10.4319/lo.2001.46.7.1831
563
Mari X, Passow U, Migon C, et al (2017) Transparent exopolymer particles: Effects on carbon cycling in the ocean.
564
Prog Oceanogr 151:13–37. doi: http://dx.doi.org/10.1016/j.pocean.2016.11.002
565
McDonnell AMP, Buesseler KO (2010) Variability in the average sinking velocity of marine particles. Limnol
566
Oceanogr 55:2085–2096. doi: 10.4319/lo.2010.55.5.2085
567
Michel C, Hamilton J, Hansen E, et al (2015) Arctic Ocean outflow shelves in the changing Arctic: A review and
568
perspectives. Prog Oceanogr 139:66–88. doi: 10.1016/j.pocean.2015.08.007
569
Michel C, Lapoussiere A, LeBlanc B, Starr M (2006) Transparent expopolymeric substances (TEP) in Hudson Bay
570
during fall: significance and potential roles. http://www.arcticnet.ulaval.ca/pdf/posters_2006/michel_eT_al.pdf.
571
Accessed 22 Aug 2016
572
Migon C, Sandroni V, Marty JC, et al (2002) Transfer of atmospheric matter through the euphotic layer in the
573
northwestern Mediterranean: Seasonal pattern and driving forces. Deep Res Part II Top Stud Oceanogr
574
49:2125–2141. doi: 10.1016/S0967-0645(02)00031-0
575
Miller GH, Lehman SJ, Refsnider KA, et al (2013) Unprecedented recent summer warmth in Arctic Canada.
576
Geophys Res Lett 40:5745–5751. doi: 10.1002/2013GL057188
577
Mulder CPH, Iles DT, Rockwell RF (2016) Increased variance in temperature and lag effects alter phenological
578
responses to rapid warming in a subarctic plant community. Glob. Chang. Biol.
Not C, Hillaire-Marcel C, Ghaleb B, et al (2008) 210 Pb– 226 Ra– 230 Th systematics in very low sedimentation rate
580
sediments from the Mendeleev Ridge (Arctic Ocean). Can J Earth Sci 45:1207–1219. doi: 10.1139/E08-047
581
Nriagu JO (1996) A History of Global Metal Pollution. Science (80- ) 272:223–0. doi: 10.1126/science.272.5259.223
582
Outridge P., Hermanson M., Lockhart W. (2002) Regional variations in atmospheric deposition and sources of
583
anthropogenic lead in lake sediments across the Canadian Arctic. Geochim Cosmochim Acta 66:3521–3531.
584
doi: 10.1016/S0016-7037(02)00955-9
585
Outridge PM, Rausch N, Percival JB, et al (2011) Comparison of mercury and zinc profiles in peat and lake sediment
586
archives with historical changes in emissions from the Flin Flon metal smelter, Manitoba, Canada. Sci Total
587
Environ 409:548–563. doi: 10.1016/j.scitotenv.2010.10.041
588
Outridge PM, Sanei LH, Stern G a, et al (2007) Evidence for control of mercury accumulation rates in Canadian
589
High Arctic lake sediments by variations of aquatic primary productivity. Environ Sci Technol 41:5259–65.
590
Passow U (2004) Switching perspectives: Do mineral fluxes determine particulate organic carbon fluxes or vice
591
versa? Geochemistry Geophys Geosystems 5:1–5. doi: 10.1029/2003GC000670
592
Passow U, Carlson CA (2012) The biological pump in a high CO2 world. Mar Ecol Prog Ser 470:249–271. doi:
593
10.3354/meps09985
594
Passow U, Shipe RF, Murray A, et al (2001) The origin of transparent exopolymer particles (TEP) and their role in
595
the sedimentation of particulate matter. Cont Shelf Res 21:327–346. doi: 10.1016/S0278-4343(00)00101-1
596
Poirier A (2006) Re-Os and Pb isotope systematics in reduced fjord sediments from Saanich Inlet (Western Canada).
597
Earth Planet Sci Lett 249:119–131. doi: 10.1016/j.epsl.2006.06.048
598
Prinsenberg SJ (1984) Freshwater contents and heat budgets of James Bay and Hudson Bay. Cont Shelf Res 3:191–
599
200. doi: 10.1016/0278-4343(84)90007-4
600
Prinsenberg SJ (1986) Chapter 10 The Circulation Pattern and Current Structure of Hudson Bay. In: Martini I (ed)
601
Canadian Inland seas: Elsevier Oceanography Series. Elsevier B.V., Amsterdam, The Netherlands, pp 187–204
602
Rahn KA, Borys RD, Shaw GE (1977) The Asian source of Arctic haze bands. Nature 268:713–715. doi:
603
10.1038/268713a0
604
Sanchez-Cabeza JA, Ruiz-Fernández AC (2012) 210Pb sediment radiochronology: An integrated formulation and
605
classification of dating models. Geochim Cosmochim Acta 82:183–200. doi: 10.1016/j.gca.2010.12.024
606
Saucier FJ, Dionne J (1998) A 3-D coupled ice-ocean model applied to Hudson Bay, Canada: The seasonal cycle and
607
time-dependent climate response to atmospheric forcing and runoff. J Geophys Res Ocean 103:27689–27705.
608
doi: 10.1029/98JC02066
609
St. Pierre KA, St. Louis VL, Kirk JL, et al (2015) Importance of Open Marine Waters to the Enrichment of Total
610
Mercury and Monomethylmercury in Lichens in the Canadian High Arctic. Environ Sci Technol 49:5930–
611
5938. doi: 10.1021/acs.est.5b00347
612
Sturges WT, Barrie LA (1989) Stable lead isotope ratios in arctic aerosols: evidence for the origin of arctic air
613
pollution. Atmos Environ 23:2513–2519. doi: 10.1016/0004-6981(89)90263-1
614
Sturges WT, Barrie LA (1987) Lead 206/207 isotope ratios in the atmosphere of North America as tracers of US and
615
Canadian emissions. Nature 329:144–146.
616
Sturges WT, Hopper JF, Barrie LA, Schnell RC (1993) Arctic air, snow and ice chemistryStable lead isotope ratios
617
in Alaskan arctic aerosols. Atmos Environ Part A Gen Top 27:2865–2871. doi:
http://dx.doi.org/10.1016/0960-618
1686(93)90317-R
619
Turner JT (2002) Zooplankton fecal pellets, marine snow and sinking phytoplankton blooms. Aquat Microb Ecol
620
27:57–102. doi: 10.3354/ame027057
621
Turner JT (2015) Zooplankton fecal pellets, marine snow, phytodetritus and the ocean’s biological pump. Prog
622
Oceanogr 130:205–248. doi: 10.1016/j.pocean.2014.08.005
623
Wurl O, Miller L, Vagle S (2011) Production and fate of transparent exopolymer particles in the ocean. J Geophys
624
Res Ocean 116:C00H13. doi: 10.1029/2011JC007342
625
Yool A, Popova EE, Coward AC, et al (2013) Climate change and ocean acidification impacts on lower trophic
626
levels and the export of organic carbon to the deep ocean. Biogeosciences 10:5831–5854. doi:
10.5194/bg-10-627
5831-2013
628 629