HAL Id: hal-00303269
https://hal.archives-ouvertes.fr/hal-00303269
Submitted on 29 Jan 2008HAL is a multi-disciplinary open access
archive for the deposit and dissemination of sci-entific research documents, whether they are pub-lished or not. The documents may come from teaching and research institutions in France or abroad, or from public or private research centers.
L’archive ouverte pluridisciplinaire HAL, est destinée au dépôt et à la diffusion de documents scientifiques de niveau recherche, publiés ou non, émanant des établissements d’enseignement et de recherche français ou étrangers, des laboratoires publics ou privés.
Quality assurance of the Brewer UV measurements in
Finland
K. Lakkala, A. Arola, A. Heikkilä, J. Kaurola, T. Koskela, E. Kyrö, A.
Lindfors, O. Meinander, A. Tanskanen, J. Gröbner, et al.
To cite this version:
K. Lakkala, A. Arola, A. Heikkilä, J. Kaurola, T. Koskela, et al.. Quality assurance of the Brewer UV measurements in Finland. Atmospheric Chemistry and Physics Discussions, European Geosciences Union, 2008, 8 (1), pp.1415-1455. �hal-00303269�
ACPD
8, 1415–1455, 2008 QA of the Brewer UV measurements in Finland K. Lakkala et al. Title Page Abstract Introduction Conclusions References Tables Figures ◭ ◮ ◭ ◮ Back CloseFull Screen / Esc
Printer-friendly Version
Interactive Discussion Atmos. Chem. Phys. Discuss., 8, 1415–1455, 2008
www.atmos-chem-phys-discuss.net/8/1415/2008/ © Author(s) 2008. This work is distributed under the Creative Commons Attribution 3.0 License.
Atmospheric Chemistry and Physics Discussions
Quality assurance of the Brewer UV
measurements in Finland
K. Lakkala1, A. Arola2, A. Heikkil ¨a2, J. Kaurola2, T. Koskela2, E. Kyr ¨o1, A. Lindfors2, O. Meinander2, A. Tanskanen2, J. Gr ¨obner3, and G. H ¨ulsen3
1
Finnish Meteorological Institute, Arctic Research Centre, Sodanlyl ¨a, Finland
2
Finnish Meteorological Institute, Helsinki, Finland
3
Physikalisches Meteorologisches Observatorium Davos, World Radiation Center, Davos Dorf, Switzerland
Received: 14 December 2007 – Accepted: 14 December 2007 – Published: 29 January 2008 Correspondence to: K. Lakkala ([email protected])
ACPD
8, 1415–1455, 2008 QA of the Brewer UV measurements in Finland K. Lakkala et al. Title Page Abstract Introduction Conclusions References Tables Figures ◭ ◮ ◭ ◮ Back CloseFull Screen / Esc
Printer-friendly Version
Interactive Discussion
Abstract
The quality assurance of the two Brewer spectrophotometers of the Finnish Meteoro-logical Institute is discussed in this paper. The complete data processing chain from raw signal to high quality spectra is presented. The quality assurance includes daily maintenance, laboratory characterizations, calculation of long term spectral
respon-5
sivity, data processing and quality assessment. The cosine correction of the mea-surements is based on a new method, and included in the data processing software. The results showed that the actual cosine correction factor of the Finnish Brewers can vary between 1.08–1.13 and 1.08–1.12, respectively, depending on the sky radiance distribution and wavelength. The temperature characterization showed a linear
temper-10
ature dependence between the internal temperature and the photon counts per cycle, and a temperature correction was used for correcting the measurements. The long term spectral responsivity was calculated using time series of several lamps using two slightly different methods. The long term spectral responsivity was scaled to the irradi-ance scale of the Helsinki University of Technology (HUT) for the whole measurement
15
time periods 1990–2006 and 1995–2006 for Sodankyl ¨a and Jokioinen, respectively. Both Brewers have participated in many international spectroradiometer comparisons, and have shown good stability. The differences between the Brewers and the portable reference spectroradiometer QASUME have been within 5% during 2002–2007.
1 Introduction
20
Many spectral UV measurement programs started in the end of the 1980s, after recog-nizing that the stratospheric ozone content was declining not only over Antarctica but also over the Arctic and at mid-latitudes (Booth et al.,1992;WMO,1990). Decrease in total ozone is observed as wavelength dependent increase in UV radiation. Therefore spectral measurements are needed to assess the influence of the ozone depletion on
25
wave-ACPD
8, 1415–1455, 2008 QA of the Brewer UV measurements in Finland K. Lakkala et al. Title Page Abstract Introduction Conclusions References Tables Figures ◭ ◮ ◭ ◮ Back CloseFull Screen / Esc
Printer-friendly Version
Interactive Discussion lengths (Young et al.,1993). Measuring the complete UV spectrum offers many
possi-bilities for different kind of research, compared with measuring the UV radiation using a broadband instrument. The challenge is to maintain the sensitivity of the instrument at all wavelengths, as the dynamical range of the UV is huge. Well characterized and maintained spectroradiometers are needed to detect possible, even small, changes in
5
these high precision demanding wavelengths (Seckmeyer et al.,2002).
The Brewer spectrophotometer MK II of the Finnish Meteorological Institute (FMI) in Sodankyl ¨a, 67◦N Finland, was installed in 1988, to monitor total column ozone in this site influenced by the Arctic ozone depletion (Kyr ¨o et al.,1992;Von der Gathen
et al., 1995). Since 1990 it has also monitored spectral UV radiation, and the UV
10
time series of Sodankyl ¨a is one of the longest in Europe. The time series has been homogenized and is continuous since then. A second Brewer spectrophotometer, was installed in the observatory of Jokioinen, 61◦N Finland, in 1995. The Brewer is a MK III -type spectrophotometer, which fulfills the WMO level S-2 requirements (Seckmeyer
et al.,2002) for detection of trends in UV irradiance. Both spectral UV time series have
15
been used in many studies and that way served the scientific community to study the UV features since more than 15 years (Gardiner and Kirsch, 1997;Bais et al.,2001;
De Backer et al.,2001;Meinander et al.,2003;Arola et al.,2003b;Lakkala et al.,2003;
Lindfors et al.,2003;Glandorf et al.,2005;Gr ¨obner et al.,2005;Huttunen et al.,2005;
Kazantzidis et al.,2006;Meinander et al.,2006;Lindfors et al.,2007;Tanskanen et al.,
20
2007).
In this paper, we present the complete data processing of the FMI’s Brewer spec-trophotometers from raw signal to quality controlled UV spectra. This includes a new way of processing the spectral responsivity time series and correcting for temperature dependence and cosine error. The terminology “quality control” and “quality
assur-25
ance” is based onWebb et al. (2003). Sections 2, 3, 4 and 5 are part of the quality control, describing the standard operating procedures, laboratory characterizations, long term spectral responsivity and the data processing. The quality assurance itself is discussed in section 5, using the inductive method described byWebb et al.(2003).
ACPD
8, 1415–1455, 2008 QA of the Brewer UV measurements in Finland K. Lakkala et al. Title Page Abstract Introduction Conclusions References Tables Figures ◭ ◮ ◭ ◮ Back CloseFull Screen / Esc
Printer-friendly Version
Interactive Discussion There, the quality of the measurements is evaluated using comparisons with other
independent spectral measurements as well as comparisons with reconstructed UV values. The flagging of the European data base (EUVDB) is also used as independent quality statement.
Bernhard and Seckmeyer(1999) have reviewed the various sources of uncertainty
5
in spectral measurements, andWebb et al.(1998) have described calibration and qual-ity control procedures. Papers about the qualqual-ity assurance procedure of broad band or multichannel instruments (Blumthaler,2004;Bernhard et al., 2005; Lakkala et al.,
2005;Josefsson,2006) have been published, but only the National Science Foundation (NSF) has published the complete data processing of their spectral UV measurements
10
(Booth et al.,2001;Bernhard et al.,2004). Their instrument is a SUV-type spectrora-diometer, so that quality assurance of Brewer spectrophotometers is discussed here for the first time.
2 Standard operating procedures
We start by presenting the standard operating procedures of the two Brewer
spec-15
trophotometers of the Finnish Meteorological Institute (FMI), including routine stability check and daily quality control. The characteristics of the two Brewers are presented in Table1.
2.1 Lamp measurements
The spectral stability of the Brewers is monitored by 50 W and 1000 W lamp
measure-20
ments. The 50 W lamps are measured every second week outdoors and every second week in the dark room laboratory. The 1000 W lamps are measured in the laboratory in average every month, since 1997 and 1998 at Jokioinen and Sodankyl ¨a, respectively. The 1000 W lamp dark room measurements are performed following a standard pro-cedure in order to achieve most accurate measurements. Both the temperature of the
ACPD
8, 1415–1455, 2008 QA of the Brewer UV measurements in Finland K. Lakkala et al. Title Page Abstract Introduction Conclusions References Tables Figures ◭ ◮ ◭ ◮ Back CloseFull Screen / Esc
Printer-friendly Version
Interactive Discussion dark room and the current of the lamp are controlled. The intensity of the calibration
lamp is also recorded by both a UV-B and a UV-A sensor; the current and voltage of the lamp are recorded as well. All reflecting surfaces are covered with black cloths, and baffles are used in order to minimize diffuse light.
Several lamps are measured each time so that lamps are burned different amount
5
of time, as recommended in Webb et al. (1998). Thus some lamps are used more frequently, as others are burned only a few times per year. This enable distinguishing drifts related to the ageing of an individual lamp.
2.2 Maintenance
The daily operation routine consist of a series of measurements, which depend on the
10
solar zenith angle. The measurement series is mostly started at constant air masses, where two types of measurements are performed: global UV radiation measurements and total ozone measurements using direct sky or zenith sky measurements. Between the measurements, some routine checks are automatically performed. E.g. standard lamp measurements allow to follow the daily stability of the instrument, and mercury
15
lamp measurements are made regularly to ensure the right wavelength alignment at 296.7 nm. At both stations the spectrum is recorded typically every half an hour in steps of 0.5 nm. The total scanning time is around 4 and 8 min for Sodankyl ¨a and Jokioinen, respectively. At the end of the day, the raw data is automatically transfered to a data base, and daily measurement events are listed.
20
The maintenance, including regular check of levelling and cleaning is performed by the operators of the sounding station. Each operator has been trained to ensure the operation of the instrument and the control software. The Brewer stands on a tripod, and the levelling is checked at least every time the instrument is placed back after e.g. a darkroom calibration.
25
The Arctic conditions bring special challenges to the instruments. As the frost is a problem during the winter, air is blowed on the diffuser in order to keep it as dry as possible and free from frost. The dome is also cleaned after rain and snow, whenever
ACPD
8, 1415–1455, 2008 QA of the Brewer UV measurements in Finland K. Lakkala et al. Title Page Abstract Introduction Conclusions References Tables Figures ◭ ◮ ◭ ◮ Back CloseFull Screen / Esc
Printer-friendly Version
Interactive Discussion an operator is at work. In order to keep the Brewer dry inside, Nitrogen is circulated
through it. At both sites, the outside temperature can be −30◦C during winter time, and in Sodankyl ¨a almost every winter the temperature reaches −40◦C. In order to keep the temperature above zero degrees, both Brewers have heating elements inside the instrument.
5
2.3 Ancillary measurements
As Sodankyl ¨a and Jokioinen are both synoptical weather stations, many different type of ancillary measurements are available. From the point of view of the UV radiation measurements, the most important ones are sky condition regarding clouds and pre-cipitation. The snow depth is recorded, and has been related to surface albedo (Arola
10
et al., 2003a). Continuous radiation measurements are maintained routinely, e.g., global, direct, diffuse and reflected global radiation measurements are available. Total ozone column measurements are available, besides the Brewer measurements, from SAOZ measurements. Ozone soundings are performed once a week at Sodankyl ¨a. Both stations have been equipped with PFR type aerosol optical depth measurements
15
since 2004. Many other air quality and atmospheric composition measurements are as well available at both stations.
In addition to these standard radiation measurements, Brewer scan synchronized broadband UV and global pyranometer measurements started in 2001 and 2000 at Sodankyl ¨a and Jokioinen, respectively. A Sl501A radiometer, measuring erythemally
20
weighted UV radiation, and a CM11 pyranometer, measuring global radiation have been set up by the side of the Brewers. The measurements are synchronized so that a reading is recorded each time a wavelength is measured with the Brewer. Broadband measurement can be used to identify the stability of the sky conditions during a Brewer scan.
ACPD
8, 1415–1455, 2008 QA of the Brewer UV measurements in Finland K. Lakkala et al. Title Page Abstract Introduction Conclusions References Tables Figures ◭ ◮ ◭ ◮ Back CloseFull Screen / Esc
Printer-friendly Version
Interactive Discussion
3 Characterizations
In order to make reliable measurements and to process the data correctly, laboratory characterizations of the instrument are needed. In the following subsections we present the characterizations which have been made for the Brewers of FMI.
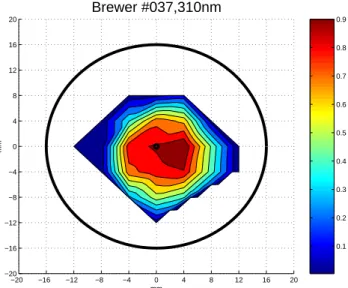
3.1 Angular response
5
The signal of a spectroradiometer should be proportional to the cosine of the angle
θ between the direction of the incident radiation and the normal of the radiometer’s
diffuser. The deviation from this ideal response is called the cosine error. In order to be able to correct the data, the angular response of the instrument has to be characterized. The incident angle of radiation should be measured with respect to the most
sen-10
sitive part of the diffusor. For the Brewers of FMI, the diffusers were characterized following W. Josefsson (personal communication). The quartz dome of the diffusor was removed, in order to quantify only the properties of the diffusor. A black paper screen with a 4 mm hole was moved on a grid of 4 mm while measuring a calibration lamp. The results of the Brewer #037 at 310 nm is presented in Fig.1, where it is seen
15
that the most sensitive parts are situated, as expected, more or less around the centre of the diffusor. The result of the Brewer #107 was similar, except that the most sensitive part was even more centered.
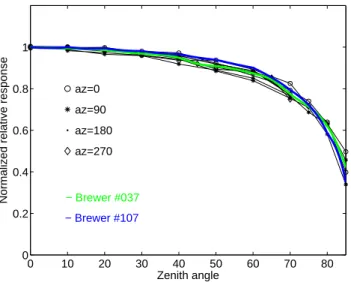
The angular response measurements were performed in the dark room at con-stant temperature. A 1000 W DXW, a vertical beam lamp, was seated in a holder,
20
which could be moved to different angles. Four azimuth angles (north=0◦, east=90◦, south=180◦, west=270◦) were measured for zenith angles from 0◦ up to 85◦ and back to 0◦, in steps of 5◦ or 10◦. The angular responses obtained, normalized to the ideal cosine response, are shown in Fig.2for the four azimuth angles for the Brewer #037. The results of the Brewer #107 were comparable to the results of the Brewer #037, with
25
slightly less steep curves. The cosine error of the direct beam exceeded 10% at SZA higher than 50◦. The results of both Brewers showed no dependency to the azimuth
ACPD
8, 1415–1455, 2008 QA of the Brewer UV measurements in Finland K. Lakkala et al. Title Page Abstract Introduction Conclusions References Tables Figures ◭ ◮ ◭ ◮ Back CloseFull Screen / Esc
Printer-friendly Version
Interactive Discussion angles, and the final angular response was calculated by taking the average of the
az-imuths. The final normalized and interpolated angular responses of both Brewers are also shown in Fig.2.
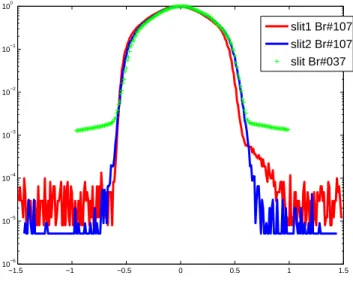
3.2 Slit function and wavelength calibration
The entrance and exit apertures of a monochromator have finite widths. As a
conse-5
quence, not only photons with the desired wavelengthλ0pass through the monochro-mator, but also those with wavelengths within a certain interval aroundλ0. When the monochromator is set to a fixed wavelengthλ0, its transmittance, as a function of wave-length, is called the slit functionf (λ). The width of the slit function is often quantified by
the full width of the function at half of its maximum (FWHM).
10
The slit functions for the spectrophotometer at Sodankyl ¨a and Jokioinen have been characterized for the first time during the intercomparison at Iza ˜na in 1996 (Kyr ¨o,
1997). They were determined using the HeCd-laser line at 325.029 nm as a source of monochromatic light. The slit function of the Brewer #107 have been measured in addition twice in 1997 and once in 2002. The Fig.3shows the measured slit functions
15
of both Brewers. For the Brewer #107, the slit function “slit1” was used before the day 114 in 1997, and the “slit2” was used from that day onwards. The FWHM for the Brewer #037 and #107 are 0.56 and 0.59, respectively.
The wavelength calibration is made as a part of the annual maintenance. In case of Brewer #107 the year-to-year need to change the calibration has always been
equiva-20
lent to a very small, i.e. from zero to 0.1 nm, adjustment in the wavelength scale. During the last five years there has been no need for any change for the Brewer #107, which indicates a good wavelength stability.
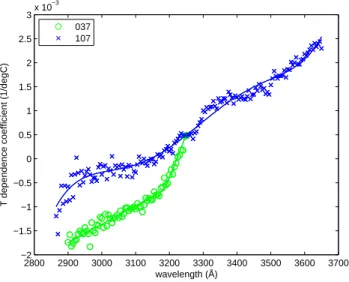
3.3 Temperature dependence
Brewer spectrophotometers are provided with a heating element maintaining the
in-25
ACPD
8, 1415–1455, 2008 QA of the Brewer UV measurements in Finland K. Lakkala et al. Title Page Abstract Introduction Conclusions References Tables Figures ◭ ◮ ◭ ◮ Back CloseFull Screen / Esc
Printer-friendly Version
Interactive Discussion is not temperature stabilized. According to, e.g., Cappellani and Kochler (1999) and
Weatherhead et al.(2001) the Brewer measurements have temperature dependency, which may be attributable to temperature dependences in the photomultiplier tube it-self and in the filters in front of the photomultiplier.Ylianttila and Schreder(2005) have discussed the temperature sensitivity of teflon diffusers.
5
In 1998, in order to determine the temperature dependence of the Brewers #037 and #107, the routine lamp irradiance measurements were analyzed with respect to the temperature. The study indicated temperature dependences that could not be overlooked. The dependences were subsequently characterized for both instruments by on-site laboratory measurements of 1000 W working standard lamps from Optronics
10
Inc.
The procedure for the characterization measurements was as follows: The Brewers were heated and cooled by using an air blow system built for the purpose. Each scan was taken after the internal temperature of the Brewer had stabilized to a suitable level. The range of the internal temperatures covered values from 15.3 to 47.6◦C and 14.8
15
to 45.2◦C for #107 and #037, respectively. The temperature of the dark room was stabilized to 23◦C.
The results suggested linear dependency between the internal temperature and the photon counts per cycle, which can be used for correcting the data. A linear model relating the irradiance and the temperature was formulated as follows:
20
I(λ) = I0(λ) ∗ (1 + c(λ) ∗ dT ) (1)
Here,d T =T −T 0 is the temperature difference between the Brewer’s internal
tempera-tureT and the reference temperature T 0=23◦C;I0=I(T 0) is the reference irradiance (in counts/cycle);I is the measured irradiance (in counts/cycle); and c(λ) is the
tempera-ture dependence factor (in units 1/◦C). The temperature dependence factors obtained
25
by linear regression for each wavelength are shown in Fig. 4. Also shown are the fits (polynomial for #107 and two-piece linear for #037) that are performed in order to smooth the ripple in the curves.
ACPD
8, 1415–1455, 2008 QA of the Brewer UV measurements in Finland K. Lakkala et al. Title Page Abstract Introduction Conclusions References Tables Figures ◭ ◮ ◭ ◮ Back CloseFull Screen / Esc
Printer-friendly Version
Interactive Discussion
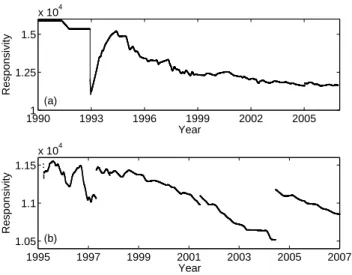
4 Long term spectral responsivity
The long term spectral responsivity of both Brewers have been calculated for the whole period of measurements. The objective is to obtain instrument spectral responsivity time series based on one specific irradiance scale for the whole measurement period. A set of lamp measurements during the period are used. The lamp measurements
5
are made on the roof and in the dark room laboratory of both sites, and the data is corrected to the reference temperature. In Sodankyl ¨a and Jokioinen, before the years 1998 and 1997, respectively, only 50 W lamp measurements made on the roof were available. Thereafter mainly laboratory measurements of 1000 W lamps have been used. The process involves the use of several lamps throughout the whole period and
10
the way individual lamps are used is slightly different for the two Brewers, and both methods are presented here.
Firstly, the lamp measurements are quality checked manually. Secondly, the chosen irradiance scale is transferred from the primary standard to the working standard and working lamps. Thereafter, the possible drifts of the lamps are detected by comparing
15
time series of all lamp measurements against each other. If a drift is detected, the measurements of that lamp are either excluded or, if possible, re-calibrated with the help of other lamps. The irradiance scale used in this analysis is provided by the Helsinki University of Technology (HUT). The primary standards of both Brewers are calibrated in average once a year at the HUT, which is an accredited national Standard
20
Laboratory (K ¨ubarsepp et al.,2000).
Once the set of trusted lamp measurements has been compiled, the calculation of the instrument spectral responsivity is possible for each measurement time of individ-ual lamp and for each wavelength. In case of Brewer #107, a linear time interpolation is thereafter performed to each lamp separately to give continuous spectral responsivity
25
time series based on that lamp. Thereafter all the these spectral responsivity time se-ries are averaged, and finally a running average is calculated using a ±15 day window, which smooths out small scale time variations from the final product. However, in the
ACPD
8, 1415–1455, 2008 QA of the Brewer UV measurements in Finland K. Lakkala et al. Title Page Abstract Introduction Conclusions References Tables Figures ◭ ◮ ◭ ◮ Back CloseFull Screen / Esc
Printer-friendly Version
Interactive Discussion case of the Brewer #037 all available lamp measurements during a given day are firstly
averaged, and thereafter time interpolated and smoothed. The choice between the order in time interpolating and averaging individual lamps is subjective, and depends on the number of trusted lamps, on the frequency of laboratory calibrations, and on the desired level of small scale features in the final spectral responsivity time series.
5
The Fig. 5 shows the 305 nm responsivity time series for the Brewers #037 and #107. The sudden severe drop in the responsivity in 1993 for the Brewer #037 is due to accidental burning of a heating element inside the instrument box. The instrument has slightly recovered from that accident and the average ageing is seen as a down-ward drift of a couple of percent per year. Approximately same drift is observed for
10
the Brewer #107. The points of discontinuity in the responsivity time series denote in-stants of instrument maintenance and repair when the instrument characteristics have changed.
During our work, we have compared spectral responsivities produced only using 50 W working lamps and only using 1000 W lamps. This was important, as in the
be-15
ginning of the time series we had only 50 W lamp measurements, and the question was, how well we can trust to these measurements. Nowadays, each time the Brewer measures 1000 W lamps in the dark room laboratory, also 50 W lamps are measured. Also between laboratory measurements, 50 W lamps are measured on the roof. We can therefore produce two different spectral responsivity time series; one processed
20
with only the 1000 W lamps and one with only the 50 W lamps. In both time series, the irradiance scale has been transfered from the primary standard 1000 W lamp, and the spectral responsivity has been corrected to the reference temperature. These two spectral responsivity time series follow each other within the measurement uncertain-ties, and give us the confidence that the whole time series is homogenized, even if in
25
ACPD
8, 1415–1455, 2008 QA of the Brewer UV measurements in Finland K. Lakkala et al. Title Page Abstract Introduction Conclusions References Tables Figures ◭ ◮ ◭ ◮ Back CloseFull Screen / Esc
Printer-friendly Version
Interactive Discussion
5 Data processing
In the previous section, we have described the laboratory characterizations performed for our spectrophotometers. In this section the known errors will be corrected using these laboratory characterizations, or using a theoretical approach or a combination of these two.
5
The raw data is processed into irradiances using a perl language program called spede.pl. It is based on the Qbasic program, which was released by the manufacturer of the Brewer spectrophotometers (SCI-TEC). Some own corrections, e.g. the cosine correction, spike correction and the temperature correction have been implemented by the FMI. During the processing of the data, some check values, e.g. impossible high
10
UV index, are calculated on fly, in order to warn for suspicious measurements. 5.1 Noise spikes
The first step for raw data is to remove noise spikes. By spikes we refer to an anoma-lous number of counts recorded at one wavelength channel causing a peak upwards or downwards that does not originate from the true radiation signal (Meinander et al.,
15
2003). The origin for spikes is not fully understood, but the spectrum can be corrected. The data processing of the Brewer data includes a spike correction algorithm based on
Meinander et al.(2003), where a statistical method is used to identify the noise spikes in the Brewer UV spectra. In order to work out both for small and big count values of the raw data, the method is based on differences of relative changes in the spectra.
20
For the correction, two main part have to be done beforehand. First a clear sky reference spectrum is needed. For Sodankyl ¨a and Jokioinen, two years of cloud free data were used for calculating an average clear sky spectrum. Secondly, a statistical standard deviation file was computed, based on a large data set, where two years of data were used.
25
Next, the spectral ratios of raw counts (C) divided by the reference (R) are computed.
ACPD
8, 1415–1455, 2008 QA of the Brewer UV measurements in Finland K. Lakkala et al. Title Page Abstract Introduction Conclusions References Tables Figures ◭ ◮ ◭ ◮ Back CloseFull Screen / Esc
Printer-friendly Version
Interactive Discussion channelsλ and λ−i, where i denotes the Brewer spectrum step, are calculated. These
differences are named as Dratios, as given by
Dratio(λ) = C(λ) R(λ)−
C(λ − i)
R(λ − i). (2)
Dratios are then compared against the chosen confidence level.
It means that a peak is detected if the signal at the first channel goes up and the next
5
channel down, or vice versa. Other kinds of peaky features are expected to be due to changes in the cloud conditions. In addition, only relatively big spikes are considered, i.e. the ratio of counts divided by the corrected counts exceeds 1.5 or is less than 0.5.
The new corrected value for the removed peak is calculated as the average of the ratios of the neighbor channels multiplied with the reference spectrum value at that
10 channel, as given by C(λ) corrected = 0.5 ∗ (C(λ − i) R(λ − i)+ C(λ + i) R(λ + i)) ∗ R(λ). (3)
This way the shape and the fine structure of the spectral features are preserved. 5.2 Dark current, dead time and stray light
Dark current is the response exhibited by the photomultiplier during periods when it is
15
not actively being exposed to light. Dark current is recorded before each scan. Raw count values for further data processing are gained by subtracting the measured dark current from the measured counts in a function including the number of cycles and the integration time.
The dead time is the time after each light exposure, during which the photomultiplier
20
is not able to record another exposure if it happen. The dead time of the Brewer is regularly recorded and daily values are saved in a dead time history file. The typical dead time values are 30–40 ns for both Brewers. Dead time correction to the raw counts
ACPD
8, 1415–1455, 2008 QA of the Brewer UV measurements in Finland K. Lakkala et al. Title Page Abstract Introduction Conclusions References Tables Figures ◭ ◮ ◭ ◮ Back CloseFull Screen / Esc
Printer-friendly Version
Interactive Discussion is performed using iteration of an exponential function including number of counts and
dead time values.
Stray light consists of radiation at wavelengths outside the wavelength range of the slit function that is detected inside the range expected. This is a special problem in-herent in single monochromator spectroradiometers. The Brewer #107 is a double
5
monochromator and the amount of stray light passing to the detector is minimal. The average of counts at wavelengths smaller than 292 nm is calculated. This average value is subtracted from the count values at each wavelength of the spectrum. Since the Brewer # 037 is a single monochromator, the stray light disturbs measurements up to around 305 nm (Bais et al.,1996). For the Brewer #037, signal at wavelengths lower
10
than 293 nm are considered as stray light, and subtracted from longer wavelengths. 5.3 Temperature
The temperature dependencies of the Brewers are corrected using the temperature dependence coefficients derived from the characterization measurements described in Sect. 3.3. Each scan is normalized to the reference temperature by computing I0(λ) 15
on the basis of Eq. (1). The procedure yields a time series of irradiance scans (in units counts/cycle) normalized to the same reference (laboratory) temperature in which the response of the instrument has been derived.
5.4 Cosine error
Several papers have been written about methods for the cosine correction of
radiome-20
ters (Landelius and Josefsson,2000;Bais et al.,1998;Feister et al.,1997;Seckmeyer
and Bernhard,1993). They differ mostly by the way of handling the radiation distribution of the sky. The method of FMI is shortly described here.
IfF denotes the actual and F′the measured irradiance, we can define the correction factor for the angular response of a spectroradiometer (fglob) for a particular global
ACPD
8, 1415–1455, 2008 QA of the Brewer UV measurements in Finland K. Lakkala et al. Title Page Abstract Introduction Conclusions References Tables Figures ◭ ◮ ◭ ◮ Back CloseFull Screen / Esc
Printer-friendly Version Interactive Discussion irradiance measurement as fglob= Fglob F′ glob = Fdiff+ Fdir F′ diff+ Fdir′ , (4)
where the subscripts glob, diff, and dir correspond to global irradiance and its diffuse and direct components, respectively.
Equation (4) can be rewritten as
5
fglob=
(Fdir/Fdiff+ 1) (F′
dir/Fdir∗ Fdir/Fdiff+ Fdiff′ /Fdiff)
. (5)
Equation (5) suggests that in order to obtain the cosine correction factor, three components are needed:
1)F′
dir/Fdir, the ratio between measured and actual direct irradiance, i.e. direct cosine error,
10
2) F′
diff/Fdiff, the ratio between measured and actual diffuse irradiance, i.e. diffuse cosine error,
and 3)Fdir/Fdiff, the ratio between actual direct and diffuse irradiance.
The ratio between the measured and actual direct irradiance can be expressed as
15
the ratio of the angular response of the diffuser (C(θ, λ)) and the cosine of the solar zenith angle (θ), F′ dir Fdir = C(θ, λ) cos(θ). (6)
The ratio between the measured and actual direct diffuse radiation is
F′ diff Fdiff = R L(θ, φ, λ) ∗ C(θ, λ) dΩ R L(θ, φ, λ) ∗ cos(θ) dΩ, (7) 20
ACPD
8, 1415–1455, 2008 QA of the Brewer UV measurements in Finland K. Lakkala et al. Title Page Abstract Introduction Conclusions References Tables Figures ◭ ◮ ◭ ◮ Back CloseFull Screen / Esc
Printer-friendly Version
Interactive Discussion where the spectral radiance L(θ) is integrated over the upper hemisphere, θ is the
zenith angle andφ the azimuth angle. In general, the exact sky radiance distribution
(L(θ, φ, λ)) is not known. By assuming isotropic diffuse radiation, however, Eq. (7) can be simplified to F′ diff Fdiff = R C(θ, λ)d Ω π . (8) 5
In our method, the ratio between the actual direct and diffuse irradiance, Fdir/Fdiff, is obtained using a radiative transfer model. The LibRadtran package and UVspec dis-ort version (http://www.libradtran.org) (Mayer and Kylling,2005) was used the follow-ing way: Assumfollow-ing the UV irradiance can be expressed as a function of wavelength, solar zenith angle, cloud optical depth, ozone absorption, aerosols and albedo, a
six-10
dimensional lookup table can be constructed. Using the lookup table and knowing the irradiance at each wavelength from the measured Brewer spectrum, the cloud optical depth, τcloud(λ), can be found as a function of wavelength. Further details of this ap-proach to estimate the cloud optical depth can be found inArola et al.(2003b). Once
τcloud(λ) is found, the radiative transfer model is used to derive the direct-to-diffuse ratio
15
as a function of wavelength.
Once Fdir/Fdiff is obtained and the angular response of the diffuser, C(sza, λ) is known, Eq. (5) can be used to estimate the cosine correction factor for each wave-length. Inserting the angular response of the Brewer at Sodankyl ¨a and Jokioinen in Eq. (8), and assuming the diffuse radiation isotropic, the ratio between measured and
20
actual diffuse irradiance is 0.90 and 0.91, respectively. This means that, when there is no direct light coming into the instrument’s diffuser, the error in the measurements due to the non-ideal angular response can be as much as 10% and 9% for Sodankyl ¨a and Jokioinen, respectively. This value is modified in the presence of direct irradiance, and its change depends on the ratio between the actual direct and diffuse radiation.
25
The actual cosine correction factor of the Brewer at Sodankyl ¨a and Jokioinen can vary between 1.08–1.13 and 1.08–1.12, respectively, depending on the wavelength.
ACPD
8, 1415–1455, 2008 QA of the Brewer UV measurements in Finland K. Lakkala et al. Title Page Abstract Introduction Conclusions References Tables Figures ◭ ◮ ◭ ◮ Back CloseFull Screen / Esc
Printer-friendly Version
Interactive Discussion 5.5 Wavelength alignment
Because of the strong decrease with wavelength of the solar spectrum in the UV-B range, even small errors in the wavelength alignment of a spectroradiometer lead to significant errors in measured spectral irradiance. The Brewer spectrophotometers are typically assumed to have minor problems with wavelength alignment. Therefore the
5
need of performing wavelength shift correction is not seen critical. This is the case for most of the Brewers, as well as for the Brewer #107. In those case, the wavelength error is randomly spread around the average wavelength error.
In the case of the Brewer #037,Arola et al.(2003b) found out that a stepwise change in the wavelength alignment has occurred between 1993 and 1994. The typical value
10
for the wavelength shift before 1994 was −0.06 nm, and 0.01 nm thereafter. In case that the wavelength error would have not been corrected, an error of several percentage could have been introduced in long term change analysis of UV spectra.
The current data processing includes the wavelength shift correction using the SHICRIVM wavelength shift correction package described in Slaper et al. (1995).
15
E.g. spectra transfered to the EUVDB database have been corrected for the possible wavelength shift.
6 Quality assessment
Following Webb et al. (2003) the quality assessment of an instrument can be done by comparing the instrument to other independent instruments measuring the same
20
quantities. In this section, we review the results of intercomparison campaigns and comparison with the portable reference spectroradiometer QASUME (Quality Assur-ance of Spectral Ultraviolet Measurements in Europe) (Bais et al., 2003). For qual-ity assurance purposes the measurements are also compared with reconstructed UV dose rates. The flagging reports of the spectra transfered to the European UV Data
25
ACPD
8, 1415–1455, 2008 QA of the Brewer UV measurements in Finland K. Lakkala et al. Title Page Abstract Introduction Conclusions References Tables Figures ◭ ◮ ◭ ◮ Back CloseFull Screen / Esc
Printer-friendly Version
Interactive Discussion 6.1 Intercomparison campaigns
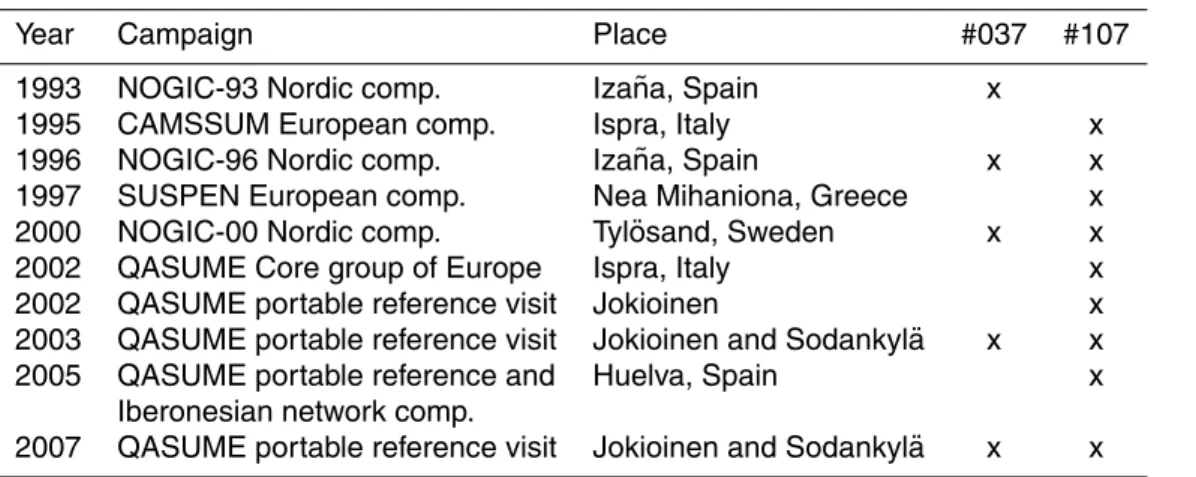
Both Brewer spectrophotometers of FMI have participated to several international UV spectroradiometer comparisons (Koskela,1994;Kjeldstad et al., 1997;Gardiner and
Kirsch,1997;Bais et al.,2001;Meinander et al.,2003;Thorseth et al.,2002). Table2
shows in detail the year of the campaign, the location and which Brewer has
partici-5
pated. The Brewer #037 mainly participated to the Nordic comparisons and has been the host for two portable reference spectroradiometer QASUME visits, whereas the Brewer #107 has travelled successfully around Europe. This instrument took part in the comparison of Ispra in 2002, where six spectroradiometers perfoming consistently in previous intercomparisons, were invited. Besides the intercomparison campaigns
10
with several instruments, smaller intercomparison campaigns have been organized. A regular comparison is done during the yearly visit of the reference Brewer #017 of the International Ozone Services (IOS). During these visits, both UV and ozone measure-ments are compared and the instrumeasure-ments are checked and maintained, if necessary. National comparisons have also been performed during many of these visits.
15
When interpreting the results of the intercomparison campaigns, we need to keep in mind that especially results of the earliest campaigns represent the situation during that time, and that the data can nowadays be reanalyzed using different method and knowledge. In those first intercomparisons, almost no instrument had correction for the cosine error. Also, the intercomparisons were concentrated on clear sky weather.
20
Every campaign has been a good step to improve the measurements. Regarding the Brewers of FMI, the NOGIC-00 campaign was the first, where the data processing procedures presented in this paper was in use. In that campaign, the cosine correction and temperature correction procedures where used for the first time. An example of one day measurements (06:00 UTC–20:00 UTC) compared to the reference spectra is
25
shown in Fig.6. The plots are ratios between the daily sums of irradiances measured with the Brewers and the calculated reference daily sums. The measurements were processed using the SHICrivm QA/QC software package (Slaper et al., 1995), and
ACPD
8, 1415–1455, 2008 QA of the Brewer UV measurements in Finland K. Lakkala et al. Title Page Abstract Introduction Conclusions References Tables Figures ◭ ◮ ◭ ◮ Back CloseFull Screen / Esc
Printer-friendly Version
Interactive Discussion the reference spectra were calculated followingSlaper and Koskela(1997). From the
Figure, it can be seen that compared to the reference spectra, the Brewer #037 was within ±5% at wavelengths longer than 305 nm and the Brewer #107 was within ±5% at most of the wavelengths. Individual spikes can be due to changing cloud conditions at a single moment. The observed downward drift observed at wavelengths longer
5
than 317 nm for the Brewer #037 was due to problems with the irradiance scale of one calibration lamp. The lamp was recalibrated after the campaign.
From previous intercomparisons, the most important results is that the ratio to the reference was stable during the comparison days. E.g. in the NOGIC-96 intercompari-son, for both instruments the standard deviation of the ratio of the measured dose rate
10
to that of the reference was 1–2%. The other important result is, that all measurements starting from the beginning of the time series are appropriate after applying all known corrections to the data.
6.2 QASUME reference
The portable reference spectroradiometer QASUME from
Physikalisch-15
Meteorologisches Observatorium Davos, World radiation Center (PMOD/WRC) is a Bentham spectroradiometer, whose irradiance scale is traceable to the primary standard of the Physikalisch-Technische Bundesanstalt (PTB), Germany, through transfer standard lamps (Gr ¨obner and Sperfeld, 2005). It can be seen as “European standard spectroradiometer”, and the irradiance scale is assumed to be stable during
20
the years. As spectroradiometers are challenging instruments for travelling, this gives a good possibility to check the performance of a site spectroradiometer without travelling.
The portable reference spectroradiometer QASUME has visited Jokioinen and So-dankyl ¨a in 2003 and 2007. In addition to this, the instrument visited Jokioinen during
25
the first experimental year in 2002. Also, the Brewer #107 of Jokioinen was part of the core group, and participated to the starting comparison of the QASUME project in 2002, in Ispra, Italy (Gr ¨obner et al.,2005). The protocol of each site visit included
ACPD
8, 1415–1455, 2008 QA of the Brewer UV measurements in Finland K. Lakkala et al. Title Page Abstract Introduction Conclusions References Tables Figures ◭ ◮ ◭ ◮ Back CloseFull Screen / Esc
Printer-friendly Version
Interactive Discussion measurements of the spectral solar irradiance, which were performed every half an
hour from the morning to the evening. Synchronized solar spectra were obtained in the range of site spectroradiometer, every 0.5 nm, with a wavelength increment every 3 s. The solar spectra were converted to a common wavelength scale and to a nominal resolution of 1 nm using the SHICRivm software package. A detailed description of the
5
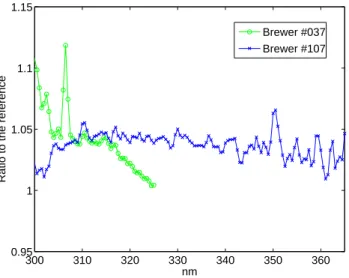
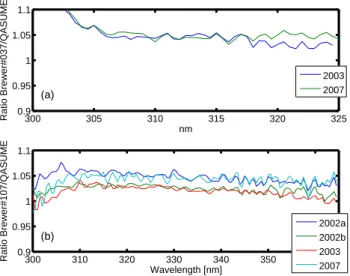
measurement procedure is published inGr ¨obner et al.(2005).
The summary of the results is shown in Fig. 7 for both the Brewers. The mean ratio to the QASUME reference for SZA smaller than 75◦ are shown for all comparison years. For the Brewer #037, the results of both comparisons, in 2003 and 2007, are near each others. A difference of around 5% can be seen in wavelengths longer than
10
305 nm. At shorter wavelengths, the typical single monochromator stray light problem disturbs the readings, and those wavelengths need to be rejected.The small downward shift at longer wavelengths in 2003 may be due to problems with one single calibration lamp.
For the Brewer #107, a difference of around 4–5% was observed in 2002 and 2007,
15
at Ispra and Jokioinen, respectively. In Jokioinen in 2002 and 2003 the mean difference was around 2%. These results show very good agreement within the measurement uncertainties of spectral measurements and good stability of the instrument. As the irradiance scale of the Brewers of FMI is traceable to the HUT, and that of QASUME to PTB, some differences in the scale can be possible (Gr ¨obner et al.,2002). The stable
20
difference between the instruments over all wavelengths also support the theory of dif-ferences in irradiance scale. In 2007, at Jokioinen, via laboratory lamp measurements the difference of irradiance scale was found to be 3%. Which makes only 2% of the differences to be inexplicable, which can be considered as very good results in the challenging work of measuring UV wavelengths.
25
6.3 Comparison with reconstructed UV
For quality assurance purposes the processed UV spectra are derived to UV erythe-mally weighted UV dose rates and compared with reconstructed UV dose rates. The
ACPD
8, 1415–1455, 2008 QA of the Brewer UV measurements in Finland K. Lakkala et al. Title Page Abstract Introduction Conclusions References Tables Figures ◭ ◮ ◭ ◮ Back CloseFull Screen / Esc
Printer-friendly Version
Interactive Discussion reconstruction of the UV dose rates is based on the method described inLindfors et al.
(2007). The method uses the pyranometer measurements in order to quantify the in-fluence of clouds. A radiative transfer model is used to reproduce the UV dose rates using an appropriate cloud modification factor.
For the quality assurance purposes figures, including the reconstructed erythemally
5
weighted UV dose rates, measured UV dose rates, modeled clear sky UV dose rates, and figures including modelled clear sky global radiation and measured global radi-ation with a CM-11 -type pyranometer are plotted. Figure8 shows an example of a suspicious measurement day, the 29 April 2001 in Sodankyl ¨a. Also one minute dose rates measured with a nearby Sl501A radiometer are plotted. Both the modelled values
10
and the SL501a data behavior differ from that of the Brewer measurement at around 10:00 UTC. The Brewer seems to have measured too low values.
One need to be careful, when interpreting figures like Fig.8. As the modeled data is presented as one hour average, the data represent the average situation of this hour. Whereas the Brewer data represents the sky conditions of some minutes, which means
15
that obvious differences from the model are possible, e.g. big changes in cloudiness can be observed in the time scale of minutes, which leads to high variations in the UV radiation. The feature like observed in the Fig. 8 could be due to sudden rain shower, heavy clouds, malfunction of the instrument, local shadow on the diffuser by e.g. a walking person, cleaning of the dome or some other unknown reasons. Ancillary
20
measurements are often needed in order to find out if the feature is real or not. In this specific case, the sl501A erythemal UV dose rates confirm the doubt that something is wrong with the Brewer measurement. The most probable reason was shadowing people around the instrument during maintenance event.
6.4 European UV database
25
Jokioinen and Sodankyl ¨a spectral UV data are regularly submitted to the Euro-pean Database of UV radiation (EUVDB) (http://uv.fmi.fi/uvdb/index.html). At the EUVDB all incoming spectra undergo an automatical quality flagging process by
ACPD
8, 1415–1455, 2008 QA of the Brewer UV measurements in Finland K. Lakkala et al. Title Page Abstract Introduction Conclusions References Tables Figures ◭ ◮ ◭ ◮ Back CloseFull Screen / Esc
Printer-friendly Version
Interactive Discussion the SHICrivm package developed by the RIVM, Netherlands (Slaper et al., 1995)
(http://www.rivm.nl/shicrivm) and CheckUVSpec package by the NILU, Norway (http:
//zardoz.nilu.no/∼olaeng/CheckUVSpec/CheckUVSpec.html). The SHICrivm tool as-signs each spectrum quantitative quality indicators for wavelength scale errors, spikes and shape problems, lowest wavelength with accurate measurement, and atmospheric
5
transmission. The CheckUVSpec tool assigs spectra with atmospheric signature flag which is related to the prevailing atmospheric conditions. It should be noted that while some of the quality flags, e.g. wavelength scale errors, can be determined with high accuracy problems with irradiance scale errors can only be detected if the error is very large.
10
Table3 shows the summary of selected EUDVB quality flags related to errors and problems that can be determined with accuracy. The majority of the flags of both in-struments are in GREEN category, with some YELLOW flags in the spike and shape category, which is expected because changing cloudiness causes spectral shape dis-tortions. E.g. in Sodankyl ¨a 98% of the spectra are flagged as green for the wavelength
15
shifts, 99% for the start irradiance, i.e. instrument sensitivity and 95% for the spike detection and shape problems. For Jokioinen the values are 99%, 99% and 90%, re-spectively. In general, the number of RED, GREY and BLACK flags is very small and in this respect the data can be considered of high quality. Further details about flagging can be found here:
20
http://uv.fmi.fi/uvdb/html/flag information.html
http://www.muk.uni-hannover.de/∼seckmeyer/EDUCE
7 Conclusions
Since early 90’s spectral UV radiation is measured with Brewer spectrophotometers #037 and #107 at two sites in Finland. From the very beginning special attention has
25
been paid to the quality of these measurements, and a comprehensive quality assur-ance scheme has been developed. A lot of work has also been done for
character-ACPD
8, 1415–1455, 2008 QA of the Brewer UV measurements in Finland K. Lakkala et al. Title Page Abstract Introduction Conclusions References Tables Figures ◭ ◮ ◭ ◮ Back CloseFull Screen / Esc
Printer-friendly Version
Interactive Discussion ization of the instruments, which has resulted in better monitoring of the instrument
stability and improved postcorrection methods. This paper presents the quality assur-ance work and data processing scheme for spectral UV measurements of FMI. The future objective is to make a quantitative uncertainty analysis of these measurements. At FMI, a lot of effort has been put on the quality assurance of the spectral UV
5
measurements, starting from careful training of the operators. The standard operating procedures include daily routine check of the operation of the instrument, and regular lamp measurements in order to monitor the stability of the instruments. Since late 90’s both FMI’s measurement sites have a well equipped dark room laboratory that enables absolute calibration in a temperature controlled environment with a 1000 W lamp. The
10
lamp measurements are carried out varying the lamp set. This allows use of lamps with different burn history and better identification of the lamp drifts.
The lamp measurements have been used to determine the whole spectral respon-sivity time series of the spectral UV measurements starting from 1990 and 1995 for Sodankyl ¨a and Jokioinen, respectively. The construction of the spectral responsivity
15
time series is based on transfer of the HUT irradiance scale to the whole time period, also including the first measurement years when only 50 W lamp measurements were available. The procedure normalizes the lamp measurements to the reference tem-perature as well as the whole time series. This is essential, because otherwise the temperature dependent outdoor lamp calibrations would cause a seasonal calibration
20
error.
The most important laboratory characterizations of the Brewer instruments have been carried out, and the whole spectral UV time series have been corrected and reprocessed using the results. The temperature characterization showed linear tem-perature dependence that can be accounted for in postprocessing. Using the angular
25
response measurements and radiative transfer model a wavelength dependent cosine correction factor can be determined for each spectrum. The spectral resolution of the instrument has also been characterized, as well as the entrance optics. The process-ing software also includes corrections for noise spikes, dark current, dead time and
ACPD
8, 1415–1455, 2008 QA of the Brewer UV measurements in Finland K. Lakkala et al. Title Page Abstract Introduction Conclusions References Tables Figures ◭ ◮ ◭ ◮ Back CloseFull Screen / Esc
Printer-friendly Version
Interactive Discussion stray light. The processing scheme can be applied for other spectroradiometers as
well, assuming that the required instrument characteristics are available.
Intercomparisons with other spectroradiometers have shown good agreement within the measurement uncertainties. The latest comparison with the portable reference spectroradiometer QASUME showed a mean difference of around 5% for both Brewers.
5
Around half of this difference can be explained by differences in the irradiance scale, and the rest stands well inside the measurement uncertainties.
Reconstructed UV dose rate data can contribute to quality assurance. They can be used to identify suspicious measurements that require more careful manual quality check. The future objective is to implement this tool as part of the automated quality
10
assurance process, so that the whole time series could be checked, and new measure-ment could be checked online. Reconstruction methods can also be used to produce UV spectra which have further potential for quality check.
The spectral UV data of both Brewers are submitted to the European UV database (EUVDB) and can be downloaded athttp://uv.fmi.fi/uvdb/index.html. All spectral UV
15
data undergo an automatic flagging procedure at the EUVDB, and the results for Finnish Brewers indicate good wavelength accuracy and that the anomalies in the spectra are very rare. It should be noted that the quality flagging does not give precise information about the accurary of the absolute calibration of the measurements.
Spectral UV data contain a lot of information about the atmosphere. Traditionally
20
they have been used for monitoring of the ozone layer, but they contain also infor-mation on aerosols, trace gases, surface albedo, and clouds. Combined with other measurements and models, the longterm time series of spectral UV data can be used for versatile study of the changing climate.
Acknowledgements. The Academy of Finland has given financial support for this work through
25
project FARPOCC. We are grateful to the operators of the sounding stations of Sodankyl ¨a and Jokioinen for daily maintenance and for performing lamp calibrations of the Brewer spectrom-eters. We thank the Nordic Ozone Group for organizing UV comparison campaigns. Harry Slaper (RIVM) is acknowledged for processing the data from the NOGIC-2000 intercompari-son campaign, by using the SHICrivm QA/QC software package (http://www.rivm.nl/shicrivm)
ACPD
8, 1415–1455, 2008 QA of the Brewer UV measurements in Finland K. Lakkala et al. Title Page Abstract Introduction Conclusions References Tables Figures ◭ ◮ ◭ ◮ Back CloseFull Screen / Esc
Printer-friendly Version
Interactive Discussion
and ancillary software for the determination of reference spectra from the campaign data. The QASUME spectroradiometer is made available by the Joint Research Centre of the European Commission in Ispra under the cooperation agreement 2004-SOCP-22187. G. H ¨ulsen acknowl-edges support from the Swiss European Cooperation in the field of Scientific and Technical Research (COST) office, SBF No. C05.0068.
5
References
Arola, A., Kaurola, J., Koskinen, L., Tanskanen, A., Tikkanen, T., Taalas, P., Herman, J., Krotkov, N., and Fioletov, V.: A new approach to estimate the albedo for snow-covered surface in space-borne retrieval method, J. Geophys. Res., 108, 4531, doi:10.1029/2003JD003492,
2003a.1420
10
Arola, A., Lakkala, K., Bais, A., Kaurola, J., Meleti, C., and Taalas, P.: Factors affecting short-and long-term changes of spectral UV irradiance at two European stations, J. Geophys. Res., 108, 4549, doi:10.1029/2003JD003447, 2003b.1417,1430,1431
Bais, A., Zerefos, C., and McElroy, C.: Solar UVB measurements with the double- and single-monochromator Brewer Ozone Spectrophotometers, Geophys. Res. Lett., 23, 833–836,
15
1996. 1428
Bais, A., Kazadzis, S., Balis, D., Zerefos, C., and Blumthaler, M.: Correcting global solar ultra-violet spectra recorded by a Brewer spectroradiometer for its angular response error, Appl. Optics, 37, 6339–6344, 1998. 1428
Bais, A., Blumthaler, M., Gr ¨obner, J., Seckmeyer, G., Webb, A. R., G ¨orts, P., Koskela, T.,
Rem-20
bges, D., Kazadzis, S., Schreder, J., Cotton, P., Kelly, P., Kouremeti, N., Rikkonen, K., Stude-mund, H., Tax, R., and Wuttke, S.: Quality assurance of spectral ultraviolet measurements in Europe through the development of a transportable unit (QASUME), in: Ultraviolet Ground-and Space-Based Measurements, Models, Ground-and Effects II, edited by: Gao, W., Herman, J. R., Shi, G., Shibasoki, K., and Slusser, J. R., SPIE 4896, 232–238, 2003. 1431
25
Bais, A. G., Gardiner, B. G., Slaper, H., Slaper, H., Blumthaler, M., Bernhard, G., McKenzie, R., Webb, A. R., Seckmeyer, G., Kjeldstad, B., Koskela, T., Kirsch, P. J., Gr ¨obner, J., Kerr, J. B., Kazadzis, S., Leszczynski, K., Wardle, D., Brogniez, C., Josefsson, W., Gillotay, D., Reinen, H., Weihs, P., Svenœ, T., Eriksen, P., Kuik, F., and Redondas, A.: The SUSPEN
ACPD
8, 1415–1455, 2008 QA of the Brewer UV measurements in Finland K. Lakkala et al. Title Page Abstract Introduction Conclusions References Tables Figures ◭ ◮ ◭ ◮ Back CloseFull Screen / Esc
Printer-friendly Version
Interactive Discussion
intercomparison of ultraviolet spectroradiometers, J. Geophys. Res., 106, 12 509–12 525, 2001. 1417,1432
Bernhard, G. and Seckmeyer, G.: Uncertainty of measurements of spectral solar UV irradiance, J. Geophys. Res., 104, 14 321–14 345, 1999. 1418
Bernhard, G., Booth, C. R., and Ehramjian, J. C.: Version 2 data of the National Science
5
Foundations Ultraviolet Radiation Monitoring Network: South Pole, J. Geophys. Res., 109,
doi:10.1029/2004JD005584, 2004.1418
Bernhard, G., Booth, C. R., and Ehramjian, J. C.: Real-time ultraviolet and column ozone from multichannel ultraviolet radiometers deployed in the National Science Foundations ultraviolet monitoring network, Opt. Eng., 44, 041011, doi:10.117/1.1887195, 2005.1418
10
Blumthaler, M.: Quality assurance and quality control methodologies used within the Aus-trian UV monitoring network, Radiation Protection Dosimetry, 111, 359–362, doi:10.1093/ rpd/nch054, 2004. 1418
Booth, C., Lucas, T., and Morrow, J.: High resolution UV spectral irradiance monitoring program in polar regions: Five years (and growing) of data available to polar research in ozone- and
15
ultraviolet -related studies, Antarct. J. U. S., 338–341, 1992. 1416
Booth, C., Bernhard, G., Ehramjian, E.C. nad Quang, V., and Lynch, S.: NSF Polar Programs UV Spectroradiometer Network 1999-2000 Operations Report, Tech. rep., Biospherical In-struments Inc., san Diego, 219 pp., 2001. 1418
Cappellani, F. and Kochler, C.: Temperature effects correction in a Brewer MKIV
spectropho-20
tometer for solar UV measurements, J. Geophys. Res., 105, 4829–4831, 1999.1423 De Backer, H., K ¨opke, P., Bais, A., De Cabo, X., Frej, T., Gillotay, D., Haite, C., Heikkil ¨a, A.,
Kazantzidis, A., Koskela, T., Kyr ¨o, E., Lapeta, B.and Lorente, J., Masson, K., Mayer, B., Plets, H., Redondas, A., Renaud, A., Schauberger, G., Schmalwieser, A., and Vaniceck, K.: Comparison of measured and modelled UV indices for the assessment of health risks,
25
Meteorol. Appl., 8, 267–277, 2001. 1417
Feister, U., Grewe, R., and Gericke, K.: A method for correction of cosine errors in measure-ments of spectral UV irradiance, Sol. Energy, 60, 313–332, 1997. 1428
Gardiner, B. G. and Kirsch, P. J.: Intercomparison of ultraviolet spectroradiometers, Ispra, 24-25 May 1995, in: Advances in Solar Ultraviolet Spectroradiometry, Air Pollut. Res. Rep. 63,
30
edited by: Webb, A. R., 67–151, Eur. Commun., Luxembourg, 1997.1417,1432
Glandorf, M., Arola, A., Bais, A., and Seckmeyer, G.: Possibilities to detect trends in spectral UV irradiance, Theor. Appl. Climatol., 81, 33–44, doi:10.1007/s00704-004-0109-9, 2005.
ACPD
8, 1415–1455, 2008 QA of the Brewer UV measurements in Finland K. Lakkala et al. Title Page Abstract Introduction Conclusions References Tables Figures ◭ ◮ ◭ ◮ Back CloseFull Screen / Esc
Printer-friendly Version
Interactive Discussion
1417
Gr ¨obner, J. and Sperfeld, P.: Direct traceability of the portable QASUME irradiance standard of the PTB, Meteorologia, 42, 134–139, 2005.1433
Gr ¨obner, J., Rembges, D., Bais, A. F., Blumthaler, M., Cabot, T., Josefsson, W., Koskela, T., Thorseth, T. M., Webb, A. R., and Wester, U.: Quality Assurance of Reference Standards
5
From Nine European Solar-Ultraviolet Monitoring Laboratories, Appl. Optics, 41, 4278–4282,
2002. 1434
Gr ¨obner, J., J., S., Kazadzis, S., Bais, A. F., Blumthaler, M., G ¨orts, P., Tax, R., Koskela, T., Seckmeyer, G., Webb, A. R., and Rembges, D.: Traveling reference spectroradiometer for routine quality assurance of spectral solar ultraviolet irradiance measurements, Appl. Optics,
10
44, 5321–5331, 2005. 1417,1433,1434
Huttunen, S., Taipale, T., Lappalainen, N. M., Kubin, E., Lakkala, K., and Kaurola, J.: Envi-ronmental specimen bank samples of Pleurozium schreberi and Hylocomium splendens as indicators of the radiation environment at the surface, Environ. Pollut., 133, 315–326, 2005. 1417
15
Josefsson, W.: UV radiation 1983-2003 measured at Norrk ¨oping, Sweden, Theor. Appl. Clima-tol., 83, 59–76, doi:10.1007/s00704-005-0160-1, 2006. 1418
Kazantzidis, A., Bais, A. F., Gr ¨obner, J., Herman, J. R., Kazadzis, S., Krotkov, N., Kyr ¨o, E., den Outer, P. N., Garane, K., G ¨orts, P., Lakkala, K., Meleti, C., Slaper, H., Tax, R. B., Tu-runen, T., and Zerefos, C. S.: Comparison of satellite-derived UV irradiances with
ground-20
based measurements at four European stations, J. Geophys. Res., 111, D13207, doi:
10.1029/2005JD006672, 2006. 1417
Kjeldstad, B., Johnsen, B., and Koskela, T. (Eds.): The Nordic Intercomparison of Ultraviolet and Total Ozone Instruments at Iza ˜na, October 1996. Final Report., vol. 36 of Meteorologisia julkaisuja, Ilmatieteen laitos, Helsinki, 1997. 1432
25
Koskela, T. (Ed.): The Nordic Intercomparison of ultraviolet and total ozone instruments at Iza ˜na from 24 October to 5 November 1993. Final report, vol. 27 of Meteorologisia julkaisuja, Ilmatieteen laitos, Helsinki, 1994. 1432
K ¨ubarsepp, T., K ¨arh ¨a, P., Manoocheri, F., Nevas, S., Ylianttila, L., and Ikonen, E.: Sepctral irra-diance measurements of thungten lamps with filter radiometers in the spectral range 290 nm
30
to 900 nm, Meteorologia, 37, 305–312, 2000.1424
Kyr ¨o, E.: Spectral Lamp and HeCd-Laser Measurements, in: The Nordic Intercomparison of Ultraviolet and Total Ozone Instruments at Iza ˜na, October 1996. Final report, edited by:
ACPD
8, 1415–1455, 2008 QA of the Brewer UV measurements in Finland K. Lakkala et al. Title Page Abstract Introduction Conclusions References Tables Figures ◭ ◮ ◭ ◮ Back CloseFull Screen / Esc
Printer-friendly Version
Interactive Discussion
Kjeldstad, B., Johnsen, B., and Koskela, T., vol. 36 of Meteorologisia julkaisuja, 79–88, Ilmatieteen laitos, helsinki, 1997.1422
Kyr ¨o, E., Taalas, P., J ¨orgensen, T., Knudsen, B., Stordal, F., Braahten, G., Dahlback, A., Neuber, R.and Kr ¨uger, B., Dorokhov, V., Yushkov, V., Rudakov, V., and Torres, A.: Analysis of the ozone soundings made during the first quarter of 1989 in the Arctic, J. Geophys. Res., 8083–
5
8091, 1992. 1417
Lakkala, K., Kyr ¨o, E., and Turunen, T.: Spectral UV Measurements at Sodankyl ¨a during 1990-2001, J. Geophys. Res., 108, 4621, doi:10.1029/2002JD003300, 2003. 1417
Lakkala, K., Redondas, A., Meinander, O., Torres, C., Koskela, T., Cuevas, E., Taalas, P., Dahlback, A., Deferrari, G., Edvardsen, K., and Ochoa, H.: Quality assurance of the solar
10
UV network in the Antarctic, J. Geophys. Res., 110, D15107, doi:10.1029/2004JD005584,
2005. 1418
Landelius, T. and Josefsson, W.: Methods for cosine correction of broadband UV data and their effect on the relation between UV irradiance and cloudiness, J. Geophys. Res., 105,
4795–4802, 2000. 1428
15
Lindfors, A., Kaurola, J., Arola, A., Koskela, T., Lakkala, K., Josefsson, W., Olseth, J. A., and Johnsen, B.: A method for reconstruction of past UV radiation based on radiative transfer modeling: applied to four stations in northern Europe, J. Geophys. Res., 112, D23201, doi: 10.1029/2007JD008454, 2007. 1417,1435
Lindfors, A. V., Arola, A., Kaurola, J., Taalas, P., and Svenøe, T.: Long-term erythemal UV doses
20
at Sodankyl ¨a estimated using total ozone, sunshine duration, and snow depth, J. Geophys. Res., 108, 4518, doi:10.1029/2002JD003325, 2003. 1417
Mayer, B. and Kylling, A.: Technical note: the libRadtran software package for radiative transfer calculations-Description and examples of use, Atmos. Chem. Phys., 5, 1855–1877, 2005, http://www.atmos-chem-phys.net/5/1855/2005/. 1430
25
Meinander, O., Josefsson, W., Kaurola, J., Koskela, T., and Lakkala, K.: Spike detection and correction in Brewer spectroradiometer UV spectra, Opt. Eng., 42, 1812–1819, 2003. 1417, 1426,1432
Meinander, O., Kazadzis, S., Blumthaler, M., Ylianttila, L., Johnsen, B., Lakkala, K., Koskela, T., and Josefsson, W.: Diurnal discrepancies in spectral solar UV radiation measurements,
30
Appl. Optics, 45, 2006. 1417
Seckmeyer, G. and Bernhard, G.: Cosine Error Correction of spectral UV-irradiances, Atmo-spheric Radiation, 2049, 140/SPIE, 1993. 1428
ACPD
8, 1415–1455, 2008 QA of the Brewer UV measurements in Finland K. Lakkala et al. Title Page Abstract Introduction Conclusions References Tables Figures ◭ ◮ ◭ ◮ Back CloseFull Screen / Esc
Printer-friendly Version
Interactive Discussion
Seckmeyer, G., Bais, A., Bernhard, G., Blumthaler, M., Booth, C., Disterhoft, P., Eriksen, P., McKenzie, R., Miyauchi, M., and Roy, C.: Instruments to Measure Solar Ultraviolet Radia-tion,Part 1: Spectral instruments, Tech. Rep. 125, WMO TD 1066, 2002. 1417
Slaper, H. and Koskela, T.: Methodology of intercomparing spectral sky measurements, in: The Nordic Intercomparison of Ultraviolet and Total Ozone Instruments at Iza ˜na, October 1996.
5
Final Report., edited by: Kjeldstad, B., Johnsen, B., and Koskela, T., vol. 36 of Meteorolo-gisia julkaisuja, pp. 89–108, Ilmatieteen laitos, Helsinki, 1997. 1433
Slaper, H., Reinen, H. A. J. M., Blumthaler, M., Huber, M., and Kuik, F.: Comparing ground-level spectrally resolved solar UV measurements using various instruments: A technique resolving effects of wavelength shift and slit width, Geophys. Res. Lett., 22, 2721–2724, 1995. 1431,
10
1432,1436
Tanskanen, A., Lindfors, A., M ¨a ¨att ¨a, A., Krotkov, N., Herman, J., Kaurola, J., Koskela, T., Lakkala, K., Fioletov, V., Bernhard, G., McKenzie, R., Kondo, Y., O’Neill, M., Slaper, H., den Outer, P., Bais, A. F., and Tamminen, J.: Validation of daily erythemal doses from Ozone Monitoring Instrument with ground-based UV measurement data, J. Geophys. Res., 112,
15
D24544, doi:10.1029/2007JD008830, 2007. 1417
Thorseth, T., Kjeldstad, B., Johnsen, B., Blumenthaler, M., Lakkala, K., and Slaper, H.: Results from the Nordic Intercomparison of ultraviolet spectroradiometers in Sweden 2000, in: Geo-physical Research Abstracts. Abstracts of the Contributions of the 27th General Assembly of the European Geophysical Society, Nice, France, 21–26 April 2002., vol. 4, 2002. 1432
20
Von der Gathen, P., Rex, M., Harris, N. R. P., Lucic, D., Knudsen, B. M., Braathen, G. O., de Backer, H., Fabian, R., Fast, H., Gil, M., Kyr ¨o, E., Mikkelsen, I. S., Rummukainen, M., Staehelin, J., and Varotsos, C.: Observational evidence for chemical ozone depletion over the Arctic in winter 1991–92, Nature, 375, 131–134, 1995.1417
Weatherhead, E., Theisen, D., Stevermer, A., Enagonio, J., Rabinovitch, B., Disterhoft, P.,
25
Lantz, K., Meltzer, R., Sabburg, J.and DeLuisi, J., Rives, J., and Shreffler, J.: Temperature dependence of the Brewer ultraviolet data, J. Geophys. Res., 106, 34 121–34 129, 2001. 1423
Webb, A., Gardiner, B., Martin, T., Leszcynski, K., Metzdorf, J., and Mohnen, V.: Guidelines for Site Quality Control of UV Monitoring, Tech. Rep. 126, World Meteorological Organization,
30
Global Atmosphere Watch, 1998.1418,1419
Webb, A., Gardiner, B., Leszczynski, K., Mohnen, V., johnston, P., Harrison, N., and Bigelow, D.: Quality Assurance in Monitoring Solar Ultraviolet Radiation: the State of the Art, Tech.
ACPD
8, 1415–1455, 2008 QA of the Brewer UV measurements in Finland K. Lakkala et al. Title Page Abstract Introduction Conclusions References Tables Figures ◭ ◮ ◭ ◮ Back CloseFull Screen / Esc
Printer-friendly Version
Interactive Discussion
Rep. 146, World Meteorological Organization, Global Atmosphere Watch, 2003. 1417,1431 WMO: Scientific Assessment of Stratospheric ozone: 1989. Report No. 20 in 2 volumes, World
Meteorological Organization, Geneva, 1990.1416
Ylianttila, L. and Schreder, J.: Temperature effects of PTFE diffusers, Optical Materials, 27, 1811–1814, doi:10.1016/j.optmat.2004.11.008, 2005.1423
5
Young, A., Bj ¨orn, L., Moan, J., and Nultsch, W.: Environmental UV Photobiology, Plenum Press, New York, 1993. 1417