HAL Id: insu-01928262
https://hal-insu.archives-ouvertes.fr/insu-01928262
Submitted on 30 Jul 2020
HAL is a multi-disciplinary open access
archive for the deposit and dissemination of
sci-entific research documents, whether they are
pub-lished or not. The documents may come from
teaching and research institutions in France or
abroad, or from public or private research centers.
L’archive ouverte pluridisciplinaire HAL, est
destinée au dépôt et à la diffusion de documents
scientifiques de niveau recherche, publiés ou non,
émanant des établissements d’enseignement et de
recherche français ou étrangers, des laboratoires
publics ou privés.
Three-dimensional gravity study of the Mid-Atlantic
Ridge: Evolution of the segmentation between 28° and
29°N during the last 10 m.y.
C. Rommevaux, C. Deplus, P. Patriat, J.-C. Sempéré
To cite this version:
C. Rommevaux, C. Deplus, P. Patriat, J.-C. Sempéré. Three-dimensional gravity study of the
Mid-Atlantic Ridge: Evolution of the segmentation between 28° and 29°N during the last 10 m.y.. Journal
of Geophysical Research : Solid Earth, American Geophysical Union, 1994, 99 (B2), pp.3015-3029.
�10.1029/93JB02361�. �insu-01928262�
JOURNAL OF GEOPHYSICAL RESEARCH, VOL. 99, NO. B2, PAGES 3015-3029, FEBRUARY 10, 1994
Three-dimensional gravity study of the Mid-Atlantic Ridge:
Evolution of the segmentation between 28 ø and 29øN
during the last 10 m.y.
C. Rommevaux, C. Deplus, and P. Patriat
Institut de Physique du Globe, ParisJ.-C. Semp6r6
School of Oceanography, University of Washington, Seattle
During the high-resolution survey SARA (Segmentation Ancienne de la Ride Atlantique),
Sea Beam bathymetry, magnetic, gravity, and seismic reflection data were collected on the flanks of the Mid-Atlantic Ridge, between 28 ø and 29øN. This survey was designed to provide
off-axis information (up to approximately 10 m.y.) and to complement a detailed on-axis survey carried out in 1988 and 1989 (Semp6r6 et al., 1990) between the Ariantis and Kane fracture zones. A previous gravity study had revealed the existence of "bulls-eye" shaped gravity lows centered
on the axial segments and gravity highs centered on the non-transform discontinuities (Linet al., 1990). We carried out a three-dimensional calculation of the mantle Bouguer anomaly in
order to investigate if the axial pattern of circular anomaly lows can be followed on the flanks of the spreading center. The off-axis gravity anomalies are characterized by anomaly lows over the centers of the segments and anomaly highs over the discontinuities. After correcting for the gravity effect of lithospheric cooling away from the ridge, the segmentation configuration determined from gravity data appears to be very similar to that deduced from bathymetry. Off-axis bathymetry is characterized by southward pointing, V-shaped basins which indicate that the
traces of the nontransform discontinuities do not follow plate motion flow lines and that each
ridge segment advances and retreats continuously. However, the gravity trace of the discontinuities is always slightly offset with respect to the bathymetric lows: northward on the western flank and southward on the eastern flank. The sense of offset between the gravity and bathymetric traces appears to be related to the right-stepping nature of the axial discontinuities.
INTRODUCTION
Most geophysical studies over •nid-oceanic ridges, particularly over the Mid-Atlantic Ridge (MAR) north and
south of the equator, have been carried out over
lithosphere less than 2 m.y. old. Multibeam bathymetry, gravity, and magnetic data have been collected to map the axes of the mid-ocean ridge and to study the processes
governing the creation of oceanic crust. These studies
have shown that the spreading axis, between two large
transform faults, consists of a narrow volcanic zone, segmented by nonu'ansfonn discontinuities with an offset
typically less than 20 km [Macdonald et al., 1991]. Three- dimensional gravity studies have been cm•'ied out over the axis of the MAR [Kuo and Forsyth, 1988; Linet al.,
1990; Morris and Derrick, 1991]. in these studies, the
mantle Bouguer anomaly was computed by removing from the free-air anomaly the gravity effect of the topography and the Moho interface, assuming a constant
Copyright 1994 by the American Geophysical Union.
Paper number 93JB02361.
0148-0227/94/93 JB-02361 $05.00
crustal thickness and density. In these studies, the effect of lithospheric cooling was subU'acted using the method of
Phipps Morgan and Forsyth [1988] and Kuo and Forsyth
[1988]. The residual anomalies showed closed-contour
gravity lows centered over tectonically defined spreading
segments. These anomalies have been interpreted in terms
of along-axis variations in crustal thickness and/or density
anomalies in the crust or upper mantle that are associated with focused upwelling of mantle beneath the middle of
ridge seg•nents [Kuo and Forsyth, 1988]. In order to study
the temporal evolution of this axial segmentation, the
SARA (Segmentation Ancienne de la Ride Atlantique) cruise extended the survey of Sempgrd et al. [1990]
(RC2912) on the flanks between 28 ø and 29øN out to 10
Ma (Figure 1). Sea Beam bathymetry, magnetic, gravity,
and seis•nic reflection data were collected on board R/V
Jean Charcot (May 1990) along a series of profiles oriented along the present flow lines (110ø). In this paper,
we present the three-dimensional analysis of gravity
anomalies off axis. This method allows us to investigate
whether the mantle Bouguer ano•nalies can be followed
off axis and to study the ternporal evolution of the ridge
segmentation.
3016 ROMMEVAUX ET AL.: THREE-DIMENSIONAL GRAVITY STUDY OF THE MID-ATLANTIC RIDGE 60øW 40øW 20øW 00øW 60øN 40øN
_
ATLANTIS
F.,.Zd
.•.
:-•/-'7
SARA
RC2912
KANE
F.
Z.
7
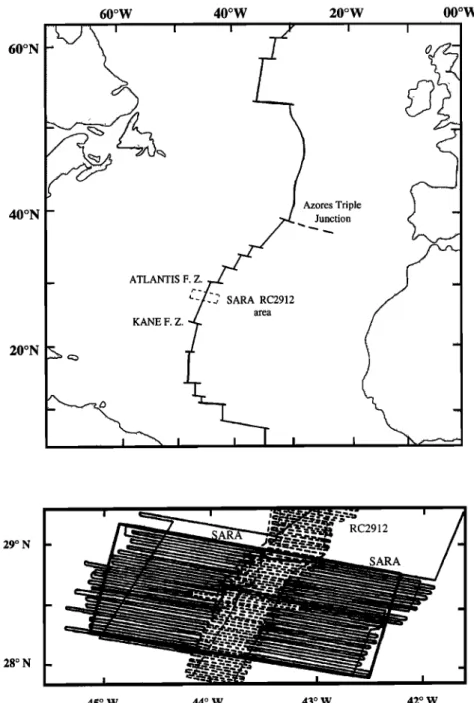
20øN :i:i•..•..• ..• 29 ø N 28 ø N 45 ø W 44 ø W 43 ø W 42 ø WFig. 1. General
setting
of study
area,
and
map
of track
lines
from the RC2912
(dashed
lines)
and SARA
(solid lines) Cruises where bathymetry Seabeam, gravity and magnetic data were collected. Heavy solid- line box indicates the grid area used in the three dimensional gravity study.BATHYMEnRY
Plate 1 a shows the bathymetric map of the survey area (see Figure 1 for limits), contoured at 200 m intervals. The along-axis spreading center morphology consists of an axial valley with a mean depth of 3500 m and a succession of topographic highs and lows. This axial topography is generally interpreted in terms of segments and discontinuities. Three segments, with lengths varying from 29 to 61 km, offset by
nontransform discontinuities (NTDs) have been identified
in this area [Sempdrd et al., 1990]. The offset between adjacent segments varies from 3 to 7 km. The topography on both flanks is formed by a series of topographic lows and highs that parallel the axis. The most striking features
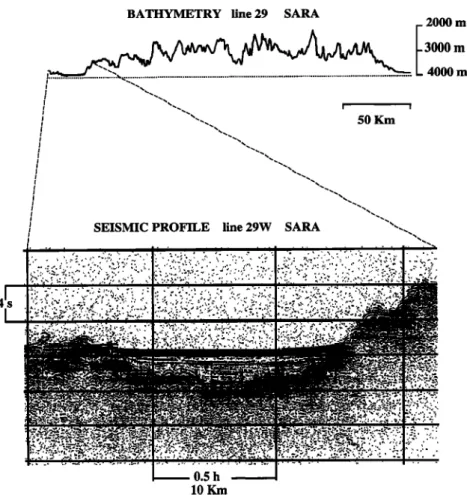
in the ridge flank bathymetry are a series of elongated oblique depressions (about 3000 m in depth) that form broad V shapes pointing south. Seismic reflection data
reveal that these depressions, which appear flat-bottomed
in bathymetric data, are in fact small basins filled with up
to 400 m of sediment (Figure 2). These topographic lows which are correlated with magnetic anomaly identification
gaps (Plate 1 a), are interpreted as the fossil traces of the
NTDs [Patriat et al., 1990]. Between anomalies 5 and 4a,
these basins on both flanks consist of a narrow zone of
lineations oblique to the axial trend of the axis [Sloan and
Patriat, 1992]. Isochrons 5 and 4a are offset by about 23 km. These observations suggest that between anomalies 5
ROMMEVAUX ET AL.: THREE-DIMENSIONAL GRAVITY STUDY OF THE MID-ATLANTIC RIDGE 3017
was offset by a small transform fault. From anomaly 4a to the present, previously created large basins were split into two separate, elongated basins enclosing a new segment (between 28ø35'N, 44ø40'W and 28ø20'N, 42ø40'W on Plate la). These bathymetric and magnetic features indicate that the axial configuration has evolved during the last 10 m.y., including the initiation of a new segment at anomaly 4a time, and lengthening and/or shortening of segments, as shown in Plate l a. This change of axial configuration has created "zigzag" traces on the flanks of the spreading center which are not parallel to the directions of either relative or absolute plate
motion.
FREE AIR ANOMALY
The gravity data used in this study were collected during the leg SARA with a KSS-30 Bodenseewerk gravimeter on board the R/V Jean Charcot and with a BGM-3 gravimeter during leg RC2912 on board the R/V Robert Conrad. Navigation was accomplished using 20 hours of Global Positioning System (GPS) per day during leg SARA and 6-7 hours/d during leg RC2912 and by transit satellite fixes during the intervals without GPS. The navigation error for both cruises is estimated at about 60 m from bathymetric cross-over errors. The gravity measurements were tied to the International Gravity Standardization Net 1971 reference system (IGSN71). The mean drift of the BGM-3 gravimeter was calculated to be 2.3 mGal/month, based on a comparison of gravity values at a reference station in Cadiz (Spain) and in Punta Delgada (Azores) before and after the cruise. The mean
drift of the KSS-30 was determined to be 1.7 mGal/month
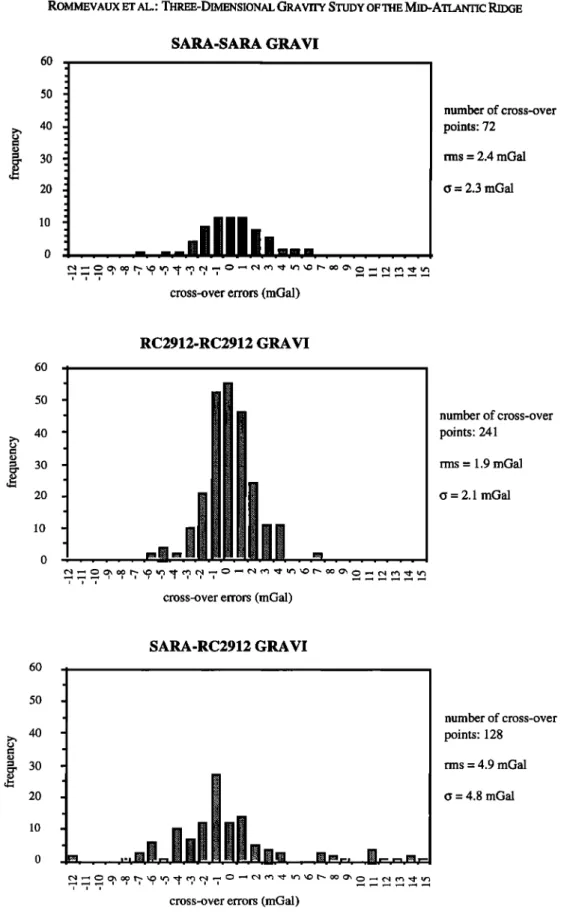
by comparing gravity values at a reference station in Punta Delgada (Azores) before and after the cruise. After applying the E6tv6s correction and accounting for instrument drift, gravity values were then reduced to free- air anomalies (FAA) by removing the theoretical field (IGSN71). On each profile, data were sampled every minute. Analysis of survey line cross-over points for the
two cruises reveals that more than 74% of the FAA
discrepancies at crossing points are less than +2 mGal. We thus estimate that the accuracy of our data is better than ___ 2 mGal (Figure 3).
Pate lb shows the FAA map, contoured at intervals of 5 mGal. The anomaly ranges from -20 mGal over the median valley to 100 mGal on the flanks. As expected, the free-air anomaly is very well correlated with bathymetry because of the large contribution of the seafloor topography to the gravity signal. Anomaly minima are associated with the greater seafloor depths: deep off-axis basins and on-axis morphological discontinuities appear clearly on the map (purples and
blues on Plate 1 b). Positive anomalies are associated with
topographic highs on the flanks. To investigate the subseafloor structure, we calculated the mantle Bouguer anomaly by removing the predicted gravity signal associated with the seafloor topography and Moho.
THREE-DIMENSIONAL GRAVITY STUDY Gravity Computation
To calculate the gravity anomaly due to a crustal
model, we use a direct three-dimensional calculation based
on the algorithm of Chapman [1979]. In this method, the shape of the studied body can be described by polyhedrons of constant density, whose surfaces are composed of a number of planar facets. We calculate the gravity anomaly for each polyhedron using the fundamental integral
formula:
(z- z' )clx' dy' dz'
g(x,
y,z)
= PGIIIv
3/2
(x-x') +(y-y') +(z-z')
where z is along the vertical upward direction, (x, y, z) refers to a point external to the volume V of the polyhedron, (x', y', z') is a point inside the polyhedron or on its boundary, G is the gravitational constant, and p the density.
We simplify the calculation by converting the volume integral to a summation of surface integrals each of which corresponds to a planar facet of the polyhedron. For every observation point, the contribution of each facet is computed and then summed to obtain the gravity effect due to the entire body. This method has been used to model the gravity anomaly over a seamount near the Japan Trench [Dubois and Deplus, 1989]. In the present study, the effect of each density interface is computed as a series of triangular facets defined by points on a rectangular grid at the depth of the interface. In order to reduce edge effects, rectangular facets of 100 km in length were added onto the edges of the grid. To define a polyhedron, a horizontal reference plane with an arbitrary depth is added. Changing the depth of this plane leads to add a constant value in the computed anomaly. Therefore, the mean value of our computed anomaly is arbitrary and we will remove it in the following computations to emphasize amplitude variations.
To generate grids, we used an algorithm based upon the cubic B spline method of Inoue [1986]. In this method the degree of smoothing is determined by two parameters: roughness and tension, which control the trade-off between the approximation of data and the total smoothness. We chose a high value of roughness (10,000) and a tension of 0.75 because of the high quality of the data. The grid size was chosen in order to use the part of the study area where the data density is homogeneous (Figure 1). To best minimize the possibility of creating interpolation artefacts, the grid interval is equivalent to the spacing of the profiles (2.8 km), which leads to a 36x96 grid.
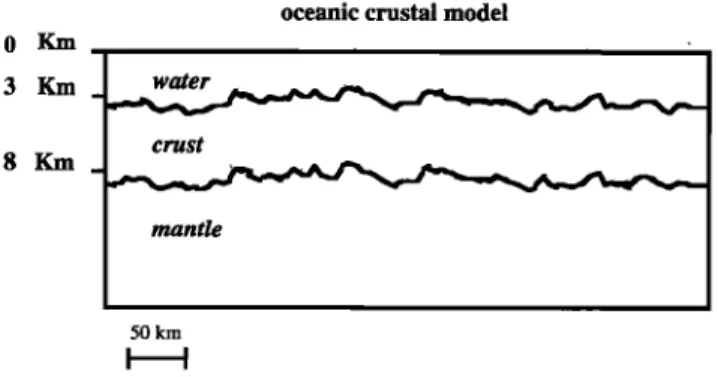
In order to compute the mantle Bouguer anomaly, the following model of the oceanic crust was used
(Figure 4a):
3018 ROMMEVAUX ET AL..' THREE-DI2vlENSIONAL GRAVITY STUDY OFTHE MID-ATLANTIC RIDGE 4400 4000 $600 ..•200 2•00 2400 2000 1600 m 45 W 44 W 45 W 45 W 44 W 43 W 29N 4A 28N b -20-10 0 10 20 30 40 50 60 70 80 90 100 110 regal 29N 28N 45 W 44 W 43 W 29N 28N 45W 44W 43W
ROMMEVAUX ET AL.: THREE-DIMENSIONAL GRAVITY STUDY OF THE MID-ATLANTIC RIDGE 3019
41s
BATHYMETRY line 29 SARA
_ 2000 rn
3000
m
... L 4000 rn
,.,..,.% i i
--.. 50 Km
SEISMIC PROFILE line 29W SARA '"-
0.5 h 10Km
Fig. 2. Bathymetric and seismic reflection profiles located along line 29. The location of this line is shown in Plate 1 a. The basin on the west flank is filled with 400 m of sediment, assuming a sediment velocity of 2 km/s.
2. The depth to the basement is defined by the sediment thickness determined by assuming a mean sediment
velocity of 2 km/s.
3. A crust of constant thickness (5000 m) with the Moho
following the bathymetry is assumed.
We assumed
a water
density
of 1.03 Mg/m
3, a
sediment
density
of 2.2 Mg/m
3, a crust
density
of
2.7 Mg/m
3, and
a mantle
density
of 3.3 Mg/m
3.
The resulting mantle Bouguer anomaly is then
interpreted in terms of deviations from this reference model.
In our gravity study we used a one-layer, crustal
model of constant thickness and density. In fact, Morris and Detrick [1991] have shown that there is only a 1-
mGal difference with a two-layer crustal model (1500 m
and
4500
m in thickness
and
2.7 Mg/m
3 and
2.9 Mg/m
3
in density, respectively). Because this is of the same order of magnitude as the accuracy of our data, we have neglected this contribution. However, we do take into account the presence of sediment in the oldest basins, because, for example, a sediment thickness of 400 m creates a gravitational effect of 5 mGal (Figure 4b).
Mantle Bouguer Anomaly
The mantle Bouguer anomaly (MBA) (Figure 4c) was obtained by subtracting from the free-air anomaly the gravity effect computed from the above crustal model. The resulting amplitudes of the anomalies range from -40 to
Plate 1. (opposite) (a) Bathymetric color map contoured (contour interval is 200m). The map wa,, constructed by interpolating the data onto a grid with a spacing of 2.8 km to minimize interpolation artifacts [Inoue, 1986]. We have superimposed the isochrons determined after anomaly magnetic
identification and plate reconstruction as dotted lines [$loan and Patriat, 1992]. The arrows on each side
of the map indicate the location of line 29 shown in Figure 2. (b) Free-air gravity anomaly color map (contour interval is 5 regal). The map was constructed like the bathymetric map. Note the good
3020 ROMMEVAUX ET AL.: THREE-DIMENSIONAL GRAVITY STUDY OF THE MID-ATLANTIC RIDGE 60 50 40 30 20 10 SARA-SARA GRAVI ß • •-• •-• i i i i i i i i •.• •.• •.• •.• •.• •.• i i
cross-over errors (mGal)
number of cross-over points: 72 rms = 2.4 mGal 2.3 mGal 60 50 RC2912-RC2912 GRAVI
cross-over errors (mGal)
number of cross-over points: 241 rms = 1.9 mGal o = 2.1 mGal 60 50 40 • 30 20 10 SARA-RC2912 GRAVI
cross-over errors (mGal)
number of cross-over
points: 128
rms = 4.9 mGal 4.8 mGal
Fig. 3. Histogram of cross-over errors of free-air anomaly for both SARA and RC2912 cruises. There are 72 cross-over points for the SARA cruise, 241 cross-over points for the RC2912 cruise, and 128 cross-over points between SARA and RC2912 cruises. The respective rms, misfit, and standard
ROMMEVAUX ET AL.: THREE-DIMENSIONAL GRAVITY STUDY OF THE MID-ATLANTIC RIDGE 3021
+40 mGal (the zero level is arbitrary as previously explained). The MBA is no longer directly correlated with the topography. Along the axis, "bulls eye" gravity lows (labels A and B in Figure 4c) are centered on the spreading segments, as previously observed by Lin et al. [1990].
Off-axis, relative minima and maxima of the MBA are
correlated with the ridge axis segment centers and the NTDs, respectively. However, the regional trend of the gravity anomaly is dominated by the effects of the cooling and deepening of the lithosphere with age which cause the MBA to increase away from the axis. Therefore it is necessary to account for this lithospheric effect before interpreting the anomalies.
Thermal Model
Variations in density occur in the upper mantle due to lithospheric cooling and thickening with age. Two different models are used and compared to determine this
thermal effect.
In the first method, we used the mantle temperature
structure calculated from a model of three-dimensional
viscous flow driven by the separation of the overriding lithospheric plates [Phipps Morgan and Forsyth, 1988]. This flow model requires that the ridge axis geometry be described by orthogonal segments and transforms and assumes a fixed axial geometry (i.e., symmetric spreading) and constant spreading rate (12.5 mm/yr). The temperature field induced by the three-dimensional flow in the upper 100 km of the mantle is solved using a finite difference method. The temperature at the bottom and top of the grid are ascribed to 0øC and 1310øC, respectively. The temperature field in each discrete horizontal layer defined by the finite difference grid is converted into density variations using a coefficient of thermal expansion
of 3. 10
-5 øK-l, and then converted
into the gravity
signal observed at the sea surface [Kuo and Forsyth,
1988].
In the second model, we computed the gravity effect resulting from the depth variations of the lithosphere/asthenosphere boundary. The deepening of this interface with age can be described as due to the cooling of a half-space, assuming that horizontal heat conduction is negligible compared with vertical heat conduction
[Parsons and Sclater, 1977; Turcotte and Schubert, 1982].
The depth of the lithosphere/asthenosphere boundary is given by
YL(t)
= 2.32x/rt
where t is the age of the lithosphere in Ma and r is the thermal diffusivity [Parsons and Sclater, 1977]. r is
assumed
to be 1 mm2/s,
and
the
contrast
of density
at this
interface
is assumed
to be -0.06 Mg/m
3. Magnetic
anomaly identification [Sloan and Patriat, 1992] allows us to generate an age grid, and the two-dimensional parametrization allows us to determine on each grid point the lithospheric depth.
o Km 3 Km 8 Km
oceanic crustal model
water crust mantle 50 km , • I
Fig. 4a. Model of the oceanic crust used in the mantle Bouguer anomaly computation. Sediments have not been represented because of the scale of the diagram. Densities
of 1.03, 2.2, 2.7,and 3.3 Mg/m
3 were assumed
respectively for seawater, sediments, crust, and mantle.
To compare the gravity effect resulting from the two methods and to test the validity of the second method, we first used, in this second model, the same assumption than in the first model (constant spreading rate of 12.5 mm/yr and fixed axis geometry). The difference between the gravity effect from the two models is less than +2 mGal (of the same order as our data accuracy).
Therefore, in case of small offsets at the NTDs as in the
SARA area, the more complicated three-dimensional computation of method 1 is not necessary.
To investigate the influence of the evolution of the
axial geometry with age, we have also computed the
gravity effects of the cooling of the lithosphere using method 2 but taking into account the variations in spreading rate and direction deduced from magnetic anomaly identification and plate reconstruction [Sloan and Patriat, 1992]. Figure 5a shows the difference between the two thermal effects (model 1 minus model 2): differences are generally between +2 mGal with extrema of about -4
and 4 mGal. The largest differences are observed along
flow lines (about 8 mGal) and can be attributed to
variations in the real spreading rate as opposed to the constant value assumed in method 1. Figure 5b displays
the mean spreading rate used in model 1 and the "instantaneous" spreading rate used in model 2. From the present to anomaly 2 time and from anomaly 4 to anomaly 5 time, when the gravity difference between the two thermal models is positive, the instantaneous rate is
faster than the mean rate, whereas it is smaller from
anomaly
4 to anomaly
2 time,
when
the gravity
difference
is negative. Along isochrons, the variations are smaller
(about +2 mGal). Thus the main difference between these
two thermal effects is observed along flow lines and appears to result from spreading rate variations. Therefore, although not a truly three-dimensional model, the lithosphere/asthenosphere boundary method constitutes our preferred method because it allows us to take into account the real pattern of lithospheric age.
3022 ROMMEVAUX ET AL.: THREE-DIMENSIONAL GRAVITY STUDY OF THE MID-ATLANTIC RIDGE
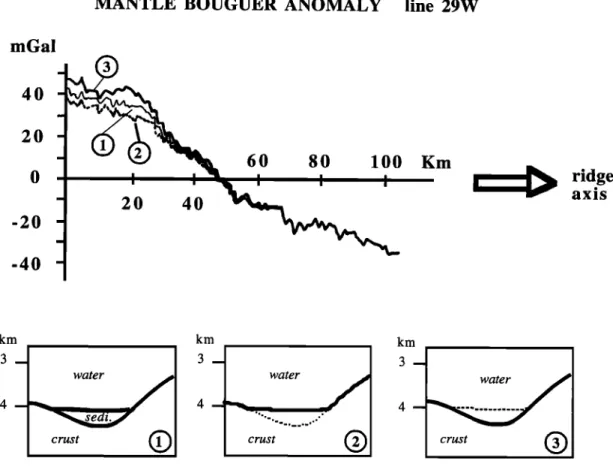
MANTLE BOUGUER ANOMALY line 29W
mGal 4O 2O -2O 2O 4O 60 80 100 Km
ridge
axis -4O km mwater
crust
km water 4crust
kmFig. 4b. Computed
gravity
anomaly
profiles
along
line
29W (see
Plate
l a for location).
The
three
curves
correspond
to three
different
crustal
models.
Solid
line is crustal
model
1 with
three
layers
(sediment,
crust,
and
mantle);
dotted
line
is crustal
model
2 where
the
top
boundary
is the
seafloor;
heavy
solid
line is crustal
model
3 where
the
top
boundary
is the
basement.
Residual Mantle Bouguer AnomalyThe gravity effect due to the deepening of the lithosphere/asthenosphere boundary was removed from the
mantle
Bouguer
anomaly
to obtain
the residual
gravity
anomaly (RMBA; Plate 2a). The total amplitude of the anomalies ranges from -20 to +20 mGal (the zero level isarbitrary).
The circular
shape
of the gravity
anomaly
lows
at the axis is very similar
to that obtained
in a previous
study of the ridge axis [Lin et al., 1990]. On the flanks of
the spreading
axis we can follow three
gravity
maxima
(yellow
and green
in Plate 2a) and three
gravity
minima
(purple
and blue in Plate 2a) which
clearly
highlight
the
configuration
of the segmentation
in the last 10 m.y. The
relative maxima of anomalies are correlated with the
bathymetric
lows,
i.e., the NTDs, and the relative
minima
of anomalies
with the bathymetric
highs,
i.e. the centers
of the segments. Between 28ø40'N, 44ø30'W and 28ø10'N,43ø05'W,
we can
follow
a RMBA low which
corresponds
to the appearance
and growth
of a new segment
also
observed in the bathymetric data in the form of a series of
topographic
highs parallel to the axis. These gravity
results confirm that prior to anomaly 4a time, the structure of the ridge in our survey area consisted of two segments separated by one discontinuity with a gravityanomaly
high
and
that
subsequent
to anomaly
4a the ridge
consisted of three segments and two NTDs.
We have compared the segmentation of the MAR
in our survey
area,
as defined
by the bathymetry
and the
magnetic anomaly identification [Sloan and Patriat,
1992], with the segmentation
defined by the gravity
anomalies
(Plate 2b). To a first order,
the segmentation
obtained from gravity anomalies is well correlated with
the bathymetric and magnetic segmentation. This segmentation is characterized by a lozenge-shaped pattern,
in plan view, of discordant zones on the flanks which do
not follow plate motion
flow lines,
demonstrating
that
each
segment
advances
and
retreats
continuously.
Crustal Thickness Modeling
The RMBA represents the part of the gravity field that cannot be explained by the predictable effect of
seafloor topography, constant crustal thickness, or mantle
density
changes
related
to the cooling
of the lithosphere.
At the axis, the RMBA was interpreted
as created
by
lateral variations
in crustal or upper mantle density,
differences in crustal thickness or some combination of these effects [Lin et al., 1990; Morris and Detrick, 1991].Profiles along isochrons, extracted from the three-
dimensional,
residual
gravity
anomaly
map, reveal that
the peak-to-trough amplitudes along the present axis andalong the anomaly 4 isochron on both flanks are similar
ROMMEVAUX ET AL..' •HREE-DIMENSIONAL GRAVITY STUDY OF THE MID-ATLANTIC RIDGE -50 -40 -30 -20 -10 0 10 20 :30 40 50 regal 3023 29N 28N
ß 4:5
W
44 W
4.5
W
• 28N 7. 45 W 44W 43 WFig.4c. Mantle Bouguer anomaly map (contour interval is 5 mGal). The zero level is arbitrary and corresponds to the mean value of the grid. Labels A and B represent "bulls eyes" gravity lows discussed
in text. Solid line is relative MBA minima; dashed line is relative MBA maxima.
suggesting a similar origin for these gravity anomalies (Figure 6). A recent seismic refraction study along the Mid-Atlantic Ridge in the South Atlantic measured crustal thickness beneath two segment with particularly large
"bull's eye'i mantle Bouguer anomaly. The variations in
crustal thickness obtained using these seismic data are of the correct magnitude to account for the observed gravity anomaly [Tolstoy et al., 1992]. For these reasons, we interpret the residual anomalies in terms of along-axis,
crustal thickness variations. To estimate these variations,
we have downward continued the residual gravity anomalies to a constant depth of 8 km below sea level (average 3 km sea water and 5 km crust) following the method of Kuo and Forsyth [1988]. A cosine taper filter was applied to the residual anomalies to circumvent instability problems inherent in the downward continuation calculation at short wavelengths. This filter removes wavelengths less than 25 km, making sure that the sources of gravity anomaly are below the constant depth of 8 km. It cosine tapers the signal with wavelengths between 25 and 35 km and passes all wavelengths greater than 35 km. This low-pass filter
smoothes out crustal thickness variations. The rms value
of the misfit between the residual anomaly and the
recomputed field is 2.31 mGal, which is comparable to
the rms value of the cross-over errors of the free-air
anomaly.
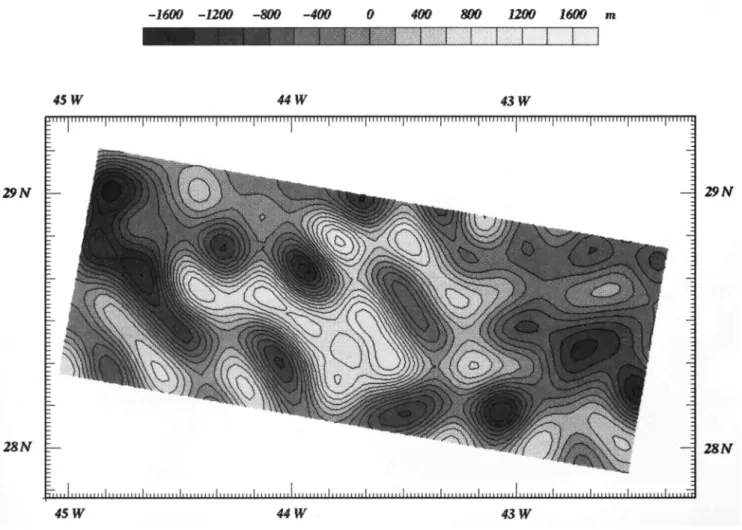
We observe that the variations in crustal thickness
in the SARA area range from -1.5 to 1.5 km (Figure 7a).
A general thinning of the oceanic crust from the axis to
the flanks can be seen, suggesting that a long-wavelength component is still present in the RMBA. Although, a
thicker crust on axis than on the flanks could indicate that
melt production is more important at present than it was at anomaly 5, it is more likely that this effect is due to an
inaccurate thermal model.
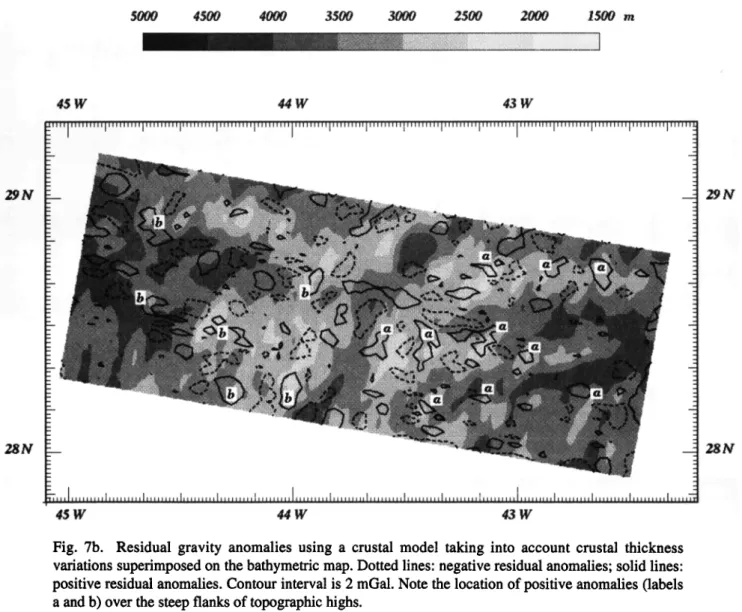
We have added the computed crustal thickness
variations to our model of constant crustal thickness and calculated the gravity effect of this new crustal model to
obtain a new residual gravity map (Figure 7b). The amplitudes of this recomputed anomalies range from -2 to +2 mGal. These short-wavelength (between 5 and 10 km) circular anomalies probably correspond to noisy data, but
it is also possible that may correspond to outcrops of higher density rocks.
To summarize, the new crustal model fits observed data within noise level. Therefore, the crustal thickness
3024 ROMMEVAUX EF AL.: THREE-DIMENSIONAL GRAVITY STUDY OFTHE MID-ATLANTIC RIDGE -8 -6 45W 44W 45W 45 W 44 W 43 W 29N 4A
Fig. 5a. Map of difference between gravity effect due to model 1 (three-dimensional method of Kuo and Forsyth [ 1988]) and model 2 (half-space cooling model of Parsons and Sclater [ 1977]). Contour interval is 2 mGal. Isochrons have been superimposed as dotted lines.
I 2 3 3A
4 4A
5
'-' ' I ' I I I• 35
I
I
I
30
i ,• I
•
I
I
I
]
'• I • I I I •. 25 . ;• 20 ' I I I • I I I I I • 15 I I I I I • I I I I I 0 1 2 3 4 5 6 7 8 9 10 Age (My)mean half spreading rate
"instantaneous" half spreading rate
anomaly
number
Fig. 5b. Comparison between spreading rates used in the two thermal models. Dashed line is mean spreading rate used in the first model; solid line is "instantaneous" spreading rate used in the second
ROMMEVAUX ET AL.: THREE-DIMENSIONAL GRAVITY STUDY OFTHE MID-ATLANTIC RIDGE 3025
mGal Anomaly 4 west flank
S
20
S
Axis
N
0
-]"•
•
...
/
,
-20
S Anomaly 4 east flank N
!
0 _.•__.•'•"•.•-••"•-•
• 19
mGal
-20
N
• • 19 mGal
Fig. 6. Mantle Bouguer anomaly profiles along isochrons on the ridge axis and on the flanks at anomaly 4. Note the constant amplitude of anomalies between the
axis and the flanks.
DISCUSSION
Comparison Between "Gravity" and "Bathymetric"
Segmentation
We observe systematic northward and southward shifts (about 10 km) of the gravity traces of the
nontransform discontinuities with respect to their
bathymetric traces on the west and east flanks, respectively. The maximum of the gravity anomaly does
not occur over the topographic basins which constitute
the off-axis traces of the NTDs but over one of the walls
bounding these traces. Such a shift has been observed over transform faults, where the maximum of the Bouguer anomaly is observed primarily over the walls of the
fracture zone rather than over the center of the fracture
zone valley [Prince and Forsyth, 1988]. A detailed study of bathymetry reveals that these basins are asymmetric: on the east flank, these basins are bounded by a gentle slope to the north and a steep escarpment to the south,
while the converse is true on the west flank of the
spreading center (Plate 2b). Assuming that the RMBA can be explained by variations in crustal thickness, this shift shows that the maximum and minimum depths of the Moho do not correspond to the topographic highs and basins respectively (Figure 8). It appears that the seafloor topography reflects the effect of intense tectonic
deformation which does not affect all the crust. Therefore
the trace of the segmentation may be partially offset by tectonic effect, while the Moho keeps the memory of the original segmentation. -1600 -1200 -800 -400 0 400 800 1200 1600 m 29N 28N 45 W 44 W 43 W 45W 44W 43W
Fig. 7a. Map of variations in crustal thickness determined by downward continuation of the residual
gravity anomalies to 8 km level. The contour interval is 200 m, and the values represent deviations
from an assumed 5 km thick crust.
3026 ROMMEVAUX ET AL.: THREE-DIMENSIONAL GRAVITY STUDY OFTHE MID-ATLANTIC RIDGE -$0 -40 -.?,0 -20 -10 0 10 20 • 40 $0 mGal 45 W 44 W 43 W 45W 44W 4•W 29N 4400 4000 .,•600 3•?,00 2800 2400 2000 1600 m 29N 28N 45 W 44 W 43 W - _ 45W 44W 4• W 29N 28N'
ROMMEVAUX ET AL.' THREE-DIMENSIONAL GRAVITY STUDY OF THE MID-ATLANTIC RIDGE 3027
Short-Wavelength Residual Anomalies
The residual anomaly shown on Figure 7b is
dominated by short-wavelength (5-10 km), positive
anomalies, which we have interpreted in terms of noise. However, several of the features, already observed on the
RMBA map, are located at the southward limit of topographic highs on the west flank (label A in Figure 7b) and at their northward limit on the east flank (label B in Figure 7b), i.e., the steep flanks of the basins. They correspond to local maxima of the free-air gravity anomaly which are not correlated with topographic highs.
Because of their short wavelengths, they cannot have a
deep-seated origin, and they cannot be interpreted in terms
of crustal thickness variation. They may however
correspond to massifs of rocks of higher densities than the
mean crustal density, such as peridotite blocks. The size of the anomalies is consistent with peridotites outcrops
previously observed along the Mid-Atlantic Ridge [Mdvel et al. , 1993; Mdvel et al. , 1991 ].
Ridge Flank Segmentation
The past segmentation of the Mid-Atlantic Ridge is defined by gravity traces of NTDs on the flanks of the
5000 4500 4000 3500 3000 2500 2000 1500 rn
291g
28N
45 W 44 W 43 W
Fig. 7b. Residual gravity anomalies using a crustal model taking into account crustal thickness variations superimposed on the bathymetric map. Dotted lines: negative residual anomalies; solid lines: positive residual anomalies. Contour interval is 2 mGal. Note the location of positive anomalies (labels a and b) over the steep flanks of topographic highs.
29h r
281V
Plate 2. (opposite) (a) Residual anomaly color map (contour interval is 5 mGal). This map was constructed by subtracting from the mantle Bouguer anomaly the attraction of the lithosphere/ asthenosphere boundary determined from the isochron map, and assuming densities of 3.3 and 3.24
Mg/m • for upper mantle and asthenosphere, respectively (model 2). Solid lines are the relative minima
of gravity anomalies interpretexl as the center of segment; dashed lines are the relative maxima of gravity anomalies interpreted as discontinuities. (b) Segment discontinuities (dashed lines) and center of segments (solid lines), as defined by the gravity study, superimposed on the bathymetrie color map. We observe a systematic shift between the bathymetrie discontinuities defined by V-shaped basins and the gravity discontinuities defined by the maximum of the anomaly.
3028 ROMMEVAUX ET AL.: THREE-D•SIONAL GRAVITY STUDY OF THE MID-ATLANTIC RIDGE
NORTH SOUTH
West
Flank
Axis
3. There are systematic shifts off axis between residual mantle Bouguer anomaly highs and bathymetric lows. We propose that the fossil trace of the nontransform discontinuities is given by these gravity highs rather than by the bathymetric lows, which are the result of subsequent tectonic events.
4. The residual mantle Bouguer anomaly interpretation
in terms of crustal thickness variations defines a mosaic
of thicker crustal blocks limited by thinner crust, which could be the temporal and spatial trace of mantle upwelling or magma supply.
5. At short wavelengths, the interpretation in terms of
crustal thickness variation allow us to define areas of
densities higher than the mean crust density, which could
indicate outcrop of high-density rocks such as peridotite.
East
Fig. 8. Along-axis model of oceanic crust at the ridge
axis and on the east and west flanks. The seafloor is
obtained from the observed bathymetry and the Moho is defined from the gravity study. Minimum Moho depth does not occur beneath the basin but beneath the steep bounding side of the segment indicated by dashed lines.
Acknowledgments. We would like to thank A. P.
Slootweg for providing us with useful computer programs for data representation and cross-over error computations and also for fruitful discussions about this paper.
B. Cornaglia provided valuable assistance in the computational problems. In addition, discussions with L. Parson and L. G61i were greatly appreciated. Particular thanks to J. Pariso and S. Tait for their English
corrections. We thank the officers, crew and scientific
personnel of the R/V Jean Charcot (leg SARA) for their support at sea. We thank anonymous reviewers for helpful
and critical reviews. This work was partially funded by
IFREMER and CNRS-Institut National des Sciences de
l'Univers DBT grant 91-559 Thbme Dynamique Globale. This is DBT contribution 649.
spreading center (Plate 2b). On each flank, alternating areas of thick and thin crust, roughly parallel to the ridge
axis, define a mosaic of crustal blocks, the limits of which are rings of thinner crust, with the former
along-axis segmentation. This pattern may result from the temporal and spatial periodicity of mantle upwelling. The spatial periodicity, parallel to the axis, corresponds to the distribution of the center of segment, while the temporal variation, perpendicular to the axis, suggest that the magmatic supply may be more robust periodically,
creating a thicker crustal block.
CONCLUSIONS
1. A striking feature of our gravity study is the
persistence of mantle Bouguer anomalies on the ridge flanks. These anomalies allow us to study the evolution of the segmentation. They are characterized by anomaly lows over the center of the segments and anomaly highs
over the discontinuities. This gravity segmentation shows that the length of the segments has varied with time, in agreement with bathymetric and magnetic studies.
2. A thermal model must take into account the
successive geometry of the ridge axis and spreading rate variations.
REFERENCES
Chapman, M. E., Techniques for interpretation of geoYde
anomalies, J. Geophys. Res., 84, 3793-3801, 1979.
Dubois, J., and C. Deplus, Gravimetry on the Erimo
seamount, Japan, Tectonophysics, 160, 267-275, 1989.
Inoue, H., A least-squares smooth fitting for irregularly
spaced data: Finite-element approach using the cubic B- spline basis, Geophysics, 51, 2051-2061, 1986.
Kuo, B. Y., and D. W. Forsyth, Gravity anomalies of the ridge-transform system in the South Atlantic between 31 ø
and 34.5øS: Upwelling centers and variation in crustal
thickness, Mar. Geophy. Res., 10, 205-232, 1988.
Lin, J., G. M. Purdy, H. Schouten, J. C. Semptrt, and C. Zervas, Evidence for focused magmatic accretion along the
Mid-Atlantic Ridge, Nature, 344, 627-632, 1990.
Macdonald, K. C., D.C. Scheirer, and S. M. Carbotte, Mid-
ocean ridges: Discontinuities, segments and giant cracks, Science, 253, 986-994, 1991.
Mtvel, C., M. Cannat, J. F. Casey, and J. A. Karson,
Generation of oceanic lithosphere at slow spreading
centers: Drilling in the western wall of the MARK area,
Proc. Ocean Drill. Program Initial Rep., in press, 1993.
Mtvel, C., M. Cannat, P. Gente, E. Marion, J. M. Auzende,
and J. A. Karson, Emplacement of deep crustal and mantle rocks on the west median valley of the MARK area (MAR,
23øN), Tectonophysics, 190, 31-53, 1991.
ROMMEVAUX ET AL.: THREE-D•SIONAL GRAVI• STUDY OFTHE MID-ATLANTIC RIDGE 3029
gravity anomalies in the MARK area, Mid-Atlantic ridge 23øN, J. Geophys. Res., 96, 4355-4366, 1991.
Parsons, B,. and J. G. Sclater, An analysis of the variation of ocean floor bathymetry and heat flow with age, J. Geophys. Res., 82, 803-827, 1977.
Patriat, P., C. Deplus, C. Rommevaux, H. Sloan, P. Hunter, and H. Brown, Evolution of the segmentation of the Mid- Atlantic Ridge between 28 ø and 29øN during the last 10 Ma: Preliminary results from SARA Cruise ( R/V Jean Charcot, May 1990), Eos Trans. AGU, 71, Fall Meeting suppl.,
1629, 199O.
Phipps Morgan, J.P., and D. W. Forsyth, Three-dimensional flow and temperature perturbations due to a transform offset: effects on oceanic crustal and upper mantle structure, J. Geophys. Res., 93, 2955-2966, 1988.
Prince, R. A., and D. W. Forsyth, Horizontal extent of anomalously thin crust near the ¾ema fracture zone from the three-dimentional analysis of gravity anomalies, J. Geophys. Res., 93, 8051-8063, 1988.
Semp6r6, J. C., G. M. Purdy, and H. Schouten, Segmentation of the Mid-Atlantic Ridge between 24øN and 30ø40'N,
Nature, $44, 427-431, 1990.
Sloan, H., and P. Patriat, Kinematics of the North American-
African plate boundary between 28 ø and 29 ø N during the
last 10 My: Evolution of the axial geometry an d spreading rate and direction, Earth Planet. Sci. Lett., 113, 323-341,
1992.
Tolstoy, M., A. J. Harding, and J. A. Orcutt, An explanation
for "bull's Eye" mantle Bouguer anomalies on the southern
Mid-Atlantic Ridge, Eos Trans. AGU, 73 (43), Fall Meeting
suppl., 495, 1992.
Turcotte, D. L., and G. Schubert, Heat transfer, in
Geodynamics: Applications of Continuum Physics to Geological Problems, pp. 135-197, John Wiley,
New York, 1982.
C. Deplus, P. Patriat, and C. Rommevaux, Institut de Physique du Globe, 4 place Jussieu, boite 89, 75252 Paris
Cedex 05, France.
J.-C. Semp6r6, School of Oceanography, WB-10, University of Washington, Seattle, WA 98195.
(Received December 7, 1992; revised July 22, 1993; accepted August 20, 1993.)
![Fig. 5a. Map of difference between gravity effect due to model 1 (three-dimensional method of Kuo and Forsyth [ 1988]) and model 2 (half-space cooling model of Parsons and Sclater [ 1977])](https://thumb-eu.123doks.com/thumbv2/123doknet/14800338.605914/11.901.87.822.90.622/difference-gravity-effect-dimensional-forsyth-cooling-parsons-sclater.webp)