HAL Id: insu-00160450
https://hal-insu.archives-ouvertes.fr/insu-00160450
Submitted on 6 Jul 2007
HAL is a multi-disciplinary open access
archive for the deposit and dissemination of sci-entific research documents, whether they are pub-lished or not. The documents may come from teaching and research institutions in France or abroad, or from public or private research centers.
L’archive ouverte pluridisciplinaire HAL, est destinée au dépôt et à la diffusion de documents scientifiques de niveau recherche, publiés ou non, émanant des établissements d’enseignement et de recherche français ou étrangers, des laboratoires publics ou privés.
Hydrothermal synthesis and characterization of
dioctahedral smectites: A montmorillonites series
Sébastien Lantenois, Rémi Champallier, Jean-Michel Bény, Fabrice Muller
To cite this version:
Sébastien Lantenois, Rémi Champallier, Jean-Michel Bény, Fabrice Muller. Hydrothermal synthesis and characterization of dioctahedral smectites: A montmorillonites series. Applied Clay Science, Elsevier, 2008, 38 (3-4), pp.165-178. �10.1016/j.clay.2007.03.005�. �insu-00160450�
Hydrothermal synthesis and characterization of dioctahedral
smectites: A montmorillonites series
S. Lantenois a, b, R. Champalliera, J.-M. Bénya and F. Mullera
aInstitut des Sciences de la Terre d'Orléans (ISTO), CNRS-Université d'Orléans, 1A rue de la
Férollerie, 45071 Orléans Cedex 2, France
bAIME (Agrégats, Interfaces et Matériaux pour l’Energie), Institut Charles Gerhardt, CNRS
UMR 5253, UM2, ENSCM, CC 015, Place Eugène Bataillon, 34095 Montpellier Cedex 5, France
Abstract
The aim of this study is to synthesize and finely characterize montmorillonite samples, dioctahedral smectites without tetrahedral charges (structural formulae
Nax(Al(2 − x)Mgx)Si4O10(OH)2), to allow their use as reference samples in clay science. The
montmorillonites synthesis under hydrothermal conditions at different pressures and with various layer charge deficit has been attempted. The temperature was fixed at 320 °C, the pressure parameter values were 20 MPa, 80 MPa, 120 MPa and 200 MPa. The Mg content varied from 0.25 to 0.60 per half unit cell. The reaction products have been characterized with multi-technique analyses (ICP-AES, EMP, CEC, XRD, FTIR, NMR and TGA).
Montmorillonite phase was only produced at 120 and 200 MPa.
At 20 and 80 MPa, the results suggest that a 0.33 and 0.16-tetrahedral charge deficit exist in the formed samples. Moreover, the octahedral occupancies are higher than two (2.15 and 2.07 at 20 and 80 MPa respectively). In these experimental conditions, the synthetic smectites are mixtures between montmorillonite, beidellite and saponite.
At 120 MPa and for a Mg content of 0.25 or higher than 0.33, the synthetic products were also mixtures of smectites. Tetrahedral charge deficits of 0.11, 0.11 and 0.15 were found for Mg contents of 0.25, 0.50 and 0.60 respectively. The octahedral occupancy was also higher than 2.00.
A montmorillonite phase with only octahedral charges and an octahedral occupancy near 2.00 was synthesized for a Mg content of 0.33 and at pressures equal to or higher than 120 MPa. This low charge reference smectite shows a very low amount of accessory minerals and an octahedral charge deficit only created by the presence of magnesium in the structure. This montmorillonite can be compared structurally to the most studied natural one: the
montmorillonite SWy-2 from Wyoming.
Keywords: Hydrothermal synthesis; Dioctahedral smectites; Synthetic montmorillonite;
1. Introduction
Smectites are one of the most common phyllosilicates family found in soils and sediments. Their specific characteristics, such as a high specific surface area, cation exchange capacities or hydration properties, give to this clay mineral family many industrial interests and a great variety of applications (nanocomposite science, ceramic manufacturing, cosmetics industry, waste confinement or soils decontamination). The natural smectite materials have numerous chemical and mineralogical compositions which can induced great changes in the properties such as charge deficit, cation exchange capacity or structural and microstructural
characteristics. These properties should produce important behaviour variations in the industrial processes. However, some of these characteristics, such as the presence of accessory minerals may limit the potential use of smectites without a pretreatment. A possibility to avoid pretreatments is to use synthetic smectite.
Few studies realized in the last 40 years have been realized with the objective to determine stability fields of synthetic smectites. All these studies are summarized in a critical review published by Kloprogge et al. (1999). Some smectites are currently synthesized and used in clay science. For instance, synthetic trioctahedral smectites such as saponites (Suquet et al., 1977, Suquet et al., 1982 and Pelletier et al., 1999), hectorites (Carrado et al., 1997) or laponites (Qi et al., 1996) are often used as reference samples and sometimes industrially produced (see the Clay Minerals repository). However, whereas the dioctahedral smectites subfamily is predominant in soils and widely used in industry, these smectites are rarely synthesized and used in industrial developments or experimental researchs.
The stability field of the different dioctahedral smectites has been investigated for beidellite (Kloprogge et al., 1990 and Kloprogge et al., 1993), nontronite (Decarreau et al., 1987) and montmorillonite (Nakazawa et al., 1991, Yamada et al., 1991, Yamada et al., 1994a and Yamada et al., 1994b). For montmorillonite synthesis, Sand et al. (1953), Roy and Sand (1956) and Sand et al. (1957) have realized some experimental runs but the differentiation between montmorillonite and beidellite was not clearly established (Kloprogge et al., 1999). Moreover, a big part of the hydrothermal syntheses realized by these authors, have been performed without magnesium, which is necessary to obtain montmorillonite samples. Nevertheless, the temperature of synthesis of dioctahedral smectites seems to be limited between 250 and 450 °C . Harward and Brindley (1966) have synthesized montmorillonites at 300–350 °C and 100 MPa, but the reaction product, coming from these experiments, is
composed of a mixture of montmorillonite, beidellite, saponite, paragonite, kaolinite and amorphous material. Levinson and Vian (1966) and Levinson and Day (1968) have
synthesized a mixture between montmorillonite and calcite by reaction of dolomite, kaolinite, quartz and water at 300 °C . Yamada et al., 1994a and Yamada et al., 1994b have also
obtained a mixture of minerals containing montmorillonite at high pressure and high
temperature. Yamada et al. (1991) and Nakazawa et al. (1991) synthesized montmorillonites or montmorillonite/beidellite mixtures by hydration of Na–Mg-aluminosilicate glasses under a hydrothermal pressure of 100 Mpa and with varying water/solid ratio. Only montmorillonite was obtained below 375 °C with Mg-rich glass phases but only XRD patterns were realized in order to characterize these samples. All these studies highlighted the difficulties to synthesize only the montmorillonite phase. In addition, the lack of complete characterization of the formed products, limits the use of these materials (Kloprogge et al., 1999).
The aim of this study is to synthesize and finely characterize dioctahedral smectite samples to permit their use as reference samples in clay science. In this study, Na-montmorillonite samples (theoretical formula Nax(Al(2 − x)Mgx)Si4O10(OH)2) are synthesized under different
experimental conditions in order to obtain single-phase synthetic samples.
In the first part of this study, the synthesis pressure influence on the nature of reacted products is investigated; the layer charge deficit, corresponding to the x suffix in the theoretical
formula, is fixed at 0.33 for this part.
In the second part, the results obtained on samples synthesized with various layer charge deficits (0,25 < × < 0,6) are discussed.
Obtained samples are characterized by atomic emission spectroscopy (ICP-AES), electron microprobe, powder X-ray diffraction (XRD), fast Fourier transform infrared spectroscopy (FTIR), thermal gravimetric analyses (TGA), 27Al and 29Si MAS NMR and cationic exchange capacity (CEC) measurements.
2. Experimental procedures
2.1. Starting materials
The synthetic clay samples were crystallized from gels under hydrothermal conditions. The chemical composition of the gel phases was chosen to correspond to the ideal chemical composition of the desired smectite phase. The variation of the layer charge deficit from 0.25 to 0.60 was obtained by modification of the Mg content.
Gels were prepared following a method adapted from Hamilton and Henderson (1968) using: tetraethylorthosilicate (TEOS, Fluka) as the silicon source, Mg(NO3)2.6H2O (Merck),
Al(NO3)3.9H2O (Merck), HNO3 (Aldrich), Na2CO3 (Merck), NH4OH (Aldrich) and ethanol
(Aldrich) as reagents with a 99% minimum grade purity. After dissolution of Al- and Mg-nitrates and of Na2CO3 (19.68 g, 2,71 g and 0.56 g respectively for the GM0.33 gel phase Table
1) in 45 ml of nitric acid 0.45 M, TEOS (26.26 g, for the GM0.33 gel phase) and ethanol
(30 ml) were added. A precipitate was obtained by neutralizing the resulting solution at pH ~ 6 by addition of NH4OH (0.2 M). This precipitate was dried at 80 °C for 24 h, ground in an
agate mortar and heated 30 min up to 400 °C to remove the nitrates and to obtain Al, Mg, Si and Na oxide gels.
The final gel phases are amorphous phases (controlled by XRD). Their chemical compositions were measured by ICP and are reported in Table 1.
2.2. Hydrothermal syntheses
Samples were synthesized in an internally heated pressure vessel. 0.1 g of gel and deionized water (weight ratio 1/2) were loaded in a gold tube (0.7 ml internal volume). The tube was then sealed and heated to 320 °C under different argon pressures (between 20 and 200 MPa) during 15 days. Two sets of experiments were realized, one with GM0.33 starting gel at
different pressures and the second one by using different gel phases with variable Mg content at a fixed pressure of 120 MPa. The different experimental conditions of the syntheses are reported in Table 2. Additional experiments were also performed during 10, 30 and 45 days
on SM0.33 sample at 120 MPa in order to study the smectite synthesis kinetics. After cooling
of the vessels, the solid products were extracted from the reaction tubes, washed with distilled water, dried at 80 °C overnight and ground before structural and chemical characterizations.
2.3. Characterizations
The chemical compositions of the starting gel phases were checked by ICP-AES analysis using a JOBIN-YVON ULTIMA spectrometer. 100 mg of a gel was dissolved by acid attack after alkaline fusion and the Si, Al, Mg and Na concentrations were measured.
The chemical compositions of the synthesized products were performed using a CAMECA SX50 electron microprobe (EMPA) operating at 15 kV accelerating voltage. The analyzed samples were previously washed in ethanol and then dialyzed in deionized water for 1 week. After dialyze, the < 2 μm size fraction of samples, which mainly corresponds to the clay fraction, was extracted, dried and finely ground in an agate mortar. Knowing that the best microprobe analyzes are realized on flat surfaces, the sample powder was pressed in an
evacuable die to prepare a pellet. A part of this pellet was fixed on a glass slide and then silver metallized before analysis.
Powder XRD patterns were recorded in transmission geometry using CoKα radiation (35 mA, 35 kV). The use of an INEL CPS 120 curved position sensitive detector allows the diffracted intensity to be recorded simultaneously over a 4–50°2θ range with a 0.03° step size. The non-linearity of the detector response was corrected (Roux and Volfinger, 1996). A 0.5 mm diameter Lindemann glass tube was used to hold the sample powder. The XRD patterns were recorded using raw samples dried at 80 °C and grounded. In order to make the distinction between smectites with predominantly octahedral or tetrahedral charges, an expandability test adapted from the Greene-Kelly (GK) test, (Greene-Kelly, 1953 and Lim and Jackson, 1986) based on the Hofmann–Klemen effect (Hofmann and Klemen, 1950) has been performed on some samples. For this test, the montmorillonite samples were prepared by washing the reaction product three times with aqueous LiCl (1 M) and once with ethanol. The Li-saturated samples were dialyzed during 3 days, then dried at 80 °C and ground. Powders were placed in ceramic crucibles, heated overnight at 350 °C and then put into a water saturated atmosphere during 2 days to allow rehydration of the samples before XRD analysis. Finally, the XRD patterns show peaks which correspond to a 9.5 Å (001) basal spacing for collapsed octahedral charge smectites and to a 12.5 Å (001) basal spacing for tetrahedrally charged smectites. Infrared spectra (IR) were recorded using a NICOLET Magna-IR 760 Fourier transform spectrometer. To avoid the K+–Na+ exchange within sample during analysis and to remove the contribution of the water absorbed by the KBr pellet in the spectral range of O−H stretching band, a NICOLET Nic-Plan microscope was used. The spectrometer and the microscope were purged with dry air to remove most of atmospheric H2O and CO2. The powder was spread
over the NaCl window of the microscope stage. The analysed sample area was a 100 μm diameter circle chosen under the microscope 15X Cassegrainian objective. The operating conditions were 200 scans, 2 cm− 1 resolution with no ambient CO2–H2O corrections. The
studied wavenumber range was 650 cm− 1–4000 cm− 1 according to the spectrometer beamsplitter, the sample holder type (NaCl here) and the microscope detector (NICOLET MCT-A).
The cation exchange capacity (CEC) was measured using the copper complex method (Gaboriau, 1991) for which 600 mg of the sample were suspended for 12 h in 25 ml of a
0.01 M ethylene di-amine copper complex (Cu(EDA)2Cl2) solution. After centrifugation, the
solution Cu concentration was measured using a 905-GBC atomic absorption spectro-photometer from GBC Scientific Equipment.
Transmission Electron Microscopy (TEM) observations were performed using a JEOL 2000 FX microscope operating at 200 kV. Samples were prepared as a suspension in ethanol, from which a drop was dried on copper grids covered with a carbon film.
The 27Al and 29Si MAS NMR spectra of the solid samples were obtained, at room
temperature, using an Avance 300 Brucker spectrometer. The relevant parameters of the solid state NMR for the two different nuclei are listed in Table 3. Decomposition of the NMR 27Al and 29Si spectra was performed with Peak-Fit (v4.05) software using Gaussian curves for 29Si spectra and asymmetric Gaussian curves for 27Al spectra.
The Thermal Gravimetric Analyses (TGA) were recorded with a SETARAM TGA 92 microanalyser, with a heating rate of 10 K/min under N2 atmosphere. A 60-mg sample was
used for each measurement. The derivative of the TG curve (DTG) gives the weight loss by degree, which was assigned to hydration water between 20 and 200 °C and to water evolved from hydroxyl groups between 500 and 750 °C.
2.4. Quantification of the relative proportion of synthesized smectite
The synthesis yield was estimated by TGA measurement. The amount of H2O loss between
400 and 800 °C (Δm in Fig. 1B) which corresponds to the dehydroxylation process was measured and compared to the amount of structural OH loss calculated for 100% of smectite synthesized. For example, in SM0.33 sample, 100% of smectite synthesized corresponds to a
H2O mass loss of 4.95% (18 g/mol for a dry smectite with a molar mass of 364 g/mol,
calculated using the chemical composition of GM0.33 in Table 4). Relative proportions of
synthesized smectite are presented in Table 4. They are estimated from the ratio between the percentage of mass loss measured by TGA (3,71%, 3,96%, 4,31% and 4,26% for SM0.33-200,
800, 1200 and 2000 respectively) and the one calculated for 100% of smectite synthesized. In this quantification method, the potential mass loss of the residual amorphous phase was supposed to be null between 400 and 800 °C (Fig. 1A). The structural OH loss of neo-formed kaolinite phase, formed in negligible amount (see below), was also not considered but the absolute precision on the proportion of smectite formed was estimated to be ± 5%.
3. Results
3.1. Pressure evolution
The experimental conditions used for the samples (SM0.33-200, SM0.33-800, SM0.33-1200 and
SM0.33-2000) starting with the GM0.33 gel phase (chemical composition in Table 1 and XRD
patterns Fig. 2a) at four different pressures (20, 80, 120 and 200 MPa) are summarized in Table 2.
Smectite mineral is the predominant crystalline phase in all the reacted samples. It was clearly identified with (00ℓ) reflections at 8.32° (12.5 Å), 17.08° (6.8 Å), 33.85° (3.12 Å) and
The presence of a small amount of kaolinite was also observed at 20 and 80 MPa (Fig. 2b and c). A difference between the SM0.33-200 sample and the others appears after the GK test (Fig.
2b). For the three samples SM0.33-800, SM0.33-1200 and SM0.33-2000, the (001) reflection peak
shifts from ≅ 12,5 Å to ≅ 9.5 Å (10.87°, Fig. 2c, d and e), while for the SM0.33-200 sample this
reflection peak shifts near 10.8 Å (10.24°, Fig. 2b) and broadens.
On the infrared spectra, a vibration band was observed for all samples between 3648 and 3660 cm− 1 in the OH bond stretching range (Fig. 3Ab, Ac, Ae and Af). This band was not present in the starting gel phase spectrum (Fig. 3Aa) and corresponds to the smectite
structural OH bonds vibration band. The band at 3700 cm− 1 indicates that a small amount of kaolinite is present in all the samples. In the reacted products, some characteristic smectite bands appear in the OH bending range between 800 and 950 cm− 1 (Fig. 3Bb, Bc, Be and Bf). Three bands at 805, 885 and 918 cm− 1 were identified in the four samples (SM0.33-200,
SM0.33-800, SM0.33-1200, SM0.33-2000). A band at 850 cm−1 is observed in SM0.33-800,
SM0.33-1200 and SM0.33-2000 samples and at 830 cm−1 in SM0.33-200 and SM0.33-800 samples.
The interpretation of all these vibration bands will be discussed below.
Differences between the SM0.33-200 and SM0.33-800 and the other two (SM0.33-1200, SM0.33
-2000) were observed in chemical analyses (Table 4). A silicon content deficit was observed and partially balanced by the presence of aluminum in the tetrahedral sheet. The layer charge deficit was mainly localized in the tetrahedral sheet for SM0.33-200, shared out between
octahedral and tetrahedral sheets for SM0.33-800 and predominantly found in the octahedral
sheet for SM0.33-1200 and SM0.33-2000 samples. The chemical composition of SM0.33-1200
sample was equivalent to those of SM0.33-2000 sample and closely related to the starting gel
phase chemical composition (structural formula in Table 4). The octahedral occupancy equals 2.02 for the two samples and the octahedral charge is 5.70e for SM0.33-1200 and 5,71e for
SM0.33-2000. On the contrary, the octahedral occupancy values are 2.15 and 2.07 for SM0.33
-200 and SM0.33-800 samples respectively. These results are probably correlated with a very
high octahedral charge value (5.97e and 5,83e for SM0.33-200 and SM0.33-800 respectively).
The CEC starting values were approximately the same for the four samples but after GK test, these CEC values became different from a sample to another. The CEC decrease was high for SM0.33-1200 and SM0.33-2000 (109 to 8 and 112 to 10 meq/100 g respectively), while it was
low for SM0.33-800 (104 to 42 meq/100 g) and even lower for SM0.33-200 sample (111 to
81 meq/100 g). These results confirm some differences of charge deficit distribution between the octahedral and the tetrahedral sheets in the synthetic smectite samples.
3.2. Evolution of the layer charge deficit
A second experimental run was realized at 120 MPa with gel phases containing increasing amount of magnesium (chemical compositions in Table 1) in order to modify the smectite layer charge. The experimental conditions used for the four samples (SM0.25-1200, SM0.33
-1200, SM0.50-1200 and SM0.60-1200) were summarized in Table 2.
For the four samples, smectite was the predominant crystalline phase. The X-ray patterns presented in Fig. 4 show that the smectite phase was clearly identified with (00ℓ) reflection peaks at 12.5, 6.8 and 3.12 Å and with (02.11) and (20.13) bands at 4.45 Å and 2.55 Å respectively (Fig. 4). A difference was just observed in the (06.33) band with the presence of a shoulder near 1.51 Å in SM0.50-1200 and SM0.60-1200 samples. This shoulder, which is
characteristic of the presence of trioctahedral domains in the octahedral sheets of smectites (see below), is stronger in SM0.60-1200.
The infrared spectroscopy spectra show a vibration band corresponding to the smectite structural OH stretching band between 3648 and 3650 cm− 1 (Fig. 5A). A band at 3700 cm− 1, corresponding to the kaolinite phase, was also observed. Some differences between samples spectra were observed in the OH bending region. If the bands at 805, 850, 885 and 918 cm− 1 were always observed, another band at 830 cm− 1 was identified in the SM0.50-1200 and
SM0.60-1200 samples (Fig. 5B). According to the discussion section, no assignment is given to
this band.
Fig. 6 shows the derivative of the TGA curves. The mass loss between 550 and 750 °C corresponding to structural OH loss was maximum at 685 °C for SM0.25-1200 and SM0.33
-1200 samples (Fig. 6a and b). This maximum shifted to 670 and 662 °C for SM0.50-1200 and
SM0.60-1200 samples respectively (Fig. 6c and d). Moreover, the presence of a second
dehydroxylation maximum near 620 °C was observed in SM0.60-1200 samples.
Some differences between the SM0.25-1200, SM0.33-1200 samples and the others were also
observed in the chemical analyses results (Table 4). For SM0.50-1200 and SM0.60-1200
samples, the octahedral cation occupancy values are higher than 2.00 (2.10 and 2.12 respectively) and the chemical formulae of the starting gels, calculated using the ICP-AES measured chemical composition, and those of the reaction products, calculated from the EMPA measured chemical composition, show significant discrepancies (see for example the tetrahedral aluminium or the octahedral magnesium contents).
3.3. Comparison between SM0.33-1200(x = 0,33) and SM0.25-1200 (x < 0,33)
The chemical composition of the SM0.33-1200 sample was closely related to the starting gel
phase chemical composition (structural formulae Table 4) though the one calculated for SM0.25-1200 sample showed some differences. In this last sample, a tetrahedral charge deficit
was observed and equal to 0.11; it's CEC value decrease from 91 meq/100 g to 22 meq/100 g after GK test, confirms this result.
3.4. Comparison between SM
0.33-1200 (x = 0.33) and SM
0.50-1200, SM
0.60-1200 (x > 0.33)
A comparison between the charge values of SM0.33-1200 sample and the other two samples
SM0.50-1200 and SM0.60-1200, shows that the charge deficit came from the octahedral layer
chemical composition for SM0.33-1200 sample though it was shared out between the
octahedral and tetrahedral layers for the other two samples (Table 4). Similar conclusions were also drawn from the CEC measurement results. After GK test, the CEC value, which was 8 meq/100 g for SM0.33-1200 sample, increased up to 25 and 39 meq/100 g for SM0.50
-1200 and SM0.60-1200 samples respectively.
3.5. Presence of residual gel phases
Amorphous gel phase (Fig. 7A) used for the synthesis was always observed by TEM in SM0.33-1200 samples even after 15 days run duration (Fig. 7B) because of a not complete
experiments were realized, the increase of the run duration and the elimination of the
amorphous phase by selection of the < 2 μm size fine fraction corresponding classically to the clay fraction. In the TEM observations of SM0.33-1200 samples after 30 days and SM0.33-1200
< 2 μm size fraction (Fig. 7C and D respectively), the presence of residual amorphous phase is not clearly identified.
An estimate of the relative proportion of synthesized smectite as a function of duration was obtained from TGA measurements. Results of this quantification were plotted for SM0.33-1200
sample on Fig. 8. The crystallization of montmorillonite proceeds rather rapidly. After only 10 days, ≅ 80% of montmorillonite was produced and a maximum of 95% was reached after 30 days. Longer run duration does not significantly improve the montmorillonite yield in these experimental conditions.
The estimate of the formed smectite weight obtained after 15 days are reported in Table 4. The elimination of an important part of the residual amorphous phase (between 70 and 90%, determinated by TGA, data not shown) was realized by selection of the fine clay fraction (size of particles < 2 μm). These purified samples were only used in chemical analysis to obtain structural formulae that are more realistic.
4. Discussion
The hydrothermal synthesis products presented in this paper were predominantly smectite phases, associated with minor accessory phases (starting amorphous phase or kaolinite) which can be considered as impurities. The structural characteristics of the synthetic smectite phases were more or less different from the theoretical formula of the wished montmorillonite: Nax(Al(2 − x)Mgx)Si4O10(OH)2. In the following discussion, the influence of the pressure and
gel composition will be discussed to determine the experimental conditions, which optimize the synthetic montmorillonite production.
4.1. Influence of the pressure factor
The stability field of synthetic montmorillonites was clearly fixed for temperatures between 220 and 450 °C (Roy and Sand, 1956, Harward and Brindley, 1966, Nakazawa et al., 1991, Yamada et al., 1991, Reinholdt et al., 2001 and Reinholdt et al., 2005). In this literature, the pressure parameter was not studied in detail. It is often fixed at 100 MPa for syntheses realized in an alkali to neutral medium (Harward and Brindley, 1966, Nakazawa et al., 1991 and Yamada et al., 1991) and lower than 10 MPa for those realized in a slightly acidic and fluoride medium (Reinholdt et al., 2001 and Reinholdt et al., 2005). In the experimental conditions fixed in this study, synthesized smectites type depends on the pressure parameter. At 20 MPa, the smectite SM0.33-200 was predominantly tetrahedrally substituted (Table 4).
The presence of magnesium in the octahedral sheet was coupled with an octahedral occupancy higher than 2.00, which can be associated with a di-trioctahedral smectite
production (mixture between saponite and beidellite). This result was confirmed on the XRD pattern by a rather large (001) reflection near 10.8 Å after GK test (Fig. 2b). The CEC decrease, after the GK test (from 111 meq/100 g to 81 meq/100 g) also shows that this product is not a high purity montmorillonite, for which the CEC value equals approximately zero after Hofmann–Klemen effect (1950). The differentiation between montmorillonite, beidellite and saponite was difficult in the OH bonds stretching zone of the infrared spectra. However, some differences could be observed in the (cation, cation)−OH bending zone (Fig.
3Bb). In dioctahedral smectites, two bands are classically associated with (Al, Al)−OH and (Al, Mg)−OH bending vibrations (915 cm− 1 and 845 cm− 1 respectively, Farmer, 1974, Madejova et al., 2000, Madejova, 2003 and Gates, 2004). In your case, only one band at 918 cm− 1 was observed. The absence of dioctahedral (Al, Mg)−OH band near 850 cm− 1 can be associated with a di-trioctahedral sample. This di-trioctahedral sample can undiscernibly correspond to two segregated smectite phases or to a mixture between trioctahedral and dioctahedral layers in the same smectite phase. The other bands observed in the OH bending zone were not easily assigned and were discussed below (see 4-4 paragraph).
SM0.33-800 sample was different from the SM0.33-200 one. On its XRD pattern, the (001)
reflection shifted to 9.5 Å after GK test (Fig. 2c) which was characteristic of the
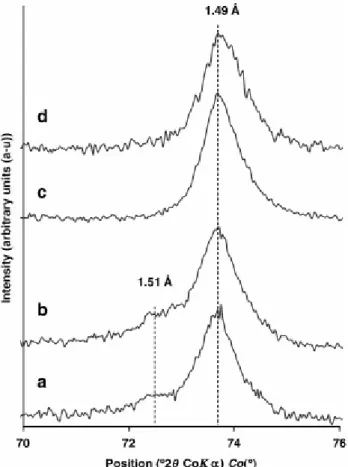
montmorillonite presence in the reacted product (Hofmann and Klemen, 1950). The (06.33) reflection band at 1.49 Å, characteristic of a dioctahedral structure, has a shoulder at 1.51 Å (Fig. 9b). This band at 1.51 Å, also identified in the SM0.33-200 sample (Fig. 9a), was
characteristic of the presence of a trioctahedral structure (Grauby et al., 1993). This
information was in accordance with the infrared data and the CEC results: presence of an (Al, Mg)−OH band at 850 cm− 1 in the OH bending zone (Fig. 3Bc) and significant decrease of the CEC value after GK test (Table 4). The chemical composition (Table 4) shows that for this sample, the di-trioctahedral character (beidellite and saponite phases), indicated by an
octahedral occupancy equal to 2.07 is less strong than for the SM0.33-200 sample (2.15). This
result was confirmed by the CEC measurement. A part of the CEC before GK test, remains after GK test (See Table 4 with CEC values equal to 104 and 42 meq/100 g respectively before and after GK test; 42/104 ≅ 40.4%).
SM0.33-1200 sample was characteristic of a montmorillonite phase containing a very small
amount of kaolinite. On the XRD pattern, the (001) reflection shifted to 9.5 Å after GK test (Fig. 2d) and the (06.33) band was symmetric and localized at 1.49 Å (Fig. 9c). Two bands, an (Al, Mg)−OH band at 850 cm− 1 and an (Al, Al)−OH band at 918 cm− 1, were identified in the infrared data of the (Cation, Cation)−OH bonds bending zone (Fig. 3Be). After lithium exchange and heating (GK test), a second maximum peak appeared at 3668 cm− 1 (Fig. 3Ad) and was assigned to a (Al, Mg, Li)−OH stretching vibration (Calvet and Prost, 1971). The chemical formula corresponds to a montmorillonite with mainly octahedral charge deficit, very low tetrahedral charge deficit and an octahedral occupancy near 2.00 (Table 4). The CEC measurement strongly decreased after lithium exchange and heating according to the decrease observed in the same conditions for natural reference montmorillonites. For example, in SAz-1 sample studied by Madejova et al. (2000), the CEC of the 200 °C heated sample reached 13% of the unheated sample CEC. In thermal analysis, the loss of interlayer H2O was
observed at temperatures lower than 200 °C (Fig. 1B) but the maximum loss of water arising from the dehydroxylation process was observed at 685 °C (Fig. 6b). These results are
comparable to the structural water maximum loss of SWy-2 sample (lower charged reference montmorillonite) identified by Guggenheim and Koster van Groos (2001) at 684 °C. All these results indicate that the synthesized product in SM0.33-1200 sample was a montmorillonite.
The results obtained for the SM0.33-2000 sample show a strong similarity with those of the
SM0.33-1200 one (Table 4). For pressures equal to or higher than 120 MPa and a temperature
4.2. Montmorillonites with different layer charge deficit
The product obtained with x = 0.25 (SM0.25-1200 sample) was a montmorillonite with
tetrahedral substitutions. The increase of the tetrahedral layer charge deficit of this sample by comparison with the starting gel phase one (Table 4) induced a silicon rich residual
amorphous phase and a lower yield of the synthesis compared to the experiment SM0.33-1200
(Table 4). This result shows the impossibility to synthesize high purity montmorillonite with a layer charge lower than 0.33 in these experimental conditions; x = 0.33 seems to be the
smallest layer charge deficit value accepted in a pure montmorillonite.
The products of the conducted experiments with a layer charge deficit higher than x = 0.33 show some differences with those of SM0.33-1200 sample. The layer charge deficits of the
synthesized smectite phases have increased for SM0.50-1200 and SM0.60-1200 samples with a
larger amount of octahedral Mg. But, as for SM0.25-1200 sample, aluminium is found in the
tetrahedral sheet and contributes to the total layer charge deficit. The values of the octahedral site occupancy (2,10 and 2,12 for SM0.50-1200 and SM0.60-1200 respectively, Table 4) indicate
the presence of di-trioctahedral domains in these samples which were also identified on the XRD patterns (band at 1.51 Å, Fig. 4c, d). These results show that the layer charge deficit can be increased; however, this deficit is not only localized in the octahedral sheet as in a pure montmorillonite but distributed between the octahedral and tetrahedral sheets.
A good purity montmorillonite (total deficit of charge in octahedral sheet) was obtained only for samples with a low charge deficit equivalent to 0.33 per half unit cell (SM0.33-1200
sample).
4.3. SM
0.33-1200 sample: a low charge montmorillonite?
In these experimental runs, a montmorillonite with a minor amount of associated mineral phases was only synthesized with a low charge (SM0.33-1200 sample). The chemical formula
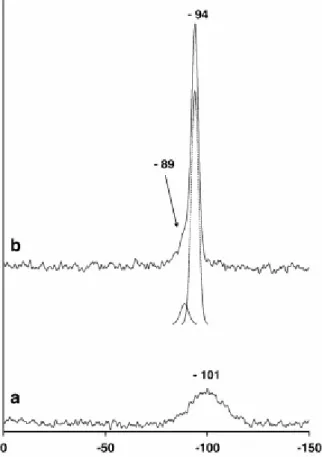
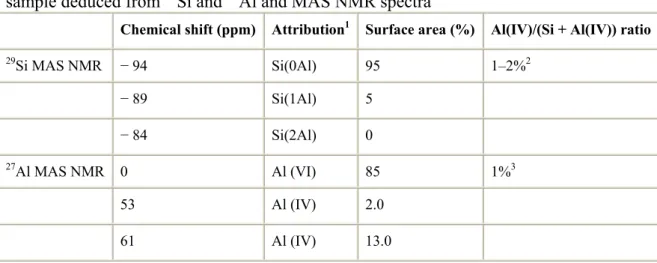
showed a very small amount of tetrahedral charges. This result can be confirmed by 27Al and 29Si MAS NMR analyses (Fig. 10 and Fig. 11). In the 29Si MAS NMR spectrum of SM
0.33
-1200 sample (Fig. 10b), a Si(0Al) sharp band associated to a small Si(1Al) one were observed at − 94 and − 89 ppm respectively. Silica residual amorphous phase can not be detected because of a very small signal detected for the initial amorphous phase (Fig. 10a). The amount of tetrahedrally coordinated Al in the clay framework of the SM0.33-1200 sample can be
estimated between 1 and 2% (Table 5) of the tetrahedral sites. In the 27Al MAS NMR
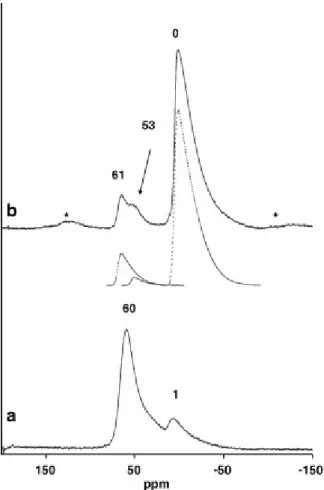
spectrum of SM0.33-1200 sample (Fig. 11b), one band characteristic of octahedral aluminium
near 0 ppm was identified; it was associated with two other bands at 53 and 61 ppm identified as aluminium tetrahedrally coordinated (Sanz and Serratosa, 1984 and Reinholdt et al., 2001). By comparison with the NMR spectrum of the starting amorphous phase (Fig. 11a), the band at 61 ppm can be associated with Al(IV) always present in the residual amorphous phase and the band at 53 ppm can be attributed to the presence of aluminium in the tetrahedral sheet of the synthetic smectite phase. Using this band attribution, the amount of Al tetrahedrally coordinated in the clay framework of the SM0.33-1200 sample can be estimated near 1%
(Table 5) of the tetrahedral sites in accordance with the quantification realized by 29Si MAS NMR and the chemical formula (Table 4).
The amount of residual amorphous phase is estimated between 10 and 15 wt.% and can be minimized but not totally avoided. Its minimum is estimated near 5 wt.% with a synthesis duration longer than 30 days (Fig. 8).
During the increase of temperature, the stability field of kaolinite (Kloprogge et al., 1993) is crossed and a little amount of this mineral is synthesized. The proportion of synthesized kaolinite was very low because no characteristic reflections were identified on the XRD patterns. Infrared spectroscopy technique has a better sensitivity for the kaolinite detection and it is possible to detect 5‰ weight ratio of kaolinite in smectite by the presence of a 3700 cm−1 band in the infrared spectrum (Joussein et al., 2001). In SM0.33-1200 sample,
kaolinite impurity was estimated to be around 1 wt.% (Fig. 3Ae).
4.4. Limits of the characterization techniques
Kloprogge et al. (1999) in their critical review, point out the limits of some studies in the synthetic clay domain due to a lack of complete characterization of the formed products. In this study, the use of multi-technique analyses permitted a fine characterization (microprobe analysis, CEC measurement, GK test, XRD, ATG, FTIR, 27Al and 29Si MAS NMR, TEM). Nevertheless, some characterization aspects are not very well clarified. The tetrahedral charges found in some synthesized samples (SM0.33-200, SM0.33-800, SM0.25-1200, SM050
-1200 and SM0.60-1200) can be assigned to the presence of tetrahedral substitutions in
montmorillonite or to the presence of a beidellite phase. The octahedral occupancies upper than two in four samples (SM0.33-200, SM0.33-800, SM0.50-1200 and SM0.60-1200) can be
associated with a trioctahedral phase such as saponite. These saponite and beidellite phases can be associated with the montmorillonite phase by interstratification or segregation. These two possible situations are of no consequences for the production of a pure montmorillonite but are to be considered in the study of the stability field of synthesized smectites.
5. Conclusion
Synthetic montmorillonites are very interesting materials both for scientific research and industrial applications because they are reproducible and homogeneous; they are then useful for systematic studies, contrary to the natural montmorillonite samples. Indeed, by
comparison with the most studied low charge reference natural montmorillonite (SWy-2), characterized in the Baseline Studies of the Clay Minerals Society Source Clays (Madejova and Komadel, 2001 and Chipera and Bish, 2001), the SM0.33-1200 sample can be considered
as a good reference sample with classical band positions on the XRD pattern and on the infrared spectrum (Fig. 2 and Fig. 3e and Be). The impurities identified in the SWy-2 sample (quartz, feldspar, gypsum, mica, illite) represent 25% of the raw sample and always 5% after purification by < 2 μm size fraction selection (Chipera and Bish, 2001). Moreover, in the structural formula of the SWy-2 sample, tetrahedral charge deficit and Fe octahedral cations were found ((1), Mermut and Faz Cano, 2001).
SWy-2: (Na0.14, Ca0.52, K0.01) (Si7.89, Al0.11) (Al3.23, Fe0.42, Mg0.56) O20(OH)4 (1)
The presence of iron in the structure of natural smectites can induce reactivities of these smectites such as the modification of the iron valence in reducing conditions (Stucki et al., 1984, Gates et al., 1993 and Gates et al., 1996), the easier deprotonation of iron smectites
(Heller-Kallai, 2001) or the reaction between iron rich clays and metallic iron (Lantenois,
2003 and Lantenois et al., 2005). In some cases, the possibility to use a montmorillonite without iron content can have an important scientific interest.
Other low charge montmorillonite samples were synthesized with a method developed by Reinholdt et al., 2001 and Reinholdt et al., 2005) in a slightly acidic and fluoride medium at low temperature and pressure (200 °C, P < 5 MPa). However, the ratio of synthesized crystallized phases was not given and the fluoride medium induces a fluorine partial integration in the montmorillonite structure.
The present study aimed to synthesize montmorillonites with different layer charge deficits to obtain a well-characterized reference smectites series. The experimental runs indicate that the pressure is an important factor. At 320 °C , a pressure fixed to 120 MPa is sufficient to synthesize only octahedrally charged smectites. The pressure decrease or the increase of Mg content induced a tetrahedral charge deficit formation and the apparition of di-trioctahedral sample. To optimize the synthesized smectite amount, a run duration of 30 days is needed. In these conditions, only low charge deficit montmorillonite (x = 0.33) could be synthesized (SM0.33-1200) with impurities and residual amorphous phases less than 3%.
Acknowledgments
P. Baillif, O. Rouer (ISTO-Orléans) and M.-P. Faugère, A. Pineau (CRMD-Orléans) are thanked for their assistance.
References
Calvet and Prost, 1971 R. Calvet and R. Prost, Cation migration into empty octahedral sites and surface properties of clays, Clays and Clay Minerals 19 (1971), pp. 175–186.
Carrado et al., 1997 K.A. Carrado, P. Thiyagarajan and K. Song, A study of organo-hectorite clay crystallization, Clay Minerals 32 (1997), pp. 29–40.
Chipera and Bish, 2001 S.J. Chipera and D.L. Bish, Baseline studies of the clay minerals society source clays: powder X-ray diffraction analyses, Clays and Clay Minerals 49 (2001), pp. 398–409.
Decarreau et al., 1987 A. Decarreau, D. Bonnin, D. Badaut-Trauth, R. Couty and P. Kaiser, Synthesis and cristallogenesis of ferric smectite by evolution of Si–Fe coprecipitates in oxidizing conditions, Clays and Clay Minerals 22 (1987), pp. 207–223.
Delevoye et al., 2003 L. Delevoye, J.-L. Robert and J. Grandjean, 23Na 2D 3QMAS NMR and
29Si, 27Al MAS NMR investigation of Laponite and synthetic saponites of variable interlayer
charge, Clay Minerals 38 (2003), pp. 63–69.
Farmer, 1974 V.C. Farmer, The infrared spectra of minerals, Monograph 4, Mineralogical Society, London (1974) 539 pp..
Gaboriau, 1991 Gaboriau, H., 1991. Interstratifiés smectite-kaolinite de l'Eure. Thesis, Université d'Orléans, 274 pp.
Gates, 2004 W.P. Gates In: J.T. Kloprogge, Editor, Infrared spectroscopy and the chemistry
of dioctahedral smectites in The Application of Vibrational Spectroscopy to Clay Minerals and Layered Double Hydroxides, CMS Workshop Lectures vol. 13, The Clay Minerals
Society, Aurora, CO (2004), pp. 125–168.
Gates et al., 1993 W.P. Gates, H.T. Wilkinson and J.W. Stucki, Swelling properties of microbially reduced ferruginous smectite, Clays and Clay Minerals 41 (1993), pp. 360–364. Gates et al., 1996 W.P. Gates, J.W. Stucki and R.J. Kirkpatrick, Structural properties of reduced Upton montmorillonite, Phys. Chem. Minerals 23 (1996), pp. 535–541. Grauby et al., 1993 O. Grauby, S. Petit, A. Decarreau and A. Baronnet, The beidellite-saponite series: an experimental approach, European Journal of Mineralogy 5 (1993), pp. 623–635.
Greene-Kelly, 1953 R. Greene-Kelly, Identification of montmorillonoids, Journal of Soil
Science 4 (1953), pp. 233–237.
Guggenheim and Koster van Groos, 2001 S. Guggenheim and A.F. Koster van Groos, Baseline studies of the clay minerals society source clays: thermal analysis, Clays and Clay
Minerals 49 (2001), pp. 433–443.
Hamilton and Henderson, 1968 D.L. Hamilton and C.M.B. Henderson, The preparation of silicate compositions by a gelling method, Mineralogical Magazine 36 (1968), pp. 832–838. Harward and Brindley, 1966 M.E. Harward and G.W. Brindley, Swelling properties of synthetic smectites in relation to lattice substitutions, Clays and Clay Minerals 13 (1966), pp. 209–222.
Heller-Kallai, 2001 L. Heller-Kallai, Protonation–deprotonation of dioctahedral smectites,
Applied Clay Science 20 (2001), pp. 27–38
Hofmann and Klemen, 1950 V. Hofmann and R. Klemen, Verlust der Austauschfähigkeit von Lithiumionen aus Bentonit durch Erhitzung, Zeitschrift für Anorganische und Allgemeine
Chemie 262 (1950), pp. 95–99.
Joussein et al., 2001 E. Joussein, S. Petit and A. Decarreau, Une nouvelle méthode de dosage des minéraux argileux en mélange par spectroscopie IR.C.R, Academic Science Earth and
Planetary Sciences 332 (2001), pp. 83–89.
Kloprogge et al., 1990 J.T. Kloprogge, J.B.H. Jansen and J.W. Geus, Characterization of synthetic Na-beidellite, Clays and Clay Minerals 38 (1990), pp. 409–414.
Kloprogge et al., 1993 J.T. Kloprogge, A.M.J. van der Eerden, J.B.H. Jansen, J.W. Geus and R.D. Schuiling, Synthesis and paragenesis of Na-beidellite as function of temperature, water pressure and sodium activity, Clays and Clay Minerals 41 (1993), pp. 423–430.
Kloprogge et al., 1999 J.T. Kloprogge, S. Komarneni and J.E. Amonette, Synthesis of smectite clay minerals: a critical review, Clays and Clay Minerals 47 (1999), pp. 529–554. Lantenois, 2003 Lantenois, S., 2003. Réactivité fer métal/smectites en milieu hydraté à 80 °C . Ph.D. thesis, Université d'Orléans, 188 pp.
Lantenois et al., 2005 S. Lantenois, B. Lanson, F. Muller, A. Bauer, M. Jullien and A. Plançon, Experimental study of smectite interaction with metal Fe at low temperature: 1,
Smectite destabilization. Clays and Clay Minerals 53 (2005), pp. 597–612
Levinson and Vian, 1966 A.A. Levinson and R.W. Vian, The hydrothermal synthesis of montmorillonite group minerals from kaolinite, quartz and various carbonates, American
Mineralogist 51 (1966), pp. 495–498.
Levinson and Day, 1968 A.A. Levinson and J.J. Day, Low temperature hydrothermal synthesis of montmorillonite, ammonium-micas and ammonium-zeolites, Earth and
Planetary Science Letters 5 (1968), pp. 52–54.
Lim and Jackson, 1986 C.H. Lim and M.L. Jackson, Expandable phyllosilicate reactions with lithium on heating, Clays and Clay minerals 34 (1986), p. 346–342.
Madejova, 2003 J. Madejova, FTIR techniques in clay mineral studies, Vibrational
Spectroscopy 31 (2003), pp. 1–10.
Madejova and Komadel, 2001 J. Madejova and P. Komadel, Baseline studies of the clay minerals society source clays: Infrared methods, Clays and Clay Minerals 49 (2001), pp. 410– 432.
Madejova et al., 2000 J. Madejova, J. Bujdak, S. Petit and P. Komadel, Effects of chemical composition and temperature of heating on the infrared spectra of Li-saturated dioctahedral smectites. (I) Mid-infrared region, Clay Minerals 35 (2000), pp. 739–751.
Mermut and Faz Cano, 2001 A.R. Mermut and A. Faz Cano, Baseline studies of the clay minerals society source clays: chemical analyses of major elements, Clays and Clay Minerals
49 (2001), pp. 381–386.
Nakazawa et al., 1991 H. Nakazawa, H. Yamada, K. Yoshioka, M. Adachi and T. Fujita, Montmorillonite crystallization from glass, Clay Science 8 (1991), pp. 59–68.
Pelletier et al., 1999 M. Pelletier, L.J. Michot, O. Barrès, B. Humbert, S. Petit and J.L. Robert, Influence of KBr conditioning on the infrared hydroxyl-stretching region of saponites, Clay
Minerals 34 (1999), pp. 439–445.
Qi et al., 1996 Y. Qi, M. Al-Mukhtar, J.-F. Alcoverm and F. Bergaya, Coupling analysis of macroscopic and microscopic behaviour in highly consolidated Na-laponite clays, Applied
Clay Science 11 (1996), pp. 185–197.
Reinholdt et al., 2001 M. Reinholdt, J. Miehé-Brendlé, L. Delmotte, M.-H. Tuilier, R. Le Dred, R. Cortès and A.-M. Flank, Fluorine route synthesis of montmorillonites containing Mg
or Zn and characterization by XRD, Thermal Analysis, MAS NMR and EXAFS spectroscopy,
European Journal of Inorganic Chemistry (2001), pp. 2831–2841.
Reinholdt et al., 2005 M. Reinholdt, J. Miehé-Brendlé, L. Delmotte, R. Le Dred and M.-H. Tuilier, Synthesis and characterization of montmorillonite-type phyllosilicates in a fluoride medium, Clay Minerals 40 (2005), pp. 177–189.
Roux and Volfinger, 1996 J. Roux and M. Volfinger, Mesures précises à l'aide d'un détecteur courbe, Journal de Physique IV (1996), pp. 127–134.
Roy and Sand, 1956 R. Roy and L.B. Sand, A note on some properties of synthetic montmorillonites, American Mineralogist 41 (1956), pp. 505–509.
Sand et al., 1953 L.B. Sand, R. Roy and E.F. Osborn, Stability relations of some minerals in the system Na2O–Al2O3–SiO2-H2O, Bulletin of the Geological Society of America 64 (1953),
pp. 1469–1470.
Sand et al., 1957 L.B. Sand, R. Roy and E.F. Osborn, Stability relations of some minerals in the Na2O-Al2O3–SiO2–H2O system, Economic Geology 52 (1957), pp. 169–179.
Sanz and Serratosa, 1984 J. Sanz and J.M. Serratosa, 29Si and 27AL High-Resolution MAS-NMR Spectra of Phyllosilicates, Journal of American Chemical Society 106 (1984), pp. 4790–4793.
Stucki et al., 1984 J.W. Stucki, D.C. Golden and C.B. Roth, Effects of reduction and reoxidation of structural Fe on the surface charge and dissolution of dioctahedral smectites,
Clays and Clay Minerals 32 (1984), pp. 350–356.
Suquet et al., 1977 H. Suquet, J.T. Iiyama, H. Kodama and H. Pezerat, Synthesis and swelling properties of saponites with increasing layer charge, Clays and Clay Minerals 25 (1977), pp. 231–242.
Suquet et al., 1982 H. Suquet, R. Prost and H. Pezerat, Etude par spectroscopie infrarouge et diffraction X des interactions eau-cation-feuillet dans les phases à 14.6, 12.2 et 10.1 Å d'une saponite-Li de synthese, Clay Minerals 17 (1982), pp. 231–241.
Yamada et al., 1991 H. Yamada, H. Nakazawa, K. Yoshioka and T. Fujita, Smectites in the montmorillonite-beidellite series, Clay Minerals 26 (1991), pp. 359–369.
Yamada et al., 1994a H. Yamada, H. Nakazawa and H. Hashizume, Formation of smectite crystals at high pressures and temperatures, Clays and Clay Minerals 42 (1994), pp. 674–678. Yamada et al., 1994b H. Yamada, H. Nakazawa, H. Hashizume, S. Shimomura and T.
Watanabe, Hydration behaviour of Na-smectite crystals synthesized at high pressure and high temperature, Clays and Clay Minerals 42 (1994), pp. 77–80.
Figures
Fig. 1. TG and DTG curve of GM0.33 starting gel phase (A) and SM0.33-1200 sample (B). Δm
corresponds to the mass loss of structural OH in smectite clay.
Fig. 2. XRD patterns of GM0.33 starting gel phase (a) and synthetic SM0.33 sample in natural
state and after GK test (upper and lower patterns respectively) at various synthesis pressures. (b) SM0.33-200, (c) SM0.33-800, (d) SM0.33-1200 and (e) SM0.33-2000. The (00ℓ) reflections
(dashed lines) and the (02,11) and the (20,13) bands of smectites are labelled. K indicates the presence of formed kaolinite phase in some samples (dotted lines).
Fig. 3. Infrared spectra of synthetic SM0.33 sample at various synthesis pressures in the OH
stretching zone (A) and in the OH bending zone (B). (a) Amorphous GM0.33 phase, (b) SM0.33
-200, (c) SM0.33-800, (d) SM0.33-1200 after GK test, (e) SM0.33-1200 and (f) SM0.33-2000.
Smectite OH vibration bands are labelled (dashed lines).
Fig. 4. XRD patterns of synthetic montmorillonite with various layer charges. (a) SM0.25
-1200, (b) SM0.33-1200, (c) SM0.50-1200 and (d) SM0.60-1200. The (00ℓ) reflections and the
(02,11), (20,13) and (06,33; dashed lines) bands of smectites are labelled. Scale factor (x4) over the 70–78°2θ CoKα range.
Fig. 5. Infrared spectra of synthetic montmorillonites with various layer charges in the OH stretching zone (A) and in the OH bending zone (B). (a) SM0.25-1200, (b) SM0.33-1200, (c)
SM0.50-1200 and (d) SM0.60-1200. Smectite OH vibration bands are labelled (dashed lines).
Fig. 6. DTG curve of synthetic montmorillonites with various layer charges in the 550–800 °C temperature range. (a) SM0.25-1200, (b) SM0.33-1200, (c) SM0.50-1200 and (d) SM0.60-1200.
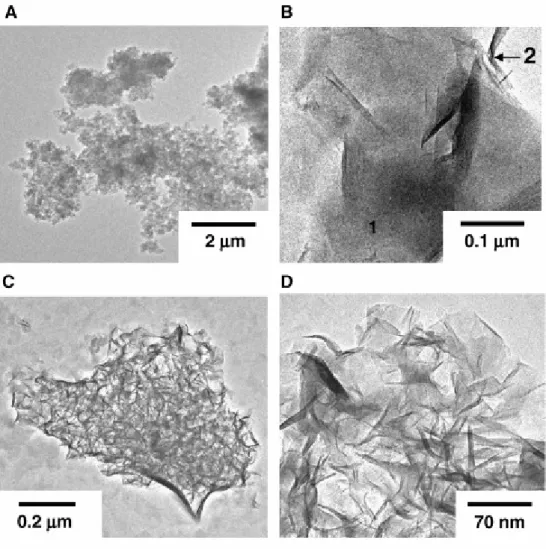
Fig. 7. TEM images of SM0.33 samples. (A) Amorphous phase GM0.33 before hydrothermal
synthesis. (B) Residual amorphous phase (1) and neoformed smectite particles (2) in SM0.33
-1200 sample after 15 days run time. (C) and (D) smectite particles in SM0.33-1200 sample
after 30 days run duration and in the < 2 μm size fine fraction respectively.
Fig. 8. Relative proportion of formed smectite phase (wt.%) after hydrothermal synthesis in SM0.33 sample at 1200 bars as a function of run duration. Relative proportion of formed
Fig. 9. XRD patterns of synthetic SM0.33 sample in natural state at various synthesis pressures
in the 70–76°2θ CoKα range. (a) SM0.33-200, (b) SM0.33-800, (c) SM0.33-1200 and (d) SM0.33
Fig. 10. 29Si MAS NMR spectra and corresponding decomposition of synthetic SM0.33-1200
Fig. 11. 27Al MAS NMR spectra and corresponding decomposition of synthetic SM
0.33-1200
sample (b) and starting amorphous phase GM0.33 (a). corresponds to spinning sidebands.
Tables
Table 1. : Chemical composition (in oxide weights normalised to 100%) of starting gel phases measured by ICP-AES Sample GM0.25 GM0.33 GM0.50 GM0.60 x value 0.25 0.33 0.50 0.60 SiO2 68.6 68.9 67.4 67.6 Al2O3 26.4 24.5 22.6 20.8 Fe2O3 0.0 0.0 0.0 0.0 MgO 3.0 4.0 6.0 6.9 Na2O 2.0 2.6 4.0 4.7
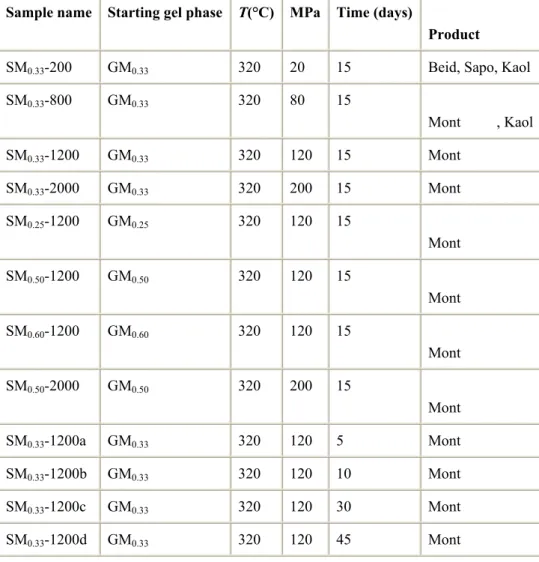
Table 2. : Experimental conditions and reaction products of all experiments
Sample name Starting gel phase T(°C) MPa Time (days)
Product
SM0.33-200 GM0.33 320 20 15 Beid, Sapo, Kaol
SM0.33-800 GM0.33 320 80 15 Mont , Kaol SM0.33-1200 GM0.33 320 120 15 Mont SM0.33-2000 GM0.33 320 200 15 Mont SM0.25-1200 GM0.25 320 120 15 Mont SM0.50-1200 GM0.50 320 120 15 Mont SM0.60-1200 GM0.60 320 120 15 Mont SM0.50-2000 GM0.50 320 200 15 Mont SM0.33-1200a GM0.33 320 120 5 Mont SM0.33-1200b GM0.33 320 120 10 Mont SM0.33-1200c GM0.33 320 120 30 Mont SM0.33-1200d GM0.33 320 120 45 Mont
Note: *crystallised phases identified by XRD. Beid, Sap, Mont and Kaol correspond to beidellite, saponite, montmorillonite and kaolinite clay phases respectively. Presence of tetrahedral charge deficits and trioctahedral domains (identified by chemical analysis). Table 3. : Relevant parameters of the solid-state NMR investigation for 27Al and 29Si nuclei
Nuclei ν (MHz) Reference T pulse (μs) θ (°) trec. (s) Spinning rate (KHz)
29Si 59.62 TMS 2.25 90 10 5
27Al 78.20 Al(NO
3)3 aq. 4.0 30 1 10
ν — operating frequency, T pulse — pulse length, θ — pulse angle, trec. — recycle time, TMS
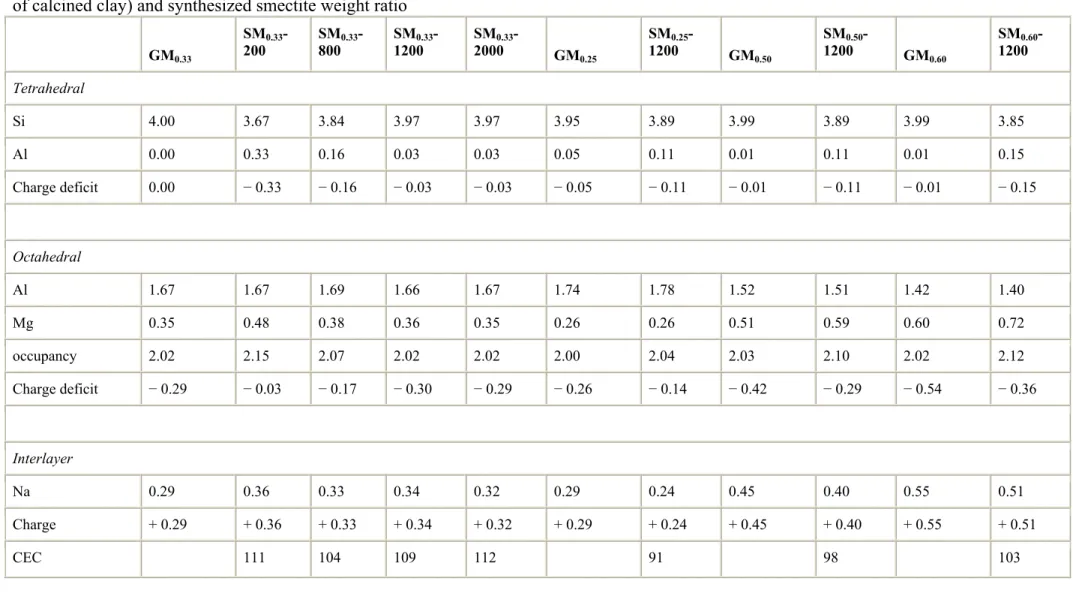
Table 4. : Chemical composition of the synthetic smectites (structural formulae calculated per O10(OH)2), cation exchange capacity (meq/100 g of calcined clay) and synthesized smectite weight ratio
GM0.33 SM0.33 -200 800SM0.33- SM12000.33- SM20000.33- GM0.25 1200SM0.25- GM0.50 SM12000.50- GM0.60 SM12000.60 -Tetrahedral Si 4.00 3.67 3.84 3.97 3.97 3.95 3.89 3.99 3.89 3.99 3.85 Al 0.00 0.33 0.16 0.03 0.03 0.05 0.11 0.01 0.11 0.01 0.15 Charge deficit 0.00 − 0.33 − 0.16 − 0.03 − 0.03 − 0.05 − 0.11 − 0.01 − 0.11 − 0.01 − 0.15 Octahedral Al 1.67 1.67 1.69 1.66 1.67 1.74 1.78 1.52 1.51 1.42 1.40 Mg 0.35 0.48 0.38 0.36 0.35 0.26 0.26 0.51 0.59 0.60 0.72 occupancy 2.02 2.15 2.07 2.02 2.02 2.00 2.04 2.03 2.10 2.02 2.12 Charge deficit − 0.29 − 0.03 − 0.17 − 0.30 − 0.29 − 0.26 − 0.14 − 0.42 − 0.29 − 0.54 − 0.36 Interlayer Na 0.29 0.36 0.33 0.34 0.32 0.29 0.24 0.45 0.40 0.55 0.51 Charge + 0.29 + 0.36 + 0.33 + 0.34 + 0.32 + 0.29 + 0.24 + 0.45 + 0.40 + 0.55 + 0.51 CEC 111 104 109 112 91 98 103
GM0.33 SM0.33 -200 800SM0.33- SM12000.33- SM20000.33- GM0.25 1200SM0.25- GM0.50 SM12000.50- GM0.60 SM12000.60 -CEC (GK)1 81 42 8 10 22 25 39 Smectite formed (wt.%)2 75 80 87 86 77 84 81
Notes: *theoretical formula calculated using chemical analysis in Table 1. 1CEC measurement after Green-Kelly test. 2Determinated using OH mass deficit in TGA measurement.
Table 5. : Chemical shifts, surface area and tetrahedral Al/(Al + Si) ratio of SM0.33-1200
sample deduced from 29Si and 27Al and MAS NMR spectra
Chemical shift (ppm) Attribution1 Surface area (%) Al(IV)/(Si + Al(IV)) ratio
29Si MAS NMR − 94 Si(0Al) 95 1–2%2 − 89 Si(1Al) 5 − 84 Si(2Al) 0 27Al MAS NMR 0 Al (VI) 85 1%3 53 Al (IV) 2.0 61 Al (IV) 13.0