Publisher’s version / Version de l'éditeur:
Clays and Clay Minerals, 41, 3, pp. 341-345, 1993-06
READ THESE TERMS AND CONDITIONS CAREFULLY BEFORE USING THIS WEBSITE. https://nrc-publications.canada.ca/eng/copyright
Vous avez des questions? Nous pouvons vous aider. Pour communiquer directement avec un auteur, consultez la première page de la revue dans laquelle son article a été publié afin de trouver ses coordonnées. Si vous n’arrivez pas à les repérer, communiquez avec nous à [email protected].
Questions? Contact the NRC Publications Archive team at
[email protected]. If you wish to email the authors directly, please see the first page of the publication for their contact information.
NRC Publications Archive
Archives des publications du CNRC
This publication could be one of several versions: author’s original, accepted manuscript or the publisher’s version. / La version de cette publication peut être l’une des suivantes : la version prépublication de l’auteur, la version acceptée du manuscrit ou la version de l’éditeur.
Access and use of this website and the material on it are subject to the Terms and Conditions set forth at
Characterization of colloidal solids from Athabasca fine tails
Kotlyar, L. S.; Deslandes, Y.; Sparks, B. D.; Hodama, H.; Schutte, R.
https://publications-cnrc.canada.ca/fra/droits
L’accès à ce site Web et l’utilisation de son contenu sont assujettis aux conditions présentées dans le site LISEZ CES CONDITIONS ATTENTIVEMENT AVANT D’UTILISER CE SITE WEB.
NRC Publications Record / Notice d'Archives des publications de CNRC:
https://nrc-publications.canada.ca/eng/view/object/?id=c248cc45-a31c-4938-b233-18d323e6fa7c
https://publications-cnrc.canada.ca/fra/voir/objet/?id=c248cc45-a31c-4938-b233-18d323e6fa7c
C H A R A C T E R I Z A T I O N OF C O L L O I D A L SOLIDS F R O M
A T H A B A S C A FINE TAILS l
L. S. KOTLYAR, 2 Y. DESLANDES, B. D. SPARKS, H. KODAMA, 3 AND R. SCHUTTE 4 National Research Council of Canada, Institute for Environmental Chemistry
M-12, Montreal Road, Ottawa, Ontario, Canada K1A OR9 3 Centre for Land and Biological Resources Research
4 Research Department of Syncrude Ltd.
Abstract--During processing of Athabasca oil sands, the finely divided solids form an aqueous suspension, which ultimately stabilizes as a gel-like structure retaining up to 90% of the process water. This gelling phenomenon is believed to be caused by colloidal inorganic components. Kaolinite and mica are the main crystalline minerals in these colloidal solids; swelling clays are present in only trace amounts. Non- crystalline components are more concentrated in the finer fraction of the solids. Although the surfaces of the colloidal solids are virtually free of Fe, some contamination with polar organic matter is observed. Key Words--Fine tails, Hydrophilic, Colloidal solids.
I N T R O D U C T I O N
The Hot Water Extraction process is presently used in Alberta to extract b i t u m e n from oil sands. In this process the b i t u m i n o u s sand is mixed with steam and hot water to which a small a m o u n t of sodium hydrox- ide has been added. After the separation of b i t u m e n by flotation, the remaining tailings are p r e d o m i n a n t l y an aqueous slurry of sand, silt, clay and a m i n o r a m o u n t of bitumen. The slurry is transported to sedimentation ponds where the solid particles are allowed to settle out and clean water is separated for recycling to the extraction process. Some coarse sand and silt are used to form the dykes surrounding the tailings pond, while the remainder of the tailings is discharged to form a beach. A b o u t one half of the silt a n d clay a n d almost all the b i t u m e n r e m a i n in suspension and flow to the centre of the p o n d to form a gel-like system (fine tails) with very poor settling and compaction rates. Toxicity, loss o f b i t u m e n , diluent naphtha and process water are a m o n g the problems associated with the buildup of these fine tails (Camp, 1977).
It has been demonstrated (Kotlyar et al., 1991) that the unusual properties of the fine tails could be attrib- uted to the presence of colloidal (-< 1 ~tm) inorganic components. These components readily form gels (Ripmeester et al., 1992) within which coarse particles may be embedded. For gel formation to occur, an ap- propriate c o m b i n a t i o n o f colloidal solids ( a m o u n t a n d particle size) and water chemistry (salt concentration) are needed (Kotlyar et al., 1992).
The objective of the present study was to determine
l Issued as NRC #32959.
2 To whom correspondence should be addressed. Copyright 9 1993, The Clay Minerals Society
the chemical and mineralogical characteristics of the colloidal solids that are responsible for the gel forming propensity. This knowledge is of a great importance as it relates to the question of the mechanism ofgelation. By understanding the m e c h a n i s m it will be possible to propose fine tails reduction methods for industrial use.
E X P E R I M E N T A L M E T H O D S
The fine tails sample was supplied by Suncor Inc. Average samples contained 23.6 wt. % solids and 1.8 wt. % b i t u m e n with the remainder being water con- taining dissolved organic and inorganic species. Separation
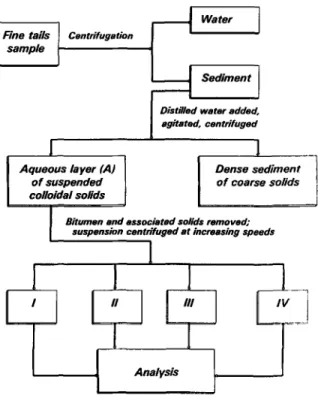
The colloidal solids were separated from the fine tails sample using the sequence o f procedures as illustrated in Figure 1. First, excess water, containing dissolved salts, was removed from the samples by centrifugation at 1500 g for 2 hours. Distilled water was then added to the sediment and the mixture agitated. This caused deflocculation of the colloidal solids a n d release of any entrapped materials. Mild centrifugation (200 g, 10 min) was then applied to separate a dense sediment o f coarse solids from an aqueous layer (A), containing the suspended colloidal solids. Layer A contains b i t u m e n a n d closely associated solids. These c o m p o n e n t s were removed by floatation with toluene. Sequential cen- trifugation at progressively higher speeds was used to subdivide the colloidal solids into the following frac- tions: I (200 g for 1 hour); II (500 g for 2 hours); III (1500 g for 2 hours); and IV (unsettled at 1500 g). The information in parenthesis defines the separation con- ditions used. Average particle sizes of these fractions were determined by electron microscopy and are given in Table 1.
342 Kotlyar et al. Clays and Clay Minerals Table 1. Solids distribution and properties of colloidal solids
fractions. W e i g h t loss as a result A v e r a g e S o l i d s o f T i r o n particle d i s t r i b u t i o n , ~ IOCC, t r e a t m e n t , 2 S a m p l e szze, n m w t % w t % w t % I 400 35.0 0.5 2.9 II 200 25.0 0.9 10.2 III 100 22.4 1.0 n.a. IV 50 17.6 2.0 29.0
Wt % of total colloidal solids (bitumen free, dry basis). 2 The amount of non-crystalline material in the correspond- ing fraction.
n.a. = not available. Analysis
Total C was determined using a LECO CR12 C an- alyzer. The insoluble organic C content (IOCC) was obtained by subtracting carbonate C from the total C. X-ray diffraction analysis was performed on powder specimens i n two ways: i n r a n d o m m o u n t s for the de- t e r m i n a t i o n of whole sample mineral composition, and with preferred orientation for characterizing phyllosili- cates. For the r a n d o m m o u n t , approximately 100-250 mg of air-dried sample was gently packed by back- loading in a Plexiglas | sample holder. For preferred orientation mounts, 30 mg of sample was suspended in 1 ml of water (for samples air-dried and heated at 550~ a n d i n 1 ml of 2% glycerol aqueous solution (for samples solvated with glycerol). Sub-samples were pi- petted onto glass slides (30 m m x 25 m m ) and allowed to air dry. The samples were analyzed using a Scintag P A D V diffractometer with Co radiation and a graphite monochromator.
The selective chemical dissolution method with al- kaline Tiron (1,2-dihydroxybenzene-3,5 -disulfonic acid disodium salt; K o d a m a a n d Jaakkimainen, 1982) was applied to extract non-crystalline c o m p o n e n t s from the samples. The weight loss during extraction was as- sumed to represent the a m o u n t of these components. The morphology o f the clay particles was investi- gated by TEM. For these observations, a drop of the suspended sample, after sonication for 1 minute, was deposited on a carbon coated copper grid. After 1 m i n - ute, the liquid was blotted to leave only a thin layer which was then allowed to dry. The grid was then examined with a Carl Zeiss Model 902 TEM, operated at 80 kV.
For X-ray photoelectron spectroscopy (XPS) mea- surements, drops of the suspension were spread over a clean glass slide and allowed to air dry. The dried solids were then scraped off the glass with a razor blade and pressed onto a piece o f I n foil. XPS spectra were recorded using a P H I 5500 I n s t r u m e n t using AI K a as the source of X-rays. The pressure inside the instru- m e n t during analysis was always below 8 x 10 -9 tOIT. A n electron flood gun was used to neutralize the charge
Fine tails
sample
r
CentrifugetionI Water
Aqueous layer (,4)
Sediment
J Distilled water adder
agitated, centrifuged
1
1
_
Dense sediment
of suspended
of coarse solids
colloidal solids
Bitumen and associated solids removed; suspension centrifuged at increasing speeds
1
Analysis
Figure 1. Treatment scheme for fine tails.
developing at the surface of the sample during the re- cording of the spectra. High resolution spectra were obtained at a pass energy of 29.6 electron-volt (ev). Survey spectra were recorded at a pass energy of 156 ev. Several repetitions were made to assure repeat- ability of the results. These spectra were used to cal- culate the atomic fraction o f the element i using the software supplied with the equipment, based on the formula
Ci = (Ii/Si)/~(Ij/Sj)
where I is the area under a spectral peak and S is the sensitivity factor (Muilenberg, 1979). Values of 0.296, 0.711, 0.252, 0.870, 0.213 and 1.791, suggested by the i n s t r u m e n t manufacturer, were used for the sensitivity factors o f C l s , O l s , Si2p, K2p, A12s and Fe2p3.
29Si MAS N M R spectra (spinning rates 3.5 kHz) were recorded at 59.62 MHz o n a Bruker MSL-300 N M R spectrometer (magnetic field 7.1 T). A b o u t 8000 free induction decays (FIDs) were accumulated, with the repetition time being 2 s. Chemical shifts are given in p p m with respect to tetramethylsilane (TMS).
RESULTS A N D D I S C U S S I O N
The average particle size, wt % solids, insoluble or- ganic C content, and weight loss due to T i r o n extraction (IOCCs) of the colloidal solids fractions are shown in Table 1. The IOCCs were relatively low in all cases; some increase with decrease in particle size was ob- served.
d-spacing (nm)
1.4
0.33
1.8 1.0 0.72
0.5
0.36
, I ... , , , / ISAMPLE I
CPS
6 8 01
SAMPLE
ilCPS
162.5
1
L__
SAMPLE IV
CPS
I I I I 1 0 I I I I [ I I I I 2 0 ( ~ CoKt~)I ' ' ' ' 1
30
40
Figure 2. XRD spectra of glycerolated samples I (400 nm fraction), II (200 nm fraction), and IV (50 nm fraction) of the colloidal solids.
2'%~+"~"
A
+jA +3
,,fA
12~ ~
III
I
I
1
I
I
1
- 7 0 - 8 0 - 9 0 -100 -110 -120 -130 p p mFigure 3. 29Si MAS NMR spectra of the samples II (200 nm fraction), III (100 nm fraction) and IV (50 nm fraction) of colloidal solids.
X-ray diffraction
X-ray diffraction data indicated that for all the frac- tionated samples analyzed the major crystalline com- ponents were kaolinite and mica. I n addition, trace a m o u n t s of smectite a n d vermiculitic minerals were detected in sample IV (Figure 2). The intensity o f dif- fraction by crystalline c o m p o n e n t s decreased with de- crease in particle size (Figure 2) while the relative in- tensity of mica appeared to increase. U n d e r the experimental conditions employed, the intensity factor ratio--1 n m mica peald0.72 n m kaolinite p e a k - - w a s 1.0/1.4 (unpublished data), so relative quantities of mica to kaolinite were 0.5, 0.9 and 1.8 for samples I, II and IV, respectively. Also, the a m o u n t of non-crys- talline material increased for the finer particles as ev- idenced by the X R D patterns of r a n d o m m o u n t s (not shown) which exhibited high background levels a n d two h u m p s with very broad m a x i m a near 0.7 and 0.4 nm. The X R D pattern for sample IV was similar to that of kaolinite ground for 144 hours ( K o d a m a
et aL,
1989). The increase in the a m o u n t of non-crystaUine components with decrease in particle size was con- firmed by the results for the T i r o n extraction (Table
1).
29Si N M R
The 295i N M R patterns are shown on Figure 3. All spectra exhibited resonances i n the range from - 8 0 to - 110 ppm, which is typical for aluminosilicates (Ma- ciel and Sindorf, 1980). The spectra were centered at about - 9 2 p p m (characteristic for kaolinite) but were obviously broader than expected, indicating a disor-
344 Kotlyar et al. Clays and Clay Minerals Table 2. Atomic percentages determined by X-ray photo- electron spectroscopy of colloidal solids.
A t o m i c % S a m p l e C O Si AI K F e Si/AI I 8.7 62.4 16.7 11.1 1.0 0.2 1.5 II 11.1 62.4 14.8 10.7 1.0 0.2 1.4 III 13.7 59.1 15.2 11.1 0.9 0.2 1.4 IV 13.5 60.7 16.1 9.0 0.7 0.3 1.8
Figure 4. TEM of the samples I (400 nm fraction) and IV (50 nm fraction) of colloidal solids.
O l s (a) C l s AI2s Si2p K2p , 4. S i 2 s ~ \ ~ AI2p ~-~ i F .... 900 800 700 600 5~10 400 300 200 100
io~
(b)
C_-O K2p3,~ \ / k .c=o V;- \
K2p'12 / \ O-- ~ : \3~- 2
2;4
ii"'"2~
~o
Binding
Energy ( eY )
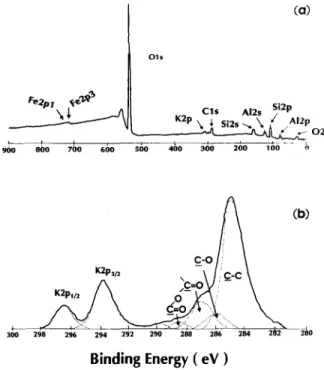
Figure 5. Surface characterization of the colloidal solids: a) XPS survey spectrum and b) deconvolution of carbon XPS peak of sample IV (50 nm fraction).
dered e n v i r o n m e n t (Kodama, et al., 1989). The peak width at half-height was used as a quantitative param- eter to characterize the degree of broadness of the res- onances. These measurements also demonstrated an increasing non-crystalline character with decreasing particle size.
Transmission electron microscopy
Typical transmission electron micrographs are shown in Figure 4. The particles were small and platy; a few were hexagonal, although the morphology of most was irregular. The average particle sizes were in the range of 50 n m to 400 n m , Table 1.
Surface characterization o f colloidal solids by X P S A typical XPS survey spectrum of the colloidal solids (results for subfraction IV) is shown in Figure 5a. The spectrum shows a surface d o m i n a t e d by oxygen atoms with a contribution from C, A1 a n d Si atoms. Small quantities of K and Fe were also detected. The atomic concentration (atomic %) of these elements for all four fractions, are tabulated in Table 2. The chemical com- position of the surface for each of the fractions was similar. There seemed to be a slight increase in C con- tent as particle size decreased, balanced by a corre- sponding decrease in O. The Si and A1 signals were relatively constant, suggesting that the thickness and morphology of the layer of carbonaceous materials at the surface was similar for all samples. The K and Fe content at the surface was below 1%.
For organic materials, XPS provides information for a surface layer about 7.5 n m thick (Bhatia et al., 1988). Therefore, this technique alone c a n n o t differentiate be- tween organic matter present as either a uniform thin layer completely covering particle surfaces, or discon- tinuous, patchy coatings of organic matter, where clay minerals are partially exposed. Information about this i m p o r t a n t aspect of sample characterization may be obtained by secondary ion mass spectrometry (SIMS), and such a study is currently underway.
One interesting result highlighted by the XPS data was the Si/A1 ratio of about 1.5, which is higher t h a n the expected ratio for kaolinite and mica (Si/AI ~ 1). This suggests that the particle surfaces are covered by non-crystalline, silicon rich coatings.
Figure 5b shows an example of the deconvolution of the C 1 s peak envelope into different functionalities.
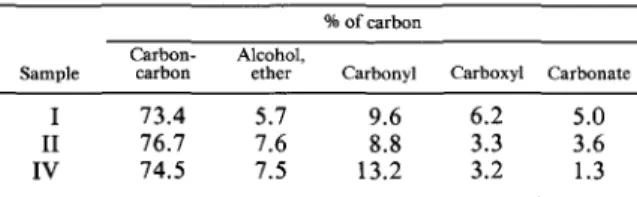
Table 3. Carbon distribution results by deconvolution of the Cls peak.
% of carbon Carbon- Alcohol,
Sample carbon ether Carbonyl Carboxyl Carbonate
I 73.4 5.7 9.6 6.2 5.0
II 76.7 7.6 8.8 3.3 3.6
IV 74.5 7.5 13.2 3.2 1.3
The relative a m o u n t s of the C-containing c o m p o n e n t s were calculated a n d are listed in Table 3. It should be pointed out that, because of the complex chemical na- ture of the material, the envelope is rather broad. Con- sequently, the deconvoluted spectra should be consid- ered as semi-quantitative only. However, we believe that the data clearly supports the conclusion that the organic matter is relatively polar because the quantity of C atoms linked to O atoms accounted for 20 to 25% of the total C signal. This information is of interest as nature of organic matter can be an i m p o r t a n t factor effecting gel formation.
C O N C L U S I O N S
Kaolinite and mica, with average particle sizes in the range of 50 to 400 n m , are the m a i n crystalline com- ponents of the colloidal solids present in oil sand fine tails. The a m o u n t of non-crystalline material increases with decrease in particle size. The surfaces of the col- loidal solids are contaminated with relatively polar or- ganic matter.
A C K N O W L E D G M E N T S
This work was performed u n d e r the Sludge F u n d a - mentals Consortium Agreement. Participants: Alberta Energy, E n v i r o n m e n t Canada, Alberta Oil Sands Tech- nology and Research Authority, Alberta Research
Council, Energy Mines and Resources (CANMET), The National Research Council, Suncor, Inc., and Syncrude Canada Ltd.
REFERENCES
Bhatia, Q. S., Pan, D. H., and Koberstein, J.T. (1988) Pref- erential surface adsorption in miscible blends of polystyrene and polyvinylmethylether: Macromolecules 21, 2166. Camp, F.W. (1977) Processing Athabasca tar sand tailings
disposal: Proc. Syrup. on Tar Sands, 26th Can. Chem. Eng. Conf., Toronto, Paper 9a.
Kodama, H. and Jaakkimainen, M. (1982) A comparative study of selective chemical dissolution methods for sepa- rating non-crystalline components produced by grinding of silicates: in Proc. Int. Clay Conf., Bologna, Pavia, 1981, H. van Olphen and F. Veniale, eds., Elsevier, Amsterdam, 399--410.
Kodama, H., Kotlyar, L. S., and Ripmeester, J. A. (1989) Quantification of crystalline and non-crystalline material in ground kaolinite by X-ray powder diffraction, infrared, solid-state nuclear magnetic resonance and chemical dis- solution analysis: Clays & Clay Minerals 4, 364-370. Kotlyar, L. S., Majid, A., and Sparks, B. D. (1991) A study
of factors affecting the stability of railings sludge produced by the hot water bitumen extraction process: Petroleum Society of CIM and AOSTRA, Banff, Alberta, Canada 91- 117.
Kotlyar, L. S., Lynds, M. M., Sparks, B. D., Schutte, R., and Woods, J. R. (1992) Colloidal solids from sludge: Effect of particle size on gel forming propensity in distilled and pond water: in Sludge Fundamentals Consortium Internal
NRC Report No. EC-1243-92S, Ottawa, Ontario, Canada.
Maciel, G. and Sindorf, D. (1980) Silicon-29 nuclear mag- netic resonance study of the surface silica gel by cross po- larization and magic angle spinning: J. Am. Chem. Soc. 102, 7606-07.
Muilenberg, G. E., ed., (1979) Handbook of X-ray Photoe-
lectron Spectroscopy: Perkin-Elmer Corporation, Eden
Prairie, Minnesota.
Ripmeester, J. A., Kotlyar, L. S.,and Sparks, B. D. (1992 2H NMR and the sol-gel transition in suspensions of colloidal clays: Colloids and Surfaces (in press).