HAL Id: hal-00297543
https://hal.archives-ouvertes.fr/hal-00297543
Submitted on 13 Mar 2006
HAL is a multi-disciplinary open access
archive for the deposit and dissemination of
sci-entific research documents, whether they are
pub-lished or not. The documents may come from
teaching and research institutions in France or
abroad, or from public or private research centers.
L’archive ouverte pluridisciplinaire HAL, est
destinée au dépôt et à la diffusion de documents
scientifiques de niveau recherche, publiés ou non,
émanant des établissements d’enseignement et de
recherche français ou étrangers, des laboratoires
publics ou privés.
Seasonal variation of mono- and sesquiterpene emission
rates of Scots pine
H. Hakola, V. Tarvainen, J. Bäck, H. Ranta, B. Bonn, J. Rinne, M. Kulmala
To cite this version:
H. Hakola, V. Tarvainen, J. Bäck, H. Ranta, B. Bonn, et al.. Seasonal variation of mono- and
sesquiterpene emission rates of Scots pine. Biogeosciences, European Geosciences Union, 2006, 3 (1),
pp.93-101. �hal-00297543�
www.biogeosciences.net/3/93/2006/ © Author(s) 2006. This work is licensed under a Creative Commons License.
Biogeosciences
Seasonal variation of mono- and sesquiterpene emission rates of
Scots pine
H. Hakola1, V. Tarvainen1, J. B¨ack2, H. Ranta3, B. Bonn4, J. Rinne4, and M. Kulmala4
1Finnish Meteorological Institute, Air Chemistry Laboratory, P.O. Box 503, 00 101 Helsinki, Finland
2University of Helsinki, Department of Forest Ecology, P.O. Box 27, 00 014 University of Helsinki, Finland
3University of Turku, Department of Biology, 20 014 University of Turku, Finland
4University of Helsinki, Department of Physical Sciences, P.O. Box 64, 00 014 University of Helsinki, Finland
Received: 4 October 2005 – Published in Biogeosciences Discuss.: 10 November 2005 Revised: 6 February 2006 – Accepted: 15 February 2006 – Published: 13 March 2006
Abstract. The seasonal variation of mono-and sesquiterpene emission rates of Scots pine was measured from April to Oc-tober in 2004. The emission rates were measured daily in the afternoons with the exception of weekends. Emissions were measured from two branches; one of them was debud-ded in May (branch A), while the other was allowed to grow new needles (branch B). The monoterpene emission pattern remained almost constant throughout the measurement
pe-riod, 13-carene being the dominant monoterpene (50–70%
of the VOC emission). The standard monoterpene emission
potential (30◦C) was highest during early summer in June
(the average of the two branches 1.35 µg g−1h−1)and
low-est during early autumn in September (the average of the
two branches 0.20 µg g−1h−1). The monoterpene emission
potential of branch A remained low also during October, whereas the emission potential of branch B was very high in October. The sesquiterpenes were mainly emitted during mid summer, the dominant sesquiterpene being β-caryophyllene. Branch A had a higher sesquiterpene emission potential than branch B and the emission maximum occurred concomitant with the high concentration of airborne pathogen spores sug-gesting a potential defensive role of the sesquiterpene
emis-sions. The sesquiterpene emissions were well correlated
with linalool and 1,8-cineol emissions, but not with monoter-penes. Sesquiterpene and 1,8-cineol emissions were equally well described by the temperature dependent and the tem-perature and light dependent algorithms. This is due to the saturation of the light algorithm as the measurements were always conducted during high light conditions.
Correspondence to: H. Hakola
(hannele.hakola@fmi.fi)
1 Introduction
During the past decade the characteristics of the biogenic VOC emissions from European ecosystems have been inten-sively studied, both in the boreal forests and in the South European regions. So far the studies have mainly concen-trated on the short-term emissions of monoterpenes (Jan-son 1993; Jan(Jan-son et al., 2001; Rinne et al., 1999, 2000; Komenda and Koppmann, 2002) and isoprene (Hakola et al., 1998), even though the VOC emissions have large sea-sonal variations. Downy birch has been shown to emit large amounts of linalool and sesquiterpenes early in the growing season, while their later emissions consist mainly of sabinene and ocimene (Hakola et al., 2001). Norway spruce emits monoterpenes in May, whereas their emission mainly con-sists of isoprene in June and sesquiterpenes in July (Hakola
et al., 2003). Due to their high reactivity the
sesquiter-penes have drawn a lot of attention lately. Their atmospheric lifetimes are only a few minutes and therefore they cannot be measured from the ambient air samples (Hakola et al., 2000, 2003), yet they have a high potential to form sec-ondary organic aerosol (Hoffmann et al., 1997; Jaoui et al., 2003). Bonn and Moortgat (2003) suggest that sesquiterpene ozonolysis could be responsible for the atmospheric new par-ticle formation observed frequently in several rural locations (M¨akel¨a et al., 1997; Kulmala et al., 2004). Sesquiterpenes may also affect tropospheric ozone concentrations – they may participate in ozone formation when enough nitrogen oxides are present and in a very clean environment some of the ozone deposition may be attributed to sesquiterpene re-actions (Kurpius and Goldstein, 2003). The oxidation pro-cesses of these very reactive compounds can also produce hydroxyl radicals (Holzinger et al., 2004).
The present study is focused on the seasonal development of the VOC emission rates of Scots pine. The temperature and light dependence of the VOC emissions of Scots pine
94 H. Hakola et al.: Mono- and sesquiterpene emission rates of Scots pine has been studied by Tarvainen et al. (2005) during the
grow-ing seasons of 2002 and 2003. However the data set in the study was concentrated on spring and it was found that es-pecially for sesquiterpenes more measurements were needed during high summer to assess the seasonality. The knowl-edge on seasonal variation of biogenic VOC emissions is needed for several purposes, e.g. for the evaluation of the effect of biogenic VOCs on the ozone concentrations in the boreal forested areas and the estimation of the contribution of sesquiterpenes to the ozone deposition as well as the new particle formation and growth processes in clean areas.
2 Experimental
The VOC emission rates of Scots pine (Pinus sylvestris L.)
were measured in southern Finland in Hyyti¨al¨a (61◦510N,
24◦170E) from April to October in 2004. The emission
rates were measured daily in the afternoons with the excep-tion of weekends, when no measurements were conducted. The measured tree was growing in a natural forest environ-ment, with an average tree height of 14 m. The samples were collected at a height of about 13 m from two fully sun-lit branches. Two branches of the same tree were enclosed in two Teflon enclosures in March and remained there until October in order to prevent losses to the surfaces that can take place due to insufficient equilibrium time (Helmig et al., 2004). The other end of the enclosures remained open except during measurements, to ensure sufficient ventilation for the shoot in other times. The purge flow was maintained only during the measurements. One of the measured shoots (henceforth called branch A) was debudded in May before budbreak, while the other (branch B) one was allowed to grow new needles.
The emission rates were measured using a dynamic flow through technique. The volume of the cylinder shape Teflon enclosures was approximately 20 l and they were equipped with inlet and outlet ports and a thermometer inside the en-closure. The cover of the enclosures was made of transparent Teflon film. The photosynthetically active photon flux den-sity (PPFD) was measured just above the enclosure. The flow through the enclosure was about 8 l per minute. Ozone was
removed from the inlet air using MnO2-coated copper nets
(Pollmann et al., 2005). The efficiencies of the ozone scrub-bers were checked prior to and after the measurement cam-paign and they removed ozone completely. The air samples were collected onto adsorbent tubes simultaneously from both the inlet and outlet ports. The emission rate is deter-mined as the mass of compound per needle dry weight and time according to
E = (C2−C1)F
m . (1)
Here C2 is the concentration in the outgoing air, C1 is the
concentration in the inlet air, and F is the flow rate into the
enclosure. The dry weight of the biomass (m) was
deter-mined by drying the needles at 75◦C until consistent weight
was achieved, and the mass of the new needles was estimated using a regression from a comparable adjacent shoot where daily growth measurements were performed.
The samples were collected using adsorbent tubes filled with Tenax-TA and Carbopack-B. The sampling time was
60 min and sampling flow rate about 100 ml min−1
result-ing in approximately 3 liter sample volumes. The adsor-bent tubes were analyzed using a thermodesorption instru-ment (Perkin-Elmer ATD-400), connected to a gas chromato-graph (HP 5890) with HP-1 column (60 m, i.d. 0.25 mm)
and a mass-selective detector (HP 5972). The
detec-tion limits were 32 ng m−3 for isoprene and
2-methyl-3-buten-2-ol (MBO). For monoterpenes the detection limits
were: camphene 11 ng m−3, carene 42 ng m−3, 1,8-cineole
84 ng m−3, limonene 60 ng m−3, α-pinene 30 ng m−3,
β-pinene 36 ng m−3, sabinene 59 ng m−3, and terpinolene
29 ng m−3. The detection limit for β-caryophyllene was
79 ng m−3.
The standardized emission potentials (at temperature
293 K and light intensity 1000 µmol photons m−2s−1) of
2-methyl-3-buten-2-ol (MBO) were calculated according to the temperature and light dependent emission algorithm and those of mono- and sesquiterpenes according to the tempera-ture dependent emission algorithm presented by Guenther et al. (1993) and Guenther (1997). The light and temperature dependence of the emissions of some of the compounds was further tested as described in Tarvainen et al. (2005) using the emission algorithms presented by Guenther (1997) and Schuh et al. (1997).
Sampling of fungal spores was undertaken with volumetric Burkard-spore trap (Hirst, 1952) on the level of tree canopy in Hyyti¨al¨a . The spores were counted during 1 March–14 August 2004, and identified on stratified randomised fields with microscopic observation (M¨akinen, 1981). The daily average counts of airborne spores belonging to orders Ured-inales and UstilagUred-inales, and subdivisions Basidiomycotina and Ascomycotina (one-, two- and more than two-celled spore types) were used in analyses. Uredinales and Usti-laginales are biotrophic pathogens. Marked fraction of Ba-sidiomycotina spores dispersing in spring-time and summer are pathogenic or saprophytic wood-rotting fungi. Group Ascomyotina contains numerous pathogenic and endophytic species invading living hosts (Manion, 1991).
According to the statistics of the Finnish Meteorological Institute, year 2004 was close to or slightly warmer than the long term average. In the southwestern and western parts of the country the growing season started already in April, which is earlier than average. April was, however, also very dry, with the precipitation amounts far below the long term average. The beginning of May was exceptionally warm. However, there were severe cold spells later in May and even in June in the southern parts of the country, which slowed down or even completely stopped the progress of the
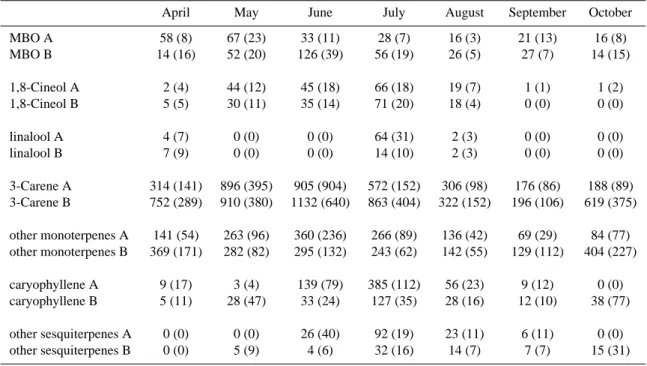
Table 1. The monthly mean VOC emission potentials (30◦C) of two branches (A and B) of the same Scots pine tree (ng g−(needledryweight)1 h−1). The emission potentials are standardized to 30◦C according to Guenther et al. (1993) using β value 0.09 K−1for monoterpenes and 0.19 K−1for sesquiterpenes (see Table 2). The MBO emission was standardized using the light and temperature dependent isoprene algorithm. (Guenther, 1997). 95% confidence intervals (in parenthesis) are calculated as 2·std(emission potential)/√(number of measurements). The effect of the debudding of branch A on 13 May has been removed from the monthly mean by ignoring the measurements for one week after debudding.
April May June July August September October MBO A 58 (8) 67 (23) 33 (11) 28 (7) 16 (3) 21 (13) 16 (8) MBO B 14 (16) 52 (20) 126 (39) 56 (19) 26 (5) 27 (7) 14 (15) 1,8-Cineol A 2 (4) 44 (12) 45 (18) 66 (18) 19 (7) 1 (1) 1 (2) 1,8-Cineol B 5 (5) 30 (11) 35 (14) 71 (20) 18 (4) 0 (0) 0 (0) linalool A 4 (7) 0 (0) 0 (0) 64 (31) 2 (3) 0 (0) 0 (0) linalool B 7 (9) 0 (0) 0 (0) 14 (10) 2 (3) 0 (0) 0 (0) 3-Carene A 314 (141) 896 (395) 905 (904) 572 (152) 306 (98) 176 (86) 188 (89) 3-Carene B 752 (289) 910 (380) 1132 (640) 863 (404) 322 (152) 196 (106) 619 (375) other monoterpenes A 141 (54) 263 (96) 360 (236) 266 (89) 136 (42) 69 (29) 84 (77) other monoterpenes B 369 (171) 282 (82) 295 (132) 243 (62) 142 (55) 129 (112) 404 (227) caryophyllene A 9 (17) 3 (4) 139 (79) 385 (112) 56 (23) 9 (12) 0 (0) caryophyllene B 5 (11) 28 (47) 33 (24) 127 (35) 28 (16) 12 (10) 38 (77) other sesquiterpenes A 0 (0) 0 (0) 26 (40) 92 (19) 23 (11) 6 (11) 0 (0) other sesquiterpenes B 0 (0) 5 (9) 4 (6) 32 (16) 14 (7) 7 (7) 15 (31)
ing season. The summer was exceptionally rainy, with record high precipitation amounts in southern and central Finland in July. May, June and July were also cloudier than the long term average. September was again quite rainy, completing the exceptional wetness of thermal growing season, which then ended after the first week of October in the southern and central parts of the country.
3 Results and discussion
3.1 Seasonal variability of the emissions
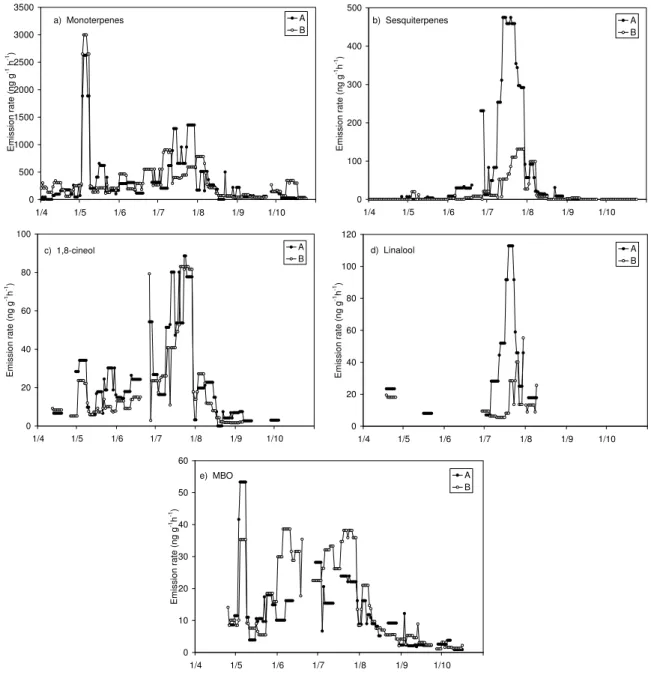
The 7-day running medians of the measured emission rates
are presented in Figs. 1a–e. Small amounts of
monoter-penes were emitted already in March (not shown in the fig-ure) when the measurements were started. During the first week of May the temperature was exceptionally high for the time of the year and the maximum monoterpene emission rate for the growing season of 2004 was observed during that period (Fig. 1a). In general, the monoterpene emissions from the two measured branches did not differ much, although in April, branch B emitted almost twice as much monoterpenes as branch A. In order to investigate the differences in the emission behaviour of new and old needles branch A was
debudded on 13 May, while branch B was allowed to grow the new needles. The effect of debudding is discussed in more detail below. Monoterpene emission rates increased at the end of June, but they decreased already in August and re-mained low until the emission rates from branch B increased at the end of October. Unexpectedly high emission rates from Scots pine during autumn have been measured also earlier (Tarvainen et al., 2005). The monoterpene emission pattern remained almost the same throughout the growing season
(Table 1). The main compound was 13-carene, composing
more than 50% of the emission during almost the whole
pe-riod. The normalized emission potentials of 13-carene and
other monoterpenes from both branches were significantly lower in the late summer and early fall (August–September) than earlier in the summer.
Sesquiterpenes, mainly β-caryophyllene (Fig. 1b) and the oxygen containing compounds 1,8-cineole (Fig. 1c) and linalool (Fig. 1d) were detected in the emission later in the year than the monoterpenes. In addition to β-caryophyllene, two other sesquiterpenes were detected, according to NIST mass spectra library these compounds could be α-farnesene and α-caryophyllene, but these identifications are only ten-tative. 1,8-cineole was identified for the first time at the end of April and linalool was not observed until July. The
96 H. Hakola et al.: Mono- and sesquiterpene emission rates of Scots pine sesquiterpene emissions were initiated at the end of June and
they ceased already in the beginning of August, although sesquiterpenes were found in a few occasional samples also during spring. The emissions of β-caryophyllene were well correlated with those of linalool and 1,8-cineole, but not with the monoterpene emissions. In the middle of the summer (15 June–15 August), at the time of the sesquiterpene emissions, the correlation coefficients (r) between the β-caryophyllene
and linalool, 1,8-cineole, α-pinene and 13-carene emissions
from branch A were 0.9, 0.8, 0.3 and 0.3, respectively. The sesquiterpenes and linalool have been found to be well corre-lated also in the VOC emission from downy birch (Hakola et al., 2001). The contribution of β-caryophyllene was signif-icant in July, when it was the most abundant compound
af-ter 13-carene in the emission from branch A (Table 1). The
normalized emission potentials of β-caryophyllene and other sesquiterpenes from both branches were significantly higher in July than the rest of the measurement period.
MBO emissions were detected for the first time at the end of April (Fig. 1e). Simultaneously, a small isoprene emission was also observed. The isoprene emission rate was well cor-related with the MBO emission rate and it is possible that this is an artefact as MBO can be dehydrated – resulting in iso-prene formation – in the analysis. It is possible that our MBO results are underestimated by up to 50%. Still the MBO emissions were quite low, although MBO has been found to be one of the major VOC compounds in pine forests in the United States (Goldan et al., 1993; Harley et al., 1998).
3.2 Sesquiterpene emissions and pathogen spores
Martin et al. (2003) have shown that methyl jasmonate causes a 5-fold increase in the total terpenoid emission of Norway spruce, with an emission pattern shift towards oxygenated monoterpenes (linalool) and sesquiterpenes (e.g. (E)-β-farnesene). Methyl jasmonate is known to induce the pro-duction of defense-related compounds and resistance against several herbivores, and has also been used to induce defen-sive responses without causing physical damage to the plant. Since daily measurements of pathogen spores from ambi-ent air in Hyyti¨al¨a were available, we plotted them together with the sum of the emission rates of the stress-induced com-pounds (linalool, 1,8-cineole and sesquiterpenes) (Fig. 2). The sesquiterpene emissions were first detected at about the same time as spores with potential pathogens were mea-sured for the first time. Also the maximum emissions of sesquiterpenes, linalool and 1,8-cineole occur concomitant with the maximum of the pathogen spores (Fig. 2). This finding would support the theory that the sesquiterpenes and oxygenated monoterpenes are released by the plant for de-fensive purposes (Wei, 2003). Factor analysis conducted with the data also showed at least two groups of compounds
with emissions behaving in distinctive manner. The first
group comprised of α-pinene, sabinene, β-pinene, 13-carene
and limonene, and the second one of 1,8-cineole, linalool,
caryophyllene and α-farnesene. The pathogen spores had their highest factor loading on the same factor with the latter group.
There are also other stress factors that could initiate sesquiterpene emissions, ozone for example, and one could speculate if the sesquiterpene emissions are affected when re-moving ozone from the air entering the enclosure. Removal of ozone is a standard procedure, however, to avoid chemical reactions between ozone and emitted compounds, and thus our results are comparable with others that have been gained using shoot enclosures in field conditions.
3.3 The effect of debudding
The increased monoterpene emissions caused by the debud-ding of branch A are studied in Figs. 3a, b, where the
nor-malized (30◦C) emission potentials of various compounds
for both branches are shown. The increase of the emission occurred immediately after the cutting of the terminal buds of the branch A on 13 May and lasted for approximately a week (Fig. 3a). The emission rates of all monoterpenes from branch A increased after the debudding, but those of MBO, 1,8-cineole and β-caryophyllene did not (Fig. 3b). It is well known that in pine MBO is not stored in needles, but is re-leased to the air immediately after it is synthezised (Harley et al., 1998), and this might be the case for 1,8-cineol, too. Ac-cording to Niinemets et al. (2002), the pools of oxygenated VOCs with low Henry’s law constant, preferably partitioning to the leaf aqueous phase, may rapidly adjust to changes in stomatal aperture, and their storage pools therefore are rela-tively small when the stomata are open.
Later in the growing season these two branches behaved
somewhat differently. The most important difference in
the emission rates between the branches was found in the emissions of sesquiterpenes. The debudded branch (A) had much higher sesquiterpene emission rates reflecting to
emis-sion potentials normalized to 30◦C, which differ significantly
from each other (Table 1). The July average emission
po-tentials (30◦) were 0.39±0.11 and 0.13±0.04 µg g−1h−1for
branches A and B, respectively. The only visible difference between the branches was that after debudding branch A started to grow new buds. However, it is not likely that the sesquiterpenes were emitted from the developing buds, since high emissions related to bud sprouting could not be seen in the beginning of the summer, neither in fall during the cur-rent year’s bud development in branch B.
Contrary to sesquiterpene emissions, higher MBO emis-sion rates were measured from branch B which was not de-budded and had new needles. This could be due to matu-ration of new needle tissue, as the enzyme activities for ter-penoid biosynthesis correlate with the developmental stage of leaf tissues (Lehning et al., 2001).
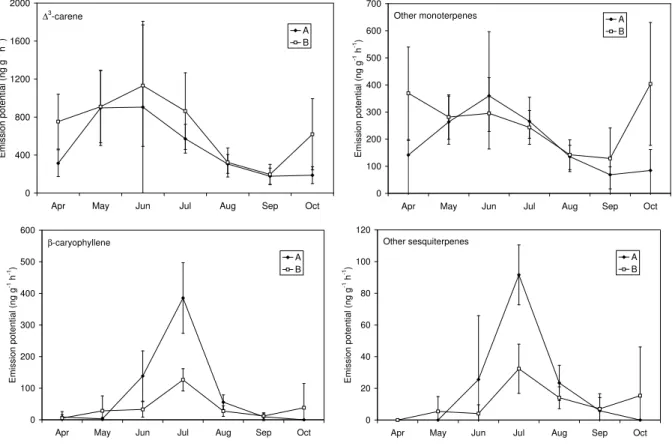
The seasonal variation of the mono- and sesquiterpene emission potentials of the two brances is depicted in Fig. 4. The monoterpene emission potentials between the two
0 500 1000 1500 2000 2500 3000 3500 1/4 1/5 1/6 1/7 1/8 1/9 1/10 E m is si on ra te (n g g -1 h -1) A B a) Monoterpenes 0 100 200 300 400 500 1/4 1/5 1/6 1/7 1/8 1/9 1/10 E m is si on ra te (n g g -1h -1) A B b) Sesquiterpenes 0 20 40 60 80 100 1/4 1/5 1/6 1/7 1/8 1/9 1/10 E m is si on ra te (n g g -1h -1) A B c) 1,8-cineol 0 20 40 60 80 100 120 1/4 1/5 1/6 1/7 1/8 1/9 1/10 E m is si on ra te (n g g -1h -1) A B d) Linalool 0 10 20 30 40 50 60 1/4 1/5 1/6 1/7 1/8 1/9 1/10 E m is si on ra te (n g g -1h -1) A B e) MBO
Fig. 1. 7-day running medians of the measured VOC (sum of monoterpenes, sum of sesquiterpenes, MBO, 1,8-cineol, linalool) emission
rates from Scots pine in Hyyti¨al¨a, Finland in 2004. The samples were taken at midday from two different branches (A and B) of the same tree.
branches did not show significant differences until autumn. In October the branch which was not debudded (B) showed significantly higher emission potential than the debudded branch (Fig. 4). The contribution of the new needle year class to the whole branch monoterpene emissions can thus be significant, especially during the winter hardening period in late fall.
3.4 Light and temperature dependence of the emissions
As has been shown in a number of studies (e.g. Janson, 1993; Komenda and Koppmann, 2002; Tarvainen et al., 2005) the
VOC emission rates of Scots pine are dependent on tempera-ture and the present study again confirmed the earlier results. As our data set included the high summer measurements which were lacking in the work of Tarvainen et al. (2005), we have further investigated the temperature and light de-pendence of sesquiterpenes and 1,8-cineole during this in-tense emission period. In addition to the algorithms com-monly used in biogenic emission modeling (Guenther et al., 1993; Guenther, 1997) which were also applied by Tarvainen et al. (2005), an algorithm presented by Schuh et al. (1997) was tested for the light dependence.
98 H. Hakola et al.: Mono- and sesquiterpene emission rates of Scots pine 0 200 400 600 800 1000 1200 17/3 17/4 17/5 17/6 17/7 17/8 E m is si on ra te (n g g -1h -1) 0 10000 20000 30000 40000 50000 P at ho ge n sp or es
sesquiterpenes, linalool and 1,8-cineol A pathogen spores
Fig. 2. The sum of the emission rates of sesquiterpenes, linalool
and 1,8-cineole from branch A and the concentrations of pathogen spores measured i Hyyti¨al¨a.
0 1000 2000 3000 4000 5000 6000 7000 8000 12/5 13/5 14/5 15/5 16/5 17/5 18/5 19/5 20/5 21/5 22/5 23/5 24/5 E m is si on p ot en tia l ( ng g -1 h -1) monoterpenes, A monoterpenes, B a) 0 1000 2000 3000 4000 5000 6000 7000 8000 12/5 13/5 14/5 15/5 16/5 17/5 18/5 19/5 20/5 21/5 22/5 23/5 24/5 M on ot er pe ne e m is si on p ot en tia l ( ng g -1h -1) 0 200 400 600 800 1000 1200 1400 1600 1800 2000 S es qu ite rp en e em is si on p ot en tia l ( ng g -1h -1) monoterpenes, A 1,8-cineol, A MBO A sesquiterpene A b)
Fig. 3. (a) The effect of the debudding of branch A on 13 May on
the monoterpene emissions. Branch B was left untouched. (b) The effect of the debudding of branch A on the emission potential of total monoterpenes, 1,8-cineole, β-caryophyllene and MBO.
Nonlinear regression was used to fit the observed emis-sions to the temperature dependent emission algorithm, Eq. (5) of Guenther et al. (1993), henceforth called the TEMP algorithm. In addition to the simple exponential TEMP algo-rithm, we tested the light and temperature dependent emis-sion algorithm, Eq. (1) of Guenther et al. (1993), with
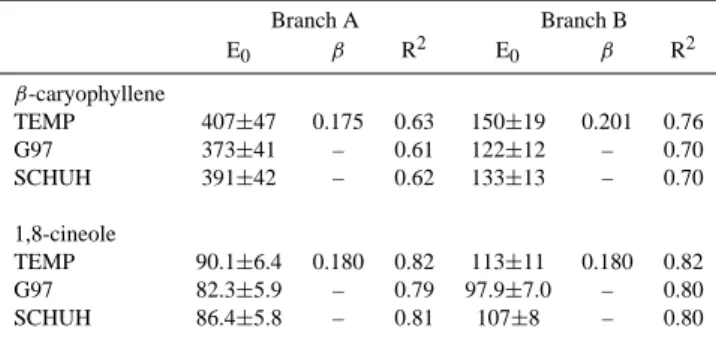
cor-Table 2. The results of the nonlinear regression analysis of the
β-caryophyllene and 1,8-cineole emission rates of branches A and B in July 2004 using three emission algorithms; the temperature de-pendent TEMP algorithm (Guenther et al., 1993) and two temper-ature and light dependent algorithms G97 (Guenther et al., 1993, Guenther, 1997) and SCHUH (Schuh et al., 1997). E0is the
emis-sion potential (at 30◦C and 1000 µmol photons m−2s−1), β is the coefficient describing the strength of the temperature dependence in the TEMP algorithm and R2is the regression statistic.
Branch A Branch B E0 β R2 E0 β R2 β-caryophyllene TEMP 407±47 0.175 0.63 150±19 0.201 0.76 G97 373±41 – 0.61 122±12 – 0.70 SCHUH 391±42 – 0.62 133±13 – 0.70 1,8-cineole TEMP 90.1±6.4 0.180 0.82 113±11 0.180 0.82 G97 82.3±5.9 – 0.79 97.9±7.0 – 0.80 SCHUH 86.4±5.8 – 0.81 107±8 – 0.80
rected formulation from Eq. (2) of Guenther (1997), and the slightly different formulation of the light dependence pre-sented by Schuh et al. (1997), henceforth called the G97 and SCHUH algorithms, respectively. The latter two algorithms have identical formulation, except that Schuh et al. (1997) suggest a slightly more moderate light dependence, with the light dependent environmental correction factor used in the G97 algorithm raised to the power of two in the SCHUH parameterization. The results of the regression analysis for both studied compounds and all three tested algorithms are presented in Table 2 which gives the standard emission
po-tential E0(at 30◦C and 1000 µmol photons m−2s−1), the β
coefficient indicating the strength of the temperature
depen-dence when applicable, and the regression statistic R2.
The nonlinear regression fit of the July sesquiterpene data to the TEMP algorithm resulted in a reasonably good
agreement, with an R2 of 0.63 and 0.76 for branches A
and B, respectively. The modelled β-caryophyllene emis-sion rates obtained from this fit are presented in Fig. 5 to-gether with the observations. The observed higher emis-sions of the debudded branch A are reflected in the
standard-ized emission potentials, which were 407±47 ng g−1h−1and
150±19 ng g−1h−1for branches A and B, respectively
(Ta-ble 2). These values are close to the ones given in Ta(Ta-ble 1 for the β-caryophyllene emission potentials of branches A and B in July obtained as averages from the measurements. Tarvainen et al. (2005) were not able to present late sum-mer emission potentials for β-caryophyllene, but their
val-ues for early summer and autumn, 160±160 ng g−1h−1and
158±295 ng g−1h−1, respectively, are very close to the
val-ues obtained in this study for the undisturbed branch B. The
β coefficient values obtained in our study were of 0.18 for
branch A and 0.20 for branch B, which is also in agreement
0 400 800 1200 1600 2000
Apr May Jun Jul Aug Sep Oct
E m is si on p ot en tia l ( ng g -1 h -1) A B ∆3-carene 0 100 200 300 400 500 600 700
Apr May Jun Jul Aug Sep Oct
E m is si on p ot en tia l ( ng g -1 h -1) A B Other monoterpenes 0 100 200 300 400 500 600
Apr May Jun Jul Aug Sep Oct
E m is si on p ot en tia l ( ng g -1 h -1) A B β-caryophyllene 0 20 40 60 80 100 120
Apr May Jun Jul Aug Sep Oct
E m is si on p ot en tia l ( ng g -1 h -1) A B Other sesquiterpenes
Fig. 4. Monthly mean mono- and sesquiterpene emission potentials (30◦C) of the two branches with the estimated 95% confidence intervals.
The main monoterpene, 13-carene is plotted separately from the rest of the monoterpenes and the main sesquiterpene, β-caryophyllene, separately from the rest of the sesquiterpenes.
with the results of Tarvainen et al. (2005) who found values 0.18 and 0.16 for early summer and autumn, respectively.
Regression fits of the July β-caryophyllene data to the G97 and SCHUH algorithms also resulted in a reasonably good agreement, with only slightly lower standard emission po-tentials for both branches (Table 2).
Tarvainen et al. (2005) found that the 1,8-cineole emis-sions measured in 2003 in Hyyti¨al¨a were equally well de-scribed by the temperature and light dependent algorithm G97 and by the temperature-only dependent TEMP algo-rithm. They concluded that more measurements of the 1,8-cineole emissions should be made, especially during the high summer in order to resolve the light dependence of the emis-sions. Our data set of 2004 had a better coverage of this high emission period but it also yielded the same ambigu-ous results. In addition to being able to describe the emis-sions equally well, all three algorithms also yielded almost identical standard emission potentials, with values ranging
from 82±6 ng g−1h−1to 90±6 ng g−1h−1for branch A and
from 98±7 ng g−1h−1 to 113±11 ng g−1h−1 for branch B
(Table 2). The standard emission potentials are again very close to those given in Table 1 for the average emission po-tentials of 1,8-cineole for branches A and B in July. The stan-dard emission potential reported for 1,8-cineole by Tarvainen
et al. (2005) was 68 ng g−1h−1over the whole vegetation
pe-riod which is slightly lower than the values obtained in this study for the intense emission period in July. According to our results the β coefficient for 1,8-cineole was 0.18 for both branches, while Tarvainen et al. (2005) again found a slightly lower value of 0.14.
The remarkable similarity of the emission potentials of
es-pecially 1,8-cineole and the high R2values obtained by the
nonlinear regression analysis using the different algorithms is due to the saturation of the light algorithm as the mea-surements were always conducted during high light condi-tions. Diurnal measurements would be needed for the valida-tion or development of emission algorithms. In the data set collected during these experiments in Hyyti¨al¨a, the depen-dence of the temperature (T) of the photosynthetically active photon flux density (PPFD) was logarithmic with the form
T=11.885·ln(PPFD)−59.614 (R2=0.72). In July 2004 the
dependence was even stronger: T=7.8851·ln(PPFD)−28.085
(R2=0.83). The maximum temperatures in July were
approx-imately 30◦C, i.e. well below the turning point of the
expo-nential growth of the temperature dependent correction factor of the G97 and SCHUH algorithms. Furthermore, the PPFD values in the July data ranged approximately between 500
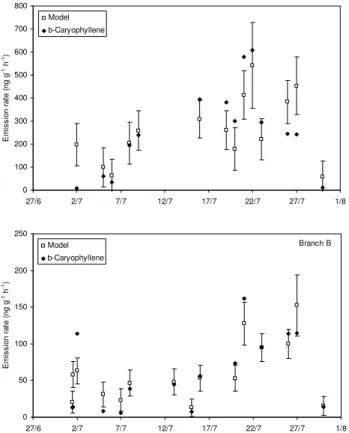
al-100 H. Hakola et al.: Mono- and sesquiterpene emission rates of Scots pine 0 100 200 300 400 500 600 700 800 27/6 2/7 7/7 12/7 17/7 22/7 27/7 1/8 E m is si on r at e (n g g -1 h -1) Model b-Caryophyllene 0 50 100 150 200 250 27/6 2/7 7/7 12/7 17/7 22/7 27/7 1/8 E m is si on r at e (n g g -1 h -1) Model b-Caryophyllene Branch B
Fig. 5. Measured and modelled β-caryophyllene emission rates in
Hyyti¨al¨a in July 2004. The modeled emissions were obtained by a nonlinear regression fit of the temperature dependent emission al-gorithm of Guenther et al. (1993) to the measured data.
gorithm in most cases. This explains why the results using the G97 and SCHUH algorithms were almost identical as in this region the light dependent environmental correction fac-tor is quite close to unity and the effect of the power of two remains small.
4 Conclusions
The seasonal variation of monoterpene emission rates of Scots pine confirmed the earlier results; a high emission po-tential during early summer, declining emission popo-tentials later in summer and early autumn and higher again later in autumn (Komenda and Koppmann, 2002; Tarvainen et al., 2005). However, this study showed that the increase of the emission potential during autumn is due to the new needles, as the emission potential of the debudded branch
did not increase. The monoterpene emission pattern
re-mained almost constant throughout the measurement period,
13-carene being the dominant monoterpene (50–70% of the
VOC emission). The standard monoterpene emission
po-tential (30◦C) was highest in June (the average of the two
branches 1.35 µg g−1h−1)and lowest in September (the
av-erage of the two branches 0.20 µg g−1h−1).
The new needles also had a much higher MBO emission potential than the needles from the previous years. The stan-dardized MBO emission potential was more than ten times higher in the branch with new needles in June and continued to be a little higher also later in the growing season.
The sesquiterpenes were mainly emitted in the mid-dle of the summer, the dominant sesquiterpene being β-caryophyllene. The sesquiterpene emissions were well corre-lated with the linalool and 1,8-cineole emissions, but not with the monoterpenes. The emission maximum occurred con-comitant with the maximum concentration of the pathogen spores suggesting a potential defensive role of the sesquiter-pene emissions.
It has been shown earlier that the monoterpene emissions in Hyyti¨al¨a are usually well explained by a temperature dependent emission algorithm (Tarvainen et al., 2005). In the present study, the temperature dependence of the sesquiterpene and 1,8-cineole emissions was further studied and they were found to be equally well described by the temperature dependent and the temperature and light de-pendent algorithms. This ambiquity of the algorithm fitting results is due to the saturation of the light algorithm as the measurements were always conducted during high light conditions.
Edited by: J. Kesselmeier
References
Bonn, B. and Moortgat, G. K.: Sesquiterpene ozonolysis: origin of atmospheric new particle formation from biogenic hydrocarbons, Geophys. Res. Lett., 30, 1585, doi:10.1029/2003GL017000, 2003.
Goldan, P. D., Kuster, W. C., and Fehsenfeld, F. C.: The observa-tion of a C5 alcohol emission in a North American pine forest, Geophys. Res. Lett., 20, 1039–1042, 1993.
Guenther, A., Zimmerman, P. R., Harley, P. C., Monson, R. K., and Fall, R.: Isoprene and monoterpene emission rate variability: Model evaluations and sensitivity analyses, J. Geophys. Res., 98, 12 609–12 617, 1993.
Guenther, A.: Seasonal and spatial variations in natural volatile or-ganic compound emissions, Ecol. Appl., 7(1), 34–45, 1997. Hakola, H., Rinne, J., and Laurila, T.: The hydrocarbon emission
rates of Tea-leafed willow (Salix phylicifolia), Silver birch (Be-tula bendula) and European aspen (Populus tremula), Atmos. En-viron., 32, 1825–1833, 1998.
Hakola, H., Laurila, T., Rinne, J., and Puhto, K.: The ambient con-centrations of biogenic hydrocarbons at a Northern European, boreal site, Atmos. Environ., 34, 4971–4982, 2000.
Hakola, H., Laurila, T., Lindfors, V., Hell´en, H., Gaman, A., and Rinne, J.: Variation of the VOC emission rates of birch species during the growing season, Boreal Environ. Res., 6, 237–249, 2001.
Hakola, H., Tarvainen, V., Laurila, T., Hiltunen, V., Hell´en, H., and Keronen, P.: Seasonal variation of VOC concentrations above a boreal coniferous forest, Atmos. Environ., 37, 1623–1634, 2003. Harley, P., Fridd-Stroud, V., Greenberg, J., Guenther, A., and Vas-concellos, P.: Emission of 2-methyl-3-buten-2-ol by pines: A
potentially large natural source or reactive carbon to the atmo-sphere, J. Geophys. Res., 103, D19, 25 479–25 486, 1998. Helmig, D., Bocquet, F., Pollmann, J., and Revermann, T.:
Ana-lytical techniques for sesquiterpene emission rate studies in veg-etation enclosure experiments, Atmos. Environ., 38, 557–572, 2004.
Hirst, J. M.: An automatic volumetric spore trap, Ann. Appl. Biol., 39, 29–33, 1952.
Hoffmann, T., Odum, J. R., Bowman, F., Collins, D., Klockow, D., Flagan, R. C., and Seinfeld, J. H.: Formation of organic aerosols from the oxidation of biogenic hydrocarbons, J. Atmos. Chem., 26, 189–222, 1997.
Holzinger, R., Lee, A., Paw, K. T., and Goldstein, A.: Observations of oxidation products above a forest imply biogenic emissions of very reactive compounds, Atmos. Chem. Phys., 5, 67–75, 2004. Jaoui, M., Leungsakul, S., and Kamens, R. M.: Gas and particle
products distribution from the reaction of β-caryophyllene with ozone, J. Atmos. Chem., 45, 261–287, 2003.
Janson, R.: Monoterpene emissions from Scots Pine and Norwegian Spruce, J. Geophys. Res., 98, 2839–2850, 1993.
Janson, R. and De Serves, C.: Acetone and monoterpene emissions from the boreal forest in northern Europe, Atmos. Environ., 35, 4629–4637, 2001.
Komenda, M. and Koppmann, R.: Monoterpene emis-sions from Scots pine (Pinus sylvestris): Field studies of emission rate variabilities, J. Geophys. Res., 107, D13, doi:10.1029/2001JD000691, 2002.
Kulmala, M., Vehkam¨aki, H., Pet¨aj¨a, T., Dal Maso, M., Lauri, A., Kerminen, V.-M., Birmili, W., and McMurry, P. H.: Formation and growth rates of ultrafine atmospheric particles: A review of observations, J. Aerosol Sci., 35, 143–176, 2004.
Kurpius, M. R. and Goldstein, A. H.: Gas-phase chemistry domi-nates O3 loss to a forest, implying a source of aerosols and hy-droxyl radicals to the atmosphere, Geophys. Res. Lett., 30, 1371, doi:10.1029/2002GL016785, 2003.
Lehning, A., Zimmer, W., Zimmer, A., and Schnitzler, J.-P.: Mod-eling of annual variations of oak (Quercus robur L.) isoprene synthase activity to predict isoprene emission rates, J. Geophys Res., 106, 3157–3166, 2001.
Manion, P. D.: Tree disease consepts, Prentice Hall, NJ, 402 pp., 1991.
Martin, D. M., Gershenzon, J., and Bohlman, J.: Induction of volatile terpene biosynthesis and diurnal emission by methyl jasmonate in foliage of Norway spruce, Plant Physiology, 132, 1586–1599, 2003.
M¨akel¨a, J. M., Aalto, P., Jokinen, V., Pohja, T., Nissinen, A., Palm-roth, S., Markkanen, T., Seitsonen, K., Lihavainen, H., and Kul-mala, M.: Observation of ultrafine aerosol particle formation and growth in boreal forest, Geophys. Res Lett., 24, 1219–1222, 1997.
M¨akinen, Y.: Random sampling in the study of microscopic slides, Rep. form the Aerobiol. Lab. of Univ. Turku, 5, 27–43, 1981. Niinemets, ¨U., Reichstein, M., Staudt, M., Seufert, G., and
Ten-hunen, J. D.: Stomatal constraints may affect emission of oxy-genated monoterpenoids from the foliage of Pinus pinea, Plant Physiol., 130, 1371–1385, 2002.
Pollmann, J., Ortega, J., and Helmig, D.: Analysis of atmospheric sesquiterpenes: sampling losses and mitigation of ozone interfer-ences, Environ. Sci. Technol., 39, 9620–9629, 2005.
Rinne, J., Hakola, H., and Laurila, T.: Vertical fluxes of monoter-penes above a Scots pine stand in the boreal vegetation zone, Phys. Chem. Earth (B), 24, 711–715, 1999.
Rinne, J., Hakola, H., Laurila, T., and Rannik, ¨U.: Canopy scale monoterpene emissions of Pinus sylvestris dominated forests, Atmos. Environ., 34, 1099–1107, 2000.
Schuh, G., Heiden, A. C., Hoffmann, T., Kahl, J., Rockel, P., Rudolph, J., and Wildt, J.: Emissions of volatile organic com-pounds from sunflower and beech: dependence on temperature and light intensity, J. Atmos. Chem., 27, 291–318, 1997. Tarvainen, V., Hakola, H., Hell´en, H., B¨ack, J., Hari, P., and
Kul-mala, M.: Temperature and light dependence of the VOC emis-sions of Scots pine, Atmos. Chem. Phys., 5, 6691–6718, 2005. Wei, T.: Recent advances in the molecular genetics of resin
biosyn-thesis and genetic engineering strategies to improve defences in conifers, J. For. Res., 14, 171–179, 2003.