HAL Id: hal-00304216
https://hal.archives-ouvertes.fr/hal-00304216
Submitted on 2 Jun 2008HAL is a multi-disciplinary open access
archive for the deposit and dissemination of sci-entific research documents, whether they are pub-lished or not. The documents may come from teaching and research institutions in France or abroad, or from public or private research centers.
L’archive ouverte pluridisciplinaire HAL, est destinée au dépôt et à la diffusion de documents scientifiques de niveau recherche, publiés ou non, émanant des établissements d’enseignement et de recherche français ou étrangers, des laboratoires publics ou privés.
High spatial resolution measurements of NO2 applying
Topographic Target Light scattering-Differential Optical
Absorption Spectroscopy (ToTaL-DOAS)
E. Frins, U. Platt, T. Wagner
To cite this version:
E. Frins, U. Platt, T. Wagner. High spatial resolution measurements of NO2 applying Topographic Target Light scattering-Differential Optical Absorption Spectroscopy (ToTaL-DOAS). Atmospheric Chemistry and Physics Discussions, European Geosciences Union, 2008, 8 (3), pp.10257-10273. �hal-00304216�
ACPD
8, 10257–10273, 2008 High spatial resolution measurements with ToTaL-DOAS E. Frins et al. Title Page Abstract Introduction Conclusions References Tables Figures ◭ ◮ ◭ ◮ Back Close Full Screen / Esc Printer-friendly VersionInteractive Discussion
Atmos. Chem. Phys. Discuss., 8, 10257–10273, 2008 www.atmos-chem-phys-discuss.net/8/10257/2008/ © Author(s) 2008. This work is distributed under the Creative Commons Attribution 3.0 License.
Atmospheric Chemistry and Physics Discussions
High spatial resolution measurements of
NO
2
applying Topographic Target Light
scattering-Differential Optical Absorption
Spectroscopy (ToTaL-DOAS)
E. Frins1, U. Platt2, and T. Wagner3 1
Instituto de F´ısica, Facultad de Ingenier´ıa, J. Herrera y Reissig 565, 11300 Montevideo, Uruguay
2
Institut f ¨ur Umweltphysik, University of Heidelberg, Im Neuenheimer Feld 229, 69120 Heidelberg, Germany
3
Max-Planck-Institut f ¨ur Chemie, Becherweg 27, 55128 Mainz, Germany Received: 15 April 2008 – Accepted: 21 April 2008 – Published: 2 June 2008 Correspondence to: E. Frins ([email protected])
ACPD
8, 10257–10273, 2008 High spatial resolution measurements with ToTaL-DOAS E. Frins et al. Title Page Abstract Introduction Conclusions References Tables Figures ◭ ◮ ◭ ◮ Back Close Full Screen / Esc Printer-friendly VersionInteractive Discussion
Abstract
Tomographic Target Light scattering – Differential Optical Absorption Spectroscopy (ToTaL-DOAS), also called Target-DOAS, is a novel experimental procedure to retrieve trace gas concentrations present in the low atmosphere. Scattered sunlight (partially or totally) reflected from natural or artificial targets of similar albedo located at different
5
distances is analyzed to retrieve the concentration of different trace gases like NO2,
SO2and others. We report high spatial resolution measurements of NO2mixing ratios in the city of Montevideo (Uruguay) observing three buildings as targets with a Mini-DOAS instrument. Our instrument was 146 m apart from the first building, 196 m from the second and 286 m from the third one. All three buildings are located along a main
10
Avenue. We obtain temporal variation of NO2mixing ratios between 30 ppb and 65 ppb (±2 ppb). Our measurements demonstrate that ToTaL-DOAS measurements can be made over very short distances. In polluted air masses, the retrieved absorption signal was found to be strong enough to allow measurements over distances in the range of several ten meters, and achieve a spatial resolution of 50 m approximately.
15
1 Introduction
Monitoring dispersion of trace gases in the troposphere near the earth surface is a challenge, particularly when mobile emission sources are involved and the area of interest has complicated structures. This is usually the case in the surrounding of a busy road in a city. High temporal and spatial resolution is desirable to describe trace
20
gas dispersion in the site properly. The first requirement is achieved by several passive and active optical detection methods. The second condition, i.e. the spatial resolution, is also fulfilled by some very well established optical techniques like LIDAR (e.g. Collis, 1996; Klett, 1981; Fernald, 1984) and Tomographic-DOAS (see e.g. Veitel et al., 2002; Laepple et al., 2004; Pundt et al., 2005; Hartl et al., 2006; Hashmonay et al., 1999).
25
ACPD
8, 10257–10273, 2008 High spatial resolution measurements with ToTaL-DOAS E. Frins et al. Title Page Abstract Introduction Conclusions References Tables Figures ◭ ◮ ◭ ◮ Back Close Full Screen / Esc Printer-friendly VersionInteractive Discussion
Topographic Target Light scattering-DOAS (ToTaL-DOAS or Target-DOAS) (Frins et al., 2006a, b, and Louban et al., 2007) is a new experimental procedure to retrieve trace gas concentrations in the atmosphere near the earth surface. Basically, the method consists of pointing a DOAS instrument at different targets, which are illuminated by direct and/or scattered sun light. Applying a DOAS analysis to the obtained spectra
5
one retrieves the slant column densities (the integrated trace gas concentration) along several segments of known length, which, in turn, allows us to derive the average trace gas concentrations. The spectral analysis varies depending on the number and sort of selected targets (bright, mixed or dark targets). A detailed description of the method is given in Frins et al. (2006a).
10
In early works we reported the application of this method to very large sites (Frins et al., 2006a) and to remote measurements (Louban et al., 2007), i.e. sites located far away from our instrument. The purpose of the present work is to explore the spatial resolution of ToTaL-DOAS using targets at short distances.
2 ToTaL-DOAS measurements
15
2.1 Site description and instrument
We selected as area of interest a main street of Montevideo city (Italia Avenue), which is predominantly affected by mobile sources, since it is used by most of the private and public transport means to drive in and out of the city. On 6 November 2007 measure-ments were made with a Mini MAX-DOAS instrument (Bobrowski, 2005 and Bobrowski
20
et al., 2007) Basically, the instrument consists of a small commercial temperature con-trolled fibre-optic spectrometer with a spectral resolution of 0.55 nm and a spectral range from 330–460 nm. To reduce the dark current of the detector the entire spec-trometer was cooled to a stabilised temperature of +6◦C. The light is coupled into the spectrometer through a quartz lens (f =40 mm, diameter=20 mm) and a quartz fibre
25
ACPD
8, 10257–10273, 2008 High spatial resolution measurements with ToTaL-DOAS E. Frins et al. Title Page Abstract Introduction Conclusions References Tables Figures ◭ ◮ ◭ ◮ Back Close Full Screen / Esc Printer-friendly VersionInteractive Discussion
and can be moved to point at different targets. It can also be oriented to elevation an-gles between 0◦and 90◦approximately. To make sure that our instrument was pointing
to a specific Target, a reflex sight was installed.
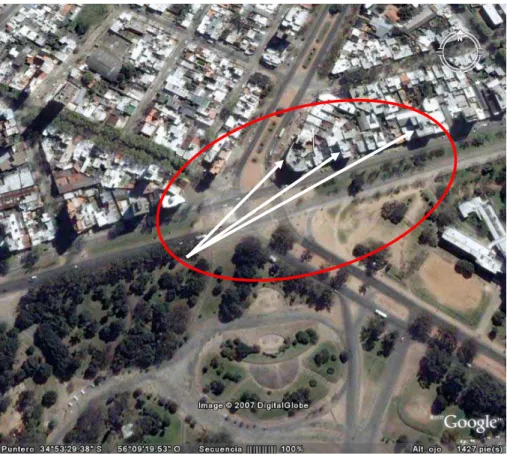
We located our instrument in a Park at one side of Ave. Italia, approximately 22 m (±2 m) away from the border of the lane (Fig. 1a). Three (almost) white walls of three
5
different buildings at the other side of the street were selected as bright targets, i.e. the radiance reflected by these targets is assume to be much higher than that due to sunlight scattering coming from the region between targets and instrument. These buildings were located at 146 m (±2 m), 196 m (±2 m) and 280 m (±2 m) apart from our instrument (Fig. 1b). We will call these buildings as target 1, target 2 and target 3,
10
respectively.
The measurements were performed by alternating the view between the three far targets, i.e. three selected walls of the buildings, the near target (three small pieces of different concrete, see below), and a zenith measurement. During the measure-ment period the ambient temperature was about 28◦C. In addition, dark current and
15
offset measurements under the same conditions were taken. The data acquisition was performed with the software package DOASIS (see www.iup.uni-heidelberg.de/ bugtracker/projects/doasis/).
2.2 Spectral analysis
In order to retrieve the integrated trace gas concentration along the paths between our
20
instrument and the targets, we decided to use a near target at a distance d ≈0 m from the instrument to record a reference spectrum instead using a zenith sky spectrum. For this purpose, we tested three casually available pieces of concrete. Like the far targets 1, 2 and 3 (white painted walls), also the used pieces of concrete were for long time exposed to the same ambient conditions, so it was expected that their spectral
25
reflectivity might also be similar. This assumption was tested by inspecting the spectral residuals from the various combinations of measurements (spectra from the buildings) and reference spectra (spectra from the pieces of concrete). It was found that for
sev-ACPD
8, 10257–10273, 2008 High spatial resolution measurements with ToTaL-DOAS E. Frins et al. Title Page Abstract Introduction Conclusions References Tables Figures ◭ ◮ ◭ ◮ Back Close Full Screen / Esc Printer-friendly VersionInteractive Discussion
eral combinations strongly increasing residual structures (up to more than 2%) towards shorter wavelengths appeared (Fig. 2). Similar results were found if the various target spectra were analysed against the zenith sky spectrum. No clear dependence of the magnitude of the residual structures and the properties of the targets was found from our limited set of combinations. The systematic analysis of the spectral reflectivity of
5
various materials and paints should be the subject of future studies.
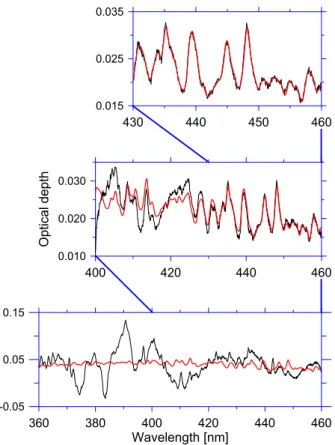
The spectral region for the evaluation of NO2 was selected considering
simultane-ously two conditions: 1) the absorption cross section is high enough and 2) the residual is small, i.e. the spectral structure caused by the different spectral reflectances does not interfere with our measurements. For example, Fig. 2 shows a NO2-evaluation
10
using the third building as target and a piece of concrete as reference; clearly, the residual decreases towards longer wavelengths (see details below). Taking in account these considerations, the spectral range for the evaluation of NO2was chosen between
429 nm and 460 nm.
The NO2 slant column densities (SCD), i.e. the integrated concentration along the
15
light path between targets (target 1, 2 and 3) and instrument (Mini MAX-DOAS), were derived from the spectral analysis using the software WINDOAS package (Fayt et al., 2001). The absorption cross sections of O4(Greenblatt et al., 1990) and NO2(Vandale
et al., 1997) at 294 K, O3 (Burrows et al., 1999) at 273 K and water vapor at 300 K
(Rothman et al., 2005) were fitted to the logarithm of the ratios between the measured
20
spectra of the targets and the reference spectrum. Additionally a synthetic Ring spec-trum was included in the evaluation. As shown in Fig. 2, the NO2absorption could be
clearly identified in the measured spectra indicating that in polluted air masses rather short absorption paths are sufficient to achieve a good signal to noise ratio. From our observations it appears to be possible to further reduce the distance between
instru-25
ment and target (i.e. the absorption pathlength). Assuming a detection limit from the DOAS analysis for the NO2SCD of about 10
15
molec/cm2, the corresponding detection limit of the NO2mixing ratio for an absorption path of only 50 m would be about 8 ppb.
im-ACPD
8, 10257–10273, 2008 High spatial resolution measurements with ToTaL-DOAS E. Frins et al. Title Page Abstract Introduction Conclusions References Tables Figures ◭ ◮ ◭ ◮ Back Close Full Screen / Esc Printer-friendly VersionInteractive Discussion
proved (e.g. by using selected materials for the measurement of a reference spectrum) and accordingly the detection limit can be further decreased.
2.3 Interpretation of the analyzed slant column densities
In first approximation, the retrieved slant column density represents the integrated trace gas concentration between the target and the instrument. This interpretation is based
5
on the assumption that the trace gas absorptions between the top of the atmosphere and the targets (either far targets, e.g. buildings or near Target, e.g. a piece of concrete) are similar and thus cancel out when rationing spectra from any of the far targets by one from the near target in the DOAS analysis. While this assumption should be quite well justified for absorptions in the upper troposphere and stratosphere, it might not be
10
fulfilled for the trace gas absorptions close to the surface, where strong 3-dimensional gradients can occur. The potential errors introduced by such gradients are discussed and estimated in the following.
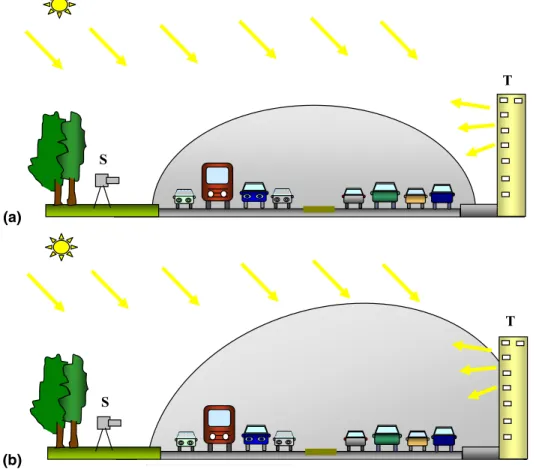
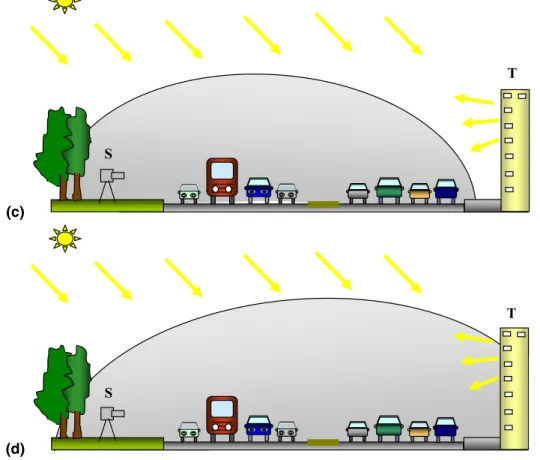
Considering the location of our instrument and the position of the targets relative to the extended emission source, there are different scenarios to be considered and
15
could affect our interpretation: a) the emission cloud is separated from the target walls and also separated from our instrument, as depicted in Fig. 3a; b) the emission cloud encompasses the far Target, so a fraction of the sunlight scattered from the targets contains additional absorption from the light path before the sun light has reached the target (Fig. 3b); c) the instrument (i.e. the near Target) is reached by the emission cloud
20
(Fig. 3c), and d) the target and our instrument are partially immersed in the emission cloud (Fig. 3d). In cases a) and d) the retrieved slant column density represents the true slant column density between the Target and the instrument. In case b) the measured SCD overestimates the true SCD and in case c) it underestimates the true SCD. The associated error can be quantified by estimating the maximum difference in the vertical
25
extension of the plume on both ends of the light path. Assuming a maximum difference of 20 m yields an error of the retrieved SCD between 13% and 8% for target 1 and target 3, respectively. It is evident that the relative magnitude of this error source depends on
ACPD
8, 10257–10273, 2008 High spatial resolution measurements with ToTaL-DOAS E. Frins et al. Title Page Abstract Introduction Conclusions References Tables Figures ◭ ◮ ◭ ◮ Back Close Full Screen / Esc Printer-friendly VersionInteractive Discussion
the ratio of the uncertainty in the vertical extent of the plume and the distance to the far Target.
In particular it decreases with increasing distance between the instrument and the far Target.
From the retrieved SCD the average concentration is simply derived by dividing the
5
SCD by the distance between instrument and Target. Dividing the obtained concen-tration by the concenconcen-tration of air yields the averaging mixing ratio. In the following we report average NO2mixing ratios derived in this way.
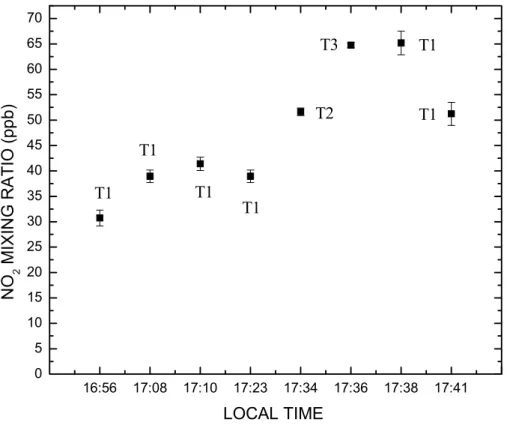
Figure 4 shows the temporal evolution of the NO2mixing ratios obtained by the three
different paths. As mentioned before, the measurement took place alternating
be-10
tween the different targets. From the (four) first measurements (instrument pointing to target 1) one observes a small increase of the NO2mixing ratio from 30 ppb (±2 ppb)
to 41 ppb (±1 ppb). As the instrument is directed to targets 2 and 3, the evaluation shows a stronger increase of the NO2 mixing ratio (52 ppb and 65 ppb, respectively). This NO2 increase is probably not due to the particular location of the targets (e.g. it
15
is not due to a spatially inhomogeneous concentration distribution), which was verified by pointing the instrument again to target 1, which yielded similar high values. Some minutes later again a decrease of the NO2mixing ratio was observed (see last
mea-surement in Fig. 4). Temporal variations of the NO2 mixing ratios may be interpreted
as a consequence of the passage of heavy vehicles like buses or trucks.
20
The resulting slant column densities, concentration and mixing ratios of NO2
mea-sured between 17:34 and 17:38 LT for the different paths is summarized in Table 1.
3 Discussion and conclusions
In this paper we report measurements of NO2mixing ratios in the city of Montevideo
(Uruguay) applying the ToTaL-DOAS method. We used three buildings located along
25
a main Avenue as targets. Our Mini-DOAS instrument was only 146 m apart from the first building, 196 m from the second and 286 m from the third one.
ACPD
8, 10257–10273, 2008 High spatial resolution measurements with ToTaL-DOAS E. Frins et al. Title Page Abstract Introduction Conclusions References Tables Figures ◭ ◮ ◭ ◮ Back Close Full Screen / Esc Printer-friendly VersionInteractive Discussion
The first step for the evaluation of NO2mixing ratios was the determination of slant column densities along the segments between instrument and targets. Then, assuming that the NO2concentration is spatially constant in the region of interest (apart from the
instrument and targets) and knowing the distance between instrument and (far) targets, it is possible to retrieve the NO2mixing ratios.
5
It was found that the calculated mixing ratios obtained from the shorter path (Target 1) shows a standard deviation ∼3.2–5%, which is larger than the standard deviations associated to measurements using longer path lengths (1.5% for target 2 and 0.8% for target 3). This is physically reasonable because the magnitudes actually measured are the optical densities along the light paths, and thus, the signal-to-noise ratio will be
10
smaller for the longer path lengths.
Usually a zenith spectrum is used as reference spectrum. Instead of this, we used as reference the spectrum of a near target (in our case a piece of concrete, see above) placed at a distance d ≈0 m from the instrument. We found that some of the avail-able pieces of concrete, exposed for long time to the same ambient conditions like the
15
buildings (targets), have a similar spectral reflectance to those of the targets, allowing a good convergence of the spectral DOAS retrieval in the spectral range 429–460 nm. However, it should be noted that the spectral reflectances of the different targets (build-ings and various pieces of concrete) showed significant differences in the wavelength ranges <430 nm. These effects should be studied in more detail in the future;
proba-20
bly well suited reference materials can be identified for various types of buildings and paintings to allow also a meaningful DOAS retrieval at shorter wavelengths. Alterna-tively, artificial, diffuse reflecting targets may be attached to buildings. From the spectral residuals of our DOAS analysis we conclude that in polluted air masses, ToTaL-DOAS measurements are possible over very short distances in the range of several ten
me-25
ters.
Furthermore, using as reference the spectrum obtained from one of the targets, it is possible to apply the ToTaL-DOAS method to evaluate trace gas concentrations in the region between several far targets. Using a well suited set of targets, it will be easily
ACPD
8, 10257–10273, 2008 High spatial resolution measurements with ToTaL-DOAS E. Frins et al. Title Page Abstract Introduction Conclusions References Tables Figures ◭ ◮ ◭ ◮ Back Close Full Screen / Esc Printer-friendly VersionInteractive Discussion
possible to apply tomographic techniques and to retrieve trace gas distributions in two or three dimensions (Hartl et al., 2006; Hashmonay et al., 1999).
Also, since the radiance received by the Mini-DOAS instrument was sufficiently high, the acquisition times were short, ranging only between 1 and 3 min depending on the target. Thus, in addition to the spatial resolution of the method, a considerable temporal
5
resolution can be achieved. We measured temporal variation of NO2 mixing ratios
between 30 ppb and 65 ppb (±2 ppb) in a time interval of 45 min.
Acknowledgements. E. Frins acknowledges PEDECIBA-F´ısica (Project URU/06/004) for pro-viding partial financial support.
References 10
Bobrowski, N.: Volcanic Gas Studies by Multi Axis Differential Optical Absorption Spectroscopy, Doctoral Thesis, University of Heidelberg, Germany, 2005.
Bobrowski, N. and Platt, U.: SO2/BrO ratios studied in five volcanic plumes, J. Volcanol. Geotherm. Res., 166, 3–4, 147–160, doi:10.1016/j.jvolgeores.2007.07.003, 2007.
Burrows, J. P., Dehn, A., Deters, B., Himmelmann, S., Richter, A., Voigt, S., and Orphal, J.:
15
Atmospheric Remote-Sensing Reference Data from GOME: 2. Temperature-Dependent Ab-sorption Cross Sections of O3in the 231–794 nm Range, J. Quant. Spectrosc. Rad. Trans., 61, 509–517, 1999.
Collis, R. T. H.: Lidar: a new atmospheric probe, Q. J. Roy. Meteorol. Soc., 92, 220–230, 1966. Fernald, F. G.: Analysis of atmospheric LIDAR observations: Some comments, Appl. Optics,
20
23, 652–653, 1984.
Frins, E., Bobrowski, N., Platt, U., and Wagner, T.: Tomographic multiaxis-differential optical absorption spectroscopy observations of Sun-illuminated targets: a technique providing well-defined absorption paths in the boundary layer, Appl. Optics, 45, 6227–6240, 2006a. Frins, E., Bobrowski, N., Platt, U., and Wagner, T.: Thomographic MAX-DOAS Observations of
25
Sun Illuminated Targets: A New Technique Providing Well Defined Absorption Paths in the Boundary Layer or simply: Topographic Target Light scattering – DOAS ToTal – DOAS, Third International DOAS Workshop, Bremen, Germany, 2006b.
ACPD
8, 10257–10273, 2008 High spatial resolution measurements with ToTaL-DOAS E. Frins et al. Title Page Abstract Introduction Conclusions References Tables Figures ◭ ◮ ◭ ◮ Back Close Full Screen / Esc Printer-friendly VersionInteractive Discussion
Greenblatt G. D., Orlando, J. J., Burkholder, J. B., and Ravishankara, A. R.: Absorption mea-surements of oxygen between 330 and 1140 nm, J. Geophys. Res., 95, 18 577–18 582, 1990.
Hartl A., Song B. C., and Pundt, I.: 2-D reconstruction of atmospheric concentration peaks from horizontal long path DOAS tomographic measurements: parametrisation and geometry
5
within a discrete approach, Atmos. Chem. Phys., 6, 847–861, 2006,
http://www.atmos-chem-phys.net/6/847/2006/.
Hashmonay, R. A., Yost, M. G., and Wu, C. F.: Computed Tomography of Air Pollutants Using Radial Scanning Path-Integrated Optical Remote Sensing. Atmos. Environ., 33, 267–274, 1999.
10
Klett, J. D.: Stable analytical inversion solution for processing LIDAR returns, Appl. Optics, 20, 211–220, 1981.
Laepple, T., Knab, V., Mettendorf, K. U., and Pundt, I.: Longpath DOAS tomography on a mo-torway exhaust plume: Numerical studies and application to data from the BAB II campaign, Atmos. Chem. Phys., 4, 1323–1342, 2004,
15
http://www.atmos-chem-phys.net/4/1323/2004/.
Louban, I., P´ıriz, G., Platt, U., and Frins, E.: Differential Optical Absorption Spectroscopy (DOAS) using targets: SO2 and NO2 measurements in Montevideo city, AIP Conference Proceeding, 992, 21–26, RIAO/OPTILAS, 2007.
Pundt, I., Mettendorf, K.U., Laepple, T., Knab, V., Xie, P., L ¨osch, J., v. Friedeburg, C., Platt, U.,
20
and Wagner, T.: Measurements of trace gas distributions using long-path DOAS-tomography during the motorway campaign BAB II: Experimental setup and results for NO2, Atmos. En-viron., 39, 967–975, 2005.
Rothman, L.S., Jacquemart, D., Brown, L. R., Carleer, M., Gamache, R. R., et al.: The HITRAN 2004 Molecular Spectroscopic Database, J. Quant. Spectrosc. Rad. Transf., 96, 139–204,
25
2005.
Vandaele, A. C., Hermans, C., Simon, P. C., Carleer, M., Colin, R., Fally, S., M ´erienne, M.-F., Jenouvrier, A., and Coquart, B.: Measurements of the NO2 absorption cross section from 42 000 cm−1to 10 000 cm−1(238–1000 nm) at 220 K and 294 K, J. Quant. Spectrosc. Radiat. Transf., 59, 171–184, 1997.
30
Veitel, H., Kromer, B., M ¨oßner, M., and Platt, U.: New techniques for measurements of atmo-spheric vertical trace gas profiles using DOAS, Environ. Sci. Pollut. Res., 4, 17–26, 2002.
ACPD
8, 10257–10273, 2008 High spatial resolution measurements with ToTaL-DOAS E. Frins et al. Title Page Abstract Introduction Conclusions References Tables Figures ◭ ◮ ◭ ◮ Back Close Full Screen / Esc Printer-friendly VersionInteractive Discussion
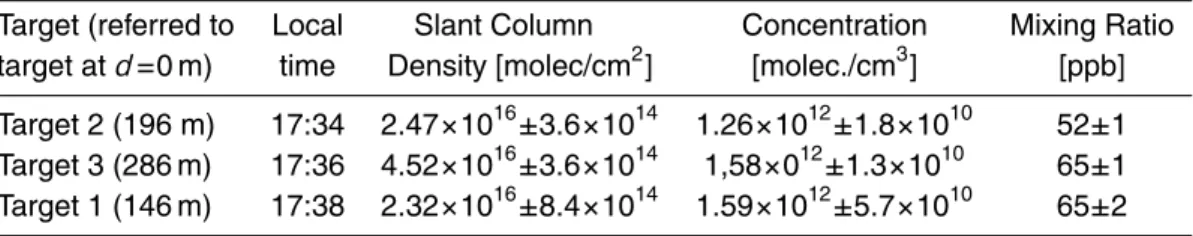
Table 1. Measured NO2mixing ratios.
Target (referred to Local Slant Column Concentration Mixing Ratio
target at d =0 m) time Density [molec/cm2] [molec./cm3] [ppb]
Target 2 (196 m) 17:34 2.47×10¹⁶±3.6×10¹⁴ 1.26×10¹²±1.8×10¹⁰ 52±1
Target 3 (286 m) 17:36 4.52×10¹⁶±3.6×10¹⁴ 1,58×012±1.3×10¹⁰ 65±1
ACPD
8, 10257–10273, 2008 High spatial resolution measurements with ToTaL-DOAS E. Frins et al. Title Page Abstract Introduction Conclusions References Tables Figures ◭ ◮ ◭ ◮ Back Close Full Screen / Esc Printer-friendly VersionInteractive Discussion
Fig. 1. (a) View of the site from above, taken fromwww.googleearth.com. The arrows indicate the position of targets 1, 2 and 3, respectively. The Mini-DOAS instrument is located at the origin of the arrows.
ACPD
8, 10257–10273, 2008 High spatial resolution measurements with ToTaL-DOAS E. Frins et al. Title Page Abstract Introduction Conclusions References Tables Figures ◭ ◮ ◭ ◮ Back Close Full Screen / Esc Printer-friendly VersionInteractive Discussion
ACPD
8, 10257–10273, 2008 High spatial resolution measurements with ToTaL-DOAS E. Frins et al. Title Page Abstract Introduction Conclusions References Tables Figures ◭ ◮ ◭ ◮ Back Close Full Screen / Esc Printer-friendly Version Interactive Discussion 430 440 450 460 0.015 0.025 0.035 400 420 440 460 0.010 0.020 0.030 O p ti ca l d e p th 360 380 400 420 440 460 Wavelength [nm] -0.05 0.05 0.15Fig. 2. Test analysis to find out the optimal spectral region for NO2evaluation against a piece of concrete.
ACPD
8, 10257–10273, 2008 High spatial resolution measurements with ToTaL-DOAS E. Frins et al. Title Page Abstract Introduction Conclusions References Tables Figures ◭ ◮ ◭ ◮ Back Close Full Screen / Esc Printer-friendly Version Interactive Discussion (a) S T (b) S TFig. 3. Different scenarios to be considered: (a) Emission cloud separated from the target (T)
ACPD
8, 10257–10273, 2008 High spatial resolution measurements with ToTaL-DOAS E. Frins et al. Title Page Abstract Introduction Conclusions References Tables Figures ◭ ◮ ◭ ◮ Back Close Full Screen / Esc Printer-friendly Version Interactive Discussion (c) S T (d) S TFig. 3. (c) Instrument (I) immersed in the emission cloud. (d) Target (T) and instrument (S) are
ACPD
8, 10257–10273, 2008 High spatial resolution measurements with ToTaL-DOAS E. Frins et al. Title Page Abstract Introduction Conclusions References Tables Figures ◭ ◮ ◭ ◮ Back Close Full Screen / Esc Printer-friendly Version Interactive Discussion 16:56 17:08 17:10 17:23 17:34 17:36 17:38 17:41 0 5 10 15 20 25 30 35 40 45 50 55 60 65 70 T2 T3 T1 T1 T1 T1 T1 T1 N O 2 MI XI N G R AT IO (p p b ) LOCAL TIMEFig. 4. Time evolution of the NO2mixing ratio. T1–T3 denote measurements with the instru-ment pointing to target 1, 2, and 3, respectively.