HAL Id: hal-00298178
https://hal.archives-ouvertes.fr/hal-00298178
Submitted on 27 Feb 2007HAL is a multi-disciplinary open access
archive for the deposit and dissemination of sci-entific research documents, whether they are pub-lished or not. The documents may come from teaching and research institutions in France or abroad, or from public or private research centers.
L’archive ouverte pluridisciplinaire HAL, est destinée au dépôt et à la diffusion de documents scientifiques de niveau recherche, publiés ou non, émanant des établissements d’enseignement et de recherche français ou étrangers, des laboratoires publics ou privés.
Increased aeolian activity during climatic regime shifts
as recorded in a raised bog in south-west Sweden during
the past 1700 years
R. de Jong, K. Schoning, Siwan Björck
To cite this version:
R. de Jong, K. Schoning, Siwan Björck. Increased aeolian activity during climatic regime shifts as recorded in a raised bog in south-west Sweden during the past 1700 years. Climate of the Past Discussions, European Geosciences Union (EGU), 2007, 3 (1), pp.383-408. �hal-00298178�
CPD
3, 383–408, 2007Increased aeolian activity during climatic regime shifts
R. de Jong et al. Title Page Abstract Introduction Conclusions References Tables Figures ◭ ◮ ◭ ◮ Back Close
Full Screen / Esc
Printer-friendly Version Interactive Discussion
EGU
Clim. Past Discuss., 3, 383–408, 2007 www.clim-past-discuss.net/3/383/2007/ © Author(s) 2007. This work is licensed under a Creative Commons License.
Climate of the Past Discussions
Climate of the Past Discussions is the access reviewed discussion forum of Climate of the Past
Increased aeolian activity during climatic
regime shifts as recorded in a raised bog
in south-west Sweden during the past
1700 years
R. de Jong1, K. Schoning2, and S. Bj ¨orck1
1
Geobiosphere Science Centre, Quaternary Sciences, Lund University, Sweden
2
Department of Physical Geography and Quaternary Geology, Stockholm University, Sweden Received: 19 February 2007 – Accepted: 21 February 2007 – Published: 27 February 2007 Correspondence to: R. de Jong (rixt.de [email protected])
CPD
3, 383–408, 2007Increased aeolian activity during climatic regime shifts
R. de Jong et al. Title Page Abstract Introduction Conclusions References Tables Figures ◭ ◮ ◭ ◮ Back Close
Full Screen / Esc
Printer-friendly Version Interactive Discussion
EGU
Abstract
Analyses of testate amoebae and aeolian sediment influx (ASI) were used to recon-struct effective humidity changes and aeolian activity in the coastal zone of south-west Sweden. Cores were taken from an ombrotrophic peat sequence from the Un-darsmosse bog. Since both types of analysis were carried out on the same core, a
5
direct comparison between humidity fluctuations in the bog and aeolian activity was possible, potentially providing detailed information on atmospheric circulation changes in this region. Relatively stable wet bog surface conditions occurred from 1500 to 1230 and 770 to 380 cal. yrs BP, whereas dry conditions dominated from 1630 to 1530, 1160 to 830 and 300 to 50 cal. yrs BP. The transitions between these phases occurred within
10
60–100 years. ASI peak events were reconstructed around 1450, 1150, 850 and af-ter 370 cal. yrs BP. Most inaf-terestingly, these aeolian activity peaks started during the recorded hydrological transitions, regardless of the direction of these shifts. Our re-sults therefore suggest that climatic regime shifts in this region were associated with temporary intensifications of atmospheric circulation during the past 1700 years.
Sev-15
eral ASI peaks apparently coincide with reduced solar activity, possibly suggesting a solar related cause for some of the observed events.
1 Introduction
Storm frequency and intensity in the coastal regions of north-west Europe are mainly controlled by the position of cyclone tracks in the North Atlantic. Since cyclones are
20
also the main source for precipitation in this region and exert a strong control on sum-mer and winter temperatures, the proximity of cyclone tracks and the intensity and frequency of generated storms form a major control on climate along the north-west European coastlines. To explain climatic changes occurring in this region therefore, information is needed on parameters that are related to climate, such as precipitation
25
pa-CPD
3, 383–408, 2007Increased aeolian activity during climatic regime shifts
R. de Jong et al. Title Page Abstract Introduction Conclusions References Tables Figures ◭ ◮ ◭ ◮ Back Close
Full Screen / Esc
Printer-friendly Version Interactive Discussion
EGU
rameters could lead to increased understanding of changes in atmospheric circulation in the North Atlantic region.
Study sites along the south-west coast of Sweden are ideally placed to register changes in atmospheric circulation patterns. Changes in effective humidity in north-west Europe have been reconstructed from peat bogs (e.g. Van Geel et al., 1996;
5
Hughes, 2000; Mauquoy et al., 2002a; Barber et al., 2003; Borgmark, 2005; Char-man et al., 2006). Ombrotrophic peat bogs in particular appear to be good archives for humidity changes, since these are entirely dependent on atmospheric water and therefore reflect changes in this parameter (Barber, 2003). Furthermore, lake studies in south-central Sweden using isotope analysis (Hammarlund et al., 2003; Sepp ¨a et al.,
10
2005) or stratigraphically based lake level reconstructions (Digerfeldt, 1988; Almquist-Jacobson, 1995) also provide estimates of effective humidity through time.
Storm frequency and intensity in Scandinavia have been reconstructed indirectly by studying the development of dune areas, in particular the timing of the onset of dune formation. However, other factors such as human impact and sea level variations
15
have also been mentioned as causes for dune formation (Clemmensen et al., 2001a,b; Clarke and Rendell, 2006). Dune development studies have been carried out along the western European coastline (e.g. Clemmensen et al., 2001a,b; Wilson et al., 2001, 2004; Clarke et al., 2002; Clarke and Rendell, 2006) and show broad agreement on the timing of dune development phases. A different approach to reconstruct aeolian
20
activity has been shown by Bj ¨orck and Clemmensen (2004), who studied two raised bog sites in south-west Sweden. They reconstructed the sand content of peat samples and interpreted these as a proxy for aeolian sediment transport (ASI), since minero-genic material could only have been transported to the centre of these bogs by wind. However, apart from climatic factors, human land use may also exert a control on ASI
25
by affecting sediment availability (De Jong et al., 2006).
For the area of north-west Europe there are thus a number of proxy records available on humidity and storminess changes. However, most records available from south Scandinavia focus on long term climatic trends. Not much is known about the short
CPD
3, 383–408, 2007Increased aeolian activity during climatic regime shifts
R. de Jong et al. Title Page Abstract Introduction Conclusions References Tables Figures ◭ ◮ ◭ ◮ Back Close
Full Screen / Esc
Printer-friendly Version Interactive Discussion
EGU
term fluctuations that occurred during more recent time. Furthermore, a comparison between the different datasets from dune areas, lakes and peat bogs is difficult due to inherent differences in dating methods and uncertainties in chronology. Therefore it is not easy to deduce the relation between the reconstructed climatic parameters directly. Here we present a study in which bog surface humidity fluctuations and aeolian
ac-5
tivity have been reconstructed from the same core from a raised bog site in south-west Sweden. Testate amoebae analysis was used to reconstruct relative changes of bog surface wetness status, and reflects the hydrological balance of the bog. ASI analy-sis was used to reconstruct aeolian sediment transport, a proxy for storm frequency and/or intensity. We show that during the past 1700 years major hydrological shifts
10
have been accompanied by increased aeolian activity in this region. We discuss the possible causes for this relation and the implications for the characteristics of atmo-spheric circulation during these shifts.
2 Site description
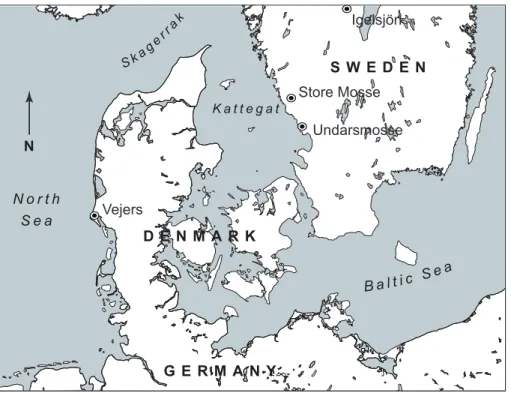
The Undarsmosse bog is situated on the coastal plain of Halland at 2.5 km from the
15
present coastline (Fig. 1). The beach areas and the coastal plain are characterised by beach ridges and extensive dune areas, wave reworked tills, moraine ridges and bedrock outcrops (P ˚asse, 1987; 1988). The study site is an ombrotrophic bog situated at 20 m above sea level. The areal extent of peat deposits is ca. 3.15 km2. The modern bog surface is, however, approximately only half that size due to extensive
20
peat cutting which started around AD 1925, when a deep drainage channel was dug along the eastern margins of the bog. However, historical records indicate that peat cutting had commenced already before that time (Adern, 1973). Cores were taken in the untouched part of the bog in the northern central part of the basin. Vegetation here is dominated by Sphagnum in the bottom layer and Calluna vulgaris and other
25
Ericaceae in the field layer. A detailed description of the Undarsmosse study site is provided in De Jong et al. (2006).
CPD
3, 383–408, 2007Increased aeolian activity during climatic regime shifts
R. de Jong et al. Title Page Abstract Introduction Conclusions References Tables Figures ◭ ◮ ◭ ◮ Back Close
Full Screen / Esc
Printer-friendly Version Interactive Discussion
EGU
2.1 Climatological setting
The province of Halland is strongly affected by westerlies, resulting in a mild oceanic climate with cool summers (16◦C July average temperature) and relatively mild winters
(–4◦C January average temperature). Annual precipitation is around 900 mm/yr and
the mean number of days with snow cover varies between 75 and 100 days (Raab
5
and Vedin, 1995). The weather is, however, extremely variable being controlled by the frequency, intensity and position of the passing cyclones. Analysis of geostrophic wind speeds in south Sweden from 1881 to 1997 shows that winds from a westerly direction dominated the wind spectrum entirely and the relative storm frequency was highest between October and March (Alexandersson et al., 1998; 2000; Nilsson et al.,
10
2004). These westerly storm winds are caused by cyclones passing north of Halland towards the east (J ¨onsson, 1994). Easterly winds of storm force occasionally occur when cyclones pass south of Halland, and are often associated with a high pressure field situated over northern Scandinavia. However, during the past century easterly storm winds (geostrophic wind speed >20 m s−1) have been very rare (Nilsson et al.,
15
2004).
3 Methods and material
Corings were carried out in the central part of the bog using a Russian peat sampler (7.5 cm Ø). The cores were taken from two parallel holes with sufficient overlapping to ensure full stratigraphic recovery. The cores were cut into 2 cm segments in the upper
20
meter of the core and 1 cm segments in the lower part. Each segment was sampled for ash-free organic bulk density (OBD), ignition residue (IR) and mineral grain content. Pollen analysis was carried out on samples from the entire core, as described in De Jong et al. (2006). Testate amoebae analysis was carried out on the upper 160 cm of the core at 29 levels. ASI was calculated at all levels. The upper 160 cm of peat
25
CPD
3, 383–408, 2007Increased aeolian activity during climatic regime shifts
R. de Jong et al. Title Page Abstract Introduction Conclusions References Tables Figures ◭ ◮ ◭ ◮ Back Close
Full Screen / Esc
Printer-friendly Version Interactive Discussion
EGU
peat around 19 cm depth. Below 160 cm depth a rapid transition to highly humified peat occurs. Details on sediment characteristics can be found in De Jong et al., 2006. 3.1 Testate Amoebae analysis
The testate amoebae sample preparation follows Charman et al. (2000) and Ly-copodium spores were added to the samples. At least 150 specimens from the 15 µm–
5
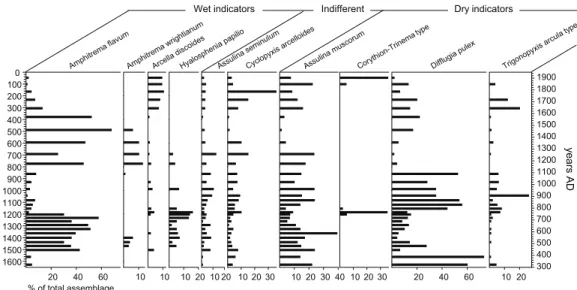
300 µm sieve residues were identified in each sample following the taxonomy of Grospi-etsch (1958) and Charman et al. (2000). The testate amoebae were divided in three hydrological groups: dry indicators, wet indicators and indifferent, based on their eco-logical wetness preferences (Table I). This division was applied in order to distinguish major changes in the wetness status of the bog surface. The wetness classification is
10
based on ecological information from Bobrov et al. (1999); Charman et al. (2000) and Charman et al. (2007).
3.2 ASI analysis
Ignition residues from all samples were analysed under a 50x zoom stereomicroscope. Quartz particles >125 µm were counted and divided into three grain-size classes; fine
15
sand (125–200 µm), medium sand (200–350 µm) and coarse sand (>350 µm). Maxi-mum grain-size was measured at all levels. Mineral grain influx values were calculated using the sample resolution provided by the age-depth model and volume measure-ments from each sample. ASI is expressed as the number of grains/cm2/yr. A detailed method description is provided in De Jong et al. (2006).
20
3.3 Chronology
The age-depth model for the studied core is provided in De Jong et al. (2006). Dating of the upper 160 cm of the core is based on five radiocarbon dates on ombrotrophic peat samples. The radiocarbon dates were calibrated using the IntCal04 calibration curve (Reimer et al., 2004) using the OxCal 3.10 program (Bronk Ramsey, 1995; Bronk
CPD
3, 383–408, 2007Increased aeolian activity during climatic regime shifts
R. de Jong et al. Title Page Abstract Introduction Conclusions References Tables Figures ◭ ◮ ◭ ◮ Back Close
Full Screen / Esc
Printer-friendly Version Interactive Discussion
EGU
Ramsey, 2001). All ages mentioned in this text refer to calendar years before 1950 (cal. yrs BP).
4 Results
4.1 Effective humidity
The reconstructed effective humidity changes (Fig. 2–3) are indicative of the
hydrologi-5
cal balance of the bog and its wetness status. Three periods with mainly dry conditions, from 1630 to 1530, 1160 to 830 and 300 to 50 cal. yrs BP, are recognised in the in-vestigated record (Fig. 3). During these periods the dominating testate amoebae are Difflugia pulex, Assulina muscorum and Trigonopyxis arcula type. Two periods with mainly wetter conditions in between the dry phases are also recognised: from 1500 to
10
1230 and 770 to 380 cal. yrs BP. During the wet phases the testate amoebae assem-blages are strongly dominated by Amphitrema flavum with Amphitrema wrightianum and Hyalosphenia papilio as most common associated species. The uppermost sam-ple (50 cal. yrs BP) is not reliable due to modern drainage of the bog.
In Fig. 3a the changes in testate amoebae assemblages have been summarized in
15
two curves reflecting the effective humidity changes. These show the alternating dom-inance of wet and dry indicator species. The curves are characterised by periods of 300–400 years of relatively stable conditions, followed by rapid (60–100 years) transi-tional phases (shaded areas in Fig. 3). The periods associated with stable conditions here may be used to define the timing and characteristics of known –and
debated-20
time periods such as the Little Ice Age (LIA), the Mediaeval Warm Anomaly (MWA), the Dark Ages Cold Period (DACP) and the Roman Optimum (RO). In Fig. 3 the timing and duration of these periods is shown as reconstructed from the testate amoebae data from this study.
The effective humidity reconstruction from this study has also been compared to
25
CPD
3, 383–408, 2007Increased aeolian activity during climatic regime shifts
R. de Jong et al. Title Page Abstract Introduction Conclusions References Tables Figures ◭ ◮ ◭ ◮ Back Close
Full Screen / Esc
Printer-friendly Version Interactive Discussion
EGU
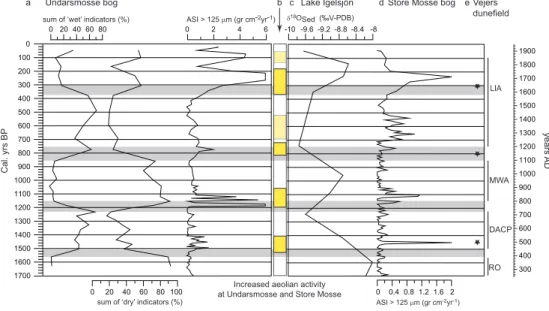
Sepp ¨a et al., 2005). Here isotopic variations of δ18Osedimentwere interpreted as a proxy for the ratio between precipitation and evaporation from the lake basin (Hammarlund et al., 2003). This reconstruction provides a proxy that is comparable to the testate amoe-bae wetness indicators from this study. Figure 3c shows that the variations observed at Undarsmosse bog are reflected at the Igelsj ¨on site, indicating that the humidity
fluctua-5
tions shown here apparently are of regional character. The timing of transitions to wet periods (1500 and 750 cal. yrs BP) recorded here are also coherent with “wet shifts” recorded in many European bog sites (e.g. Hughes et al., 2000; Barber et al., 2003 and references therein), as well as with the classic recurrence surfaces recognised by Granlund (1932) in south Swedish bogs.
10
4.2 Aeolian activity
The results from the ASI analysis from the Undarsmosse bog are shown in Fig. 3a. The ASI record is tentatively interpreted as a proxy for winter conditions (Bj ¨orck and Clemmensen, 2004). When bogs are frozen and snow covered, sand grains can be transported more easily over the otherwise irregular bog surface. Snow drifting, or
15
niveo-aeolian transport, would greatly facilitate the transport of large sand grains over the bog surface. Since the grainsizes under consideration here (>125 µm) are gen-erally transported as bedload (Tsoar and Pye, 1987), thus saltating or creeping, it is difficult to explain the occurrence of these grains in the central part of large bogs oth-erwise. So, although exceptional wind speeds may transport medium size grains over
20
some distance during all seasons, the majority of the sand grains have most likely been transported under niveo-aeolian conditions (cf Dijkmans, 1990; Lewkowicz, 1998).
In Fig. 3a the results are shown for ASI influx at Undarsmosse bog, including all sand grains >125 µm for the last 1700 years. For comparison the ASI data from the Store Mosse bog (Fig. 3d) and the timing of onset of dune development at Vejers
25
dunefield, west Denmark (Figs. 1 and 3e), are also shown (Clemmensen et al. 2001a, 2006). The timing of ASI peaks at the two bog sites is remarkably similar despite
CPD
3, 383–408, 2007Increased aeolian activity during climatic regime shifts
R. de Jong et al. Title Page Abstract Introduction Conclusions References Tables Figures ◭ ◮ ◭ ◮ Back Close
Full Screen / Esc
Printer-friendly Version Interactive Discussion
EGU
the different settings of each site and the distance between them of ca. 60 km (Fig. 1). Small differences in timing of the events are well within the range of dating errors. Peak events are recorded from 1500–1400, 1180–1100, 850–700 and after 370 cal. yrs BP. The largest peaks occur around 1150 and 250 cal. yrs BP. However, since these peaks take place at a transition to dry conditions (Sect. 5.2) it is not possible to obtain certainty
5
on the precise duration or the amplitude of these specific ASI peaks. It is known that the increase in peat humification at the transitions to generally dry conditions compacts the peat and also leads to a secondary decomposition (Tipping, 1995; Borgmark and Schoning, 2006). The age-depth model does not reflect such short-term fluctuations in peat accumulation, and the duration as well as the amplitude of these peaks may thus
10
be overestimated. In addition, it is important to realise that peak ASI periods may be caused by a limited number of severe storms.
A comparison to the initiation of dune activity at Vejers dunefield shows many appar-ently simultaneous events (Fig. 3e). Together the curves from Halland and the record from Vejers dunefield suggest that the reconstructed peak periods reflect increased
ae-15
olian sediment transport, at least on a regional scale. This could be related to changing land use, affecting sediment availability, or climatic factors controlling storm frequency and/or intensity. Unfortunately it is not possible to deduce the dominant wind direction directly during ASI peak events. The mineral composition of the sand is homogenous (quartz) and available in all wind directions. However, the simultaneous onset of dune
20
development may indicate that these ASI peaks are related to westerly wind conditions, although dune re-activation phases may be more related to summer conditions. Before a hypothesis on the occurrence and timing of the ASI peaks and humidity shifts can be formulated, the role of human land use has to be looked at since this potentially exerts a major control on sediment availability (Li et al., 2004).
25
4.3 Human land use and aeolian sediment transport
Pollen analysis at the Undarsmosse site has shown that landscape opening increased strongly after 2800 cal. yrs BP (de Jong et al., 2006). As a result, both ASI peak
CPD
3, 383–408, 2007Increased aeolian activity during climatic regime shifts
R. de Jong et al. Title Page Abstract Introduction Conclusions References Tables Figures ◭ ◮ ◭ ◮ Back Close
Full Screen / Esc
Printer-friendly Version Interactive Discussion
EGU
amplitudes and the level of “back ground noise” increased. This suggests that after 2800 cal. yrs. BP sediment availability was not a limiting factor for aeolian transport to take place. Detailed comparison between the ASI curves from this study and the Store Mosse bog (Fig. 3) and their respective pollen diagrams (de Jong et al., 2006; unpublished data) do not show a clear link to human land use at the time of ASI peak
5
events. During the past 1700 years ASI peaks at Undarsmosse bog appear to have been occasionally preceded and followed by an increase in grassland (see De Jong et al., 2006, Fig. 3). A comparison to agricultural activity shows the same results, with in-creases and dein-creases of agricultural indicators seemingly independent of ASI peaks and climatic transitions.
10
Although land use changes do not appear to explain the timing of the ASI peaks and can therefore not be the main factor causing them, the amplitude of ASI peaks may be increased by land use. The very high ASI peak around 1150 cal. yrs BP was preceded by extensive agricultural activities, whereas these decreased strongly during the ASI peak; the peak was followed by a strong increase in grassland (De Jong
15
et al., 2006; unpublished data). These results suggest that agricultural land areas were abandoned during the peak event and were subsequently overgrown by a grass dominated vegetation. Whether the ASI peak and the associated climatic events were the cause for this land abandonment will not be discussed here (see e.g. Berglund, 2003), but in any case it resulted in temporarily increased sediment availability. This
20
may explain the large amplitude of the ASI peak event around 1150 cal. yrs BP. The high ASI peaks after 370 cal. yrs BP occurred simultaneous with an increase in grassland and agricultural land areas. However, since similar earlier increases in land use did not result in high sand influx, land use changes are not thought to be the driving force behind these ASI peaks either and a climatic forcing of the ASI peak events is inferred.
25
The strong increase of ploughed and grazed land areas has undoubtedly contributed to the higher amplitude and long duration of the peaks recorded here though.
CPD
3, 383–408, 2007Increased aeolian activity during climatic regime shifts
R. de Jong et al. Title Page Abstract Introduction Conclusions References Tables Figures ◭ ◮ ◭ ◮ Back Close
Full Screen / Esc
Printer-friendly Version Interactive Discussion
EGU
5 Discussion
In Fig. 3a the ASI data and effective humidity reconstruction from the Undarsmosse bog are compared. Since samples were taken from the same cores a direct comparison between the timing of events is possible. The results show that shifts in humidity are accompanied by increased aeolian activity regardless of the direction of the shift. A
5
possible exception is the ASI maximum recorded after ca. 370 cal. yrs BP. Although the increase of ASI starts at the transition from wet to dry conditions, the largest part of the peak falls within the period after the transition.
5.1 Humidity shifts and atmospheric circulation changes
The hydrological balance of the bog and its wetness status mainly depend on
evap-10
otranspiration and the amount of precipitation reaching the bog surface. The climate parameters governing the bog surface wetness seem to be different in different geo-graphical regions and climatic settings (Charman et al., 2004; Schoning et al., 2005). Here, wet conditions are interpreted as a result of low summer temperatures with low evaporation and high precipitation, whereas dry conditions most likely reflect warmer
15
summers with high evaporation rates and low precipitation. Cool and wet conditions in this region are related to oceanic conditions with frequent passage of cyclones, thus a dominance of oceanic westerly air masses. Such a situation indicates that circulation is predominantly zonal (J ¨onsson, 1994). Winters may have been mild and wet and pos-sibly dominated by an NAO+type of circulation (Hurrell, 1995). Warm and dry summer
20
conditions in south-west Scandinavia dominate when cyclone frequency is low. Such a situation is associated with a general dominance of continental conditions and high air pressures over the study area. This implies that meridional air flow intensified, causing a more frequent occurrence of “blocking situations”.
Thus, the effective humidity data indicate that throughout the past 1700 years the
cli-25
matic conditions fluctuated between two dominant climatic regimes. Zonal circulation and oceanic conditions dominated between ca. 1500 and 1230 cal. yrs BP and from
CPD
3, 383–408, 2007Increased aeolian activity during climatic regime shifts
R. de Jong et al. Title Page Abstract Introduction Conclusions References Tables Figures ◭ ◮ ◭ ◮ Back Close
Full Screen / Esc
Printer-friendly Version Interactive Discussion
EGU
770–380 cal. yrs BP, during the inferred DACP and the first part of the LIA as recon-structed at the Undarmosse site. The relatively dry conditions occurring before 1530 and from 1160–830 cal. yrs BP are associated with warm, dry summers and appear to reflect warmer continental conditions associated with the MWA and RO. It is known though that the timing, duration and intensity of these climatic events differ widely
5
(Jones and Briffa, 2001; Ogilvie and Jonsson, 2001; Bradley et al, 2002). The LIA as defined in Fig. 3 is divided in two main phases; a wet first phase starting at 770 cal. yrs BP and a dry phase during the most severe part of the LIA from 300–50 cal. yrs BP. This is in agreement with e.g. Maasch et al. (2005), who also found a two-fold division of the LIA.
10
The most recent dry phase (300 to 50 cal. yrs BP) is represented by fluctuating but dry conditions, suggesting predominantly continental conditions with warm and dry summers. However, many studies indicate severe conditions with very cold winters but also decreased summer temperatures during some parts of the time period (e.g. Briffa, 1992; Lamb, 1995; Bradley et al., 2002; Mauquoy et al., 2002). A decrease of summer
15
temperatures, however, would be expected to lead to higher bog surface wetness due to lower evaporation rates. The dry conditions at this time period therefore imply low precipitation. The cooling of both summer and winter temperatures during this time pe-riod has been associated with processes related to reduced solar activity (e.g. Shindell et al., 2001; Bond et al., 2001; Mauquoy et al., 2002b), increased volcanic activity (e.g.
20
Briffa et al., 1998; Crowley, 2000) and even reduced greenhouse gas emissions due to a steep population decrease in the Americas (Ruddiman, 2006).
The interpretation of effective humidity in terms of long term changes in dominant at-mospheric flow type does not imply that flow patterns were stable during these climatic regimes. Short term atmospheric and climatic changes such as those reconstructed by
25
e.g. tree ring reconstructions from northern Fennoscandia (Briffa et al., 1992; Grudd et al., 2002) and modelling studies (Moberg et al., 2005; Gouirand et al., 2006) certainly took place, but due to the sample resolution in this study short lasting changes are not recorded in our data much. Our data indicate, however, that long term changes in the
CPD
3, 383–408, 2007Increased aeolian activity during climatic regime shifts
R. de Jong et al. Title Page Abstract Introduction Conclusions References Tables Figures ◭ ◮ ◭ ◮ Back Close
Full Screen / Esc
Printer-friendly Version Interactive Discussion
EGU
dominant circulation mode occurred and that the change from one dominant regime to the next took place within 100 years.
5.2 Aeolian activity peaks and atmospheric circulation changes
Humidity variations recorded at the Undarsmosse site thus appear to be related to long term fluctuations of the dominant climatic regime. Most interestingly, ASI peak events
5
start during these regime shifts and continue for some decades into the next climatic regime (Fig. 3), indicating that the conditions during these transitions were exceptional in several ways; storms were more frequent, stronger and/or more erosive than storms associated with the more stable dry or wet conditions in between.
Because the majority of ASI peaks occurs during or immediately after a climatic shift,
10
a causal relation between the two types of records is suggested. A tentative hypoth-esis for the occurrence of ASI peaks during climatic shifts is that the intensification of atmospheric circulation could be a result of the regime shift itself. A large scale al-teration of the general atmospheric set-up may cause increased atmospheric mixing, since air pressure contrasts could be large during a period of atmospheric
reorgani-15
zation. This hypothesis implies that climatic shifts could lead to temporarily increased aeolian activity in our study area regardless of the direction of the change. If correct, this hypothesis may also imply that the increased stormy conditions in the North Sea region between AD 1960–1990 could be directly related to the rapid climatic warming that is observed during the last few decades (Furevik and Nilsen, 2005). However, the
20
relatively long duration of the ASI peaks (ca. 30 to 100 yrs) could be used as an argu-ment against this hypothesis; atmospheric circulation changes are known to be among the most rapid processes in the climate system. In a detailed GISP2 ice core record of the last 1000 years a conspicuous peak of Na+ concentration is recorded between AD 1921 and 1925 (Dawson et al., 2003), reflecting strongly increased storm activity at
25
a climatic transition from very cold conditions to the post AD 1927 amelioration at the GISP2 site. The authors suggest that this “termination” may represent the end of the atmospheric circulation associated with the LIA. Although these results thus point to a
CPD
3, 383–408, 2007Increased aeolian activity during climatic regime shifts
R. de Jong et al. Title Page Abstract Introduction Conclusions References Tables Figures ◭ ◮ ◭ ◮ Back Close
Full Screen / Esc
Printer-friendly Version Interactive Discussion
EGU
similar link as hypothesized here, the Na+ peak only lasted for four years. However, if the analogue to present day conditions is valid, it is also possible that the duration of periods with increased westerlies (ca. three to four decades; Alexandersson et al., 1998; Siegismund and Schrum, 2001; Furevik and Nilsen, 2005) is longer at lower latitudes than in Greenland.
5
An alternative explanation is based on the assumption that climatic shifts are not causally related to ASI peaks. Decadal scale atmospheric circulation changes in north-west Europe could be related to the extent of sea ice in the Greenland Sea (e.g. Daw-son et al., 2002; Smith et al., 2003). Oceanic processes are also related to sea ice extent, and possibly act as a slow mechanism affecting atmospheric circulation on
10
longer time scales. As a consequence of extensive sea ice cover in the Greenland Sea a southward shift of the Polar front occurs, since high air pressures develop over an ice covered sea. This southward shift of the Polar Front would lead to strongly increased temperature and pressure gradients over the North Atlantic, causing a southward shift of the cyclone track (Dawson et al., 2002) and increased snowfall over Scandinavia
15
(Smith et al., 2003).
A modelling study of cyclones during the Maunder Minimum (MM, AD 1640–1715) shows that fewer cyclones occurred in northern Europe, but the intensity of the extreme cyclones increased (Raible et al., 2006). These authors suggest that the temperature gradient was higher, particularly in the North Atlantic region where sea-ice extended
20
further south. Increased cyclone intensity may thus explain the occurrence of ASI peak values during the MM. The extent of the sea ice in the Greenland Sea and the asso-ciated position of the Polar Front appear to have been important factors determining winter storminess at our study site during the second phase of the Little Ice Age. Un-fortunately there are no records on the extent of sea ice covering the entire time period
25
from 1700 cal. yrs BP to present, and therefore it is not known whether the mechanism modelled during the ASI peak in the MM can be applied to earlier ASI peaks.
So, we argue that a southward extension of the Polar Front, possibly due to extended sea ice, would result in increased westerly storm intensities on a regional scale, which
CPD
3, 383–408, 2007Increased aeolian activity during climatic regime shifts
R. de Jong et al. Title Page Abstract Introduction Conclusions References Tables Figures ◭ ◮ ◭ ◮ Back Close
Full Screen / Esc
Printer-friendly Version Interactive Discussion
EGU
could have produced the ASI peaks. As an alternative or additional factor the cli-matic regime shift itself - whether or not accompanied by increased sea ice - may have caused increased storminess. The causes for the climate regime shifts are, however, unknown. On a longer time scale, 6500 yrs, ASI peaks in our study area appear to coincide with periods of low solar irradiance (De Jong et al., 2006). However, many
5
ASI peaks and climatic regime shifts do not coincide with reduced solar irradiance and therefore solar forcing can not be the only or main cause for the patterns reconstructed here. An alternative explanation may be that internal climatic oscillations, possibly re-lated to oceanic processes, are the real cause for the climatic regime shifts we record here. A study by Renssen et al. (2006) shows that shifts in oceanic circulation modes
10
are more likely to occur during periods of reduced solar irradiance, but take place also in the absence of solar forcing. This would explain why not all solar irradiance lows are recorded as a climatic change. Our data seem to suggest a two-mode system, with major shifts occurring every 300–400 years, sometimes coinciding with reduced solar irradiance, but also during periods with normal solar forcing.
15
6 Conclusions
The direct comparison between testate amoebae inferred bog surface wetness changes and ASI has provided detailed information about the link between two impor-tant climatic variables; effective humidity and storminess. The patterns reconstructed here are distinct and in good agreement with studies from the Store Mosse bog, Vejers
20
dunefield and Lake Igelsj ¨on, indicating that the patterns reflect regional scale changes. Climatic anomalies associated with the LIA, MWA, DACP and RO are reflected in the Undarsmosse bog as periods with relatively stable dry and warm or wet and cool sum-mer conditions. These are associated with a dominance of continental and oceanic air-masses, respectively. The LIA appears to be divided into two main phases; an early
25
phase dominated by zonal flow and oceanic conditions from 770 to 380 cal. yrs BP, and a later phase dominated by meridional flow and frequent atmospheric blocking from
CPD
3, 383–408, 2007Increased aeolian activity during climatic regime shifts
R. de Jong et al. Title Page Abstract Introduction Conclusions References Tables Figures ◭ ◮ ◭ ◮ Back Close
Full Screen / Esc
Printer-friendly Version Interactive Discussion
EGU
300 to ca. 50 cal. yrs BP. Local hydrological conditions varied on a minor scale during the hydrological stable time periods, but shifts in the dominant climatic mode triggered relatively rapid responses of the bog surface hydrology and caused an almost complete transition of the testate amoebae species composition.
The climatic causes of the ASI peaks are as of yet not well understood, but indicate
5
strong atmospheric contrasts. We hypothesize that peak events may be related to the position of the Polar Front and sea ice expansion in the Greenland Sea. Furthermore, a causal link between ASI peaks and the climatic regime shifts recorded at Undarsmosse bog is suggested. Solar forcing may have been an indirect forcing factor during some of the peak events, but not all. Human land use changes probably altered aeolian peak
10
amplitudes by controlling sediment availability.
Future research should focus on the potential relation between cyclone activity and climatic regime shifts. Modern measurement data as well as modelling studies may help to understand the processes causing increased stormy conditions during periods of climatic change. Such studies are planned for the near future. If climatic shifts
15
are indeed causally related to increased storm activity in this region, extremely severe winter storms such as those recorded in south-west Sweden in January 2005 and January 2007 may become more common as climate continues to change.
Acknowledgements. This study is part of R. de Jong’s PhD thesis (Lund University).
Discus-sions with L. Clemmensen (Copenhagen University) and D. Hammarlund (Lund University)
20
were greatly appreciated.
References
Adern, N. E.: Harplinge hembygds och fornminnesfrening: Harplinge, en bok om hembygden. 2nd edition, Laholm, 491 p, 1973.
Alexandersson, H., Schmith, T., Iden, K., and Tuomenvirta, H.: Long-term variations of the
25
storm climate over NW Europe. Glob Atmos Ocean Syst, 6, 97–120, 1998.
Alexandersson, H., Tuomenvirta, H., and Iden, K.: Trends of storms in NW Europe derived from an updated pressure data set. Clim. Res., 14, 71–73, 2000.
CPD
3, 383–408, 2007Increased aeolian activity during climatic regime shifts
R. de Jong et al. Title Page Abstract Introduction Conclusions References Tables Figures ◭ ◮ ◭ ◮ Back Close
Full Screen / Esc
Printer-friendly Version Interactive Discussion
EGU Almquist–Jacobson, H.: Lake-level fluctuations at Ljustj ¨arnen, central Sweden and their
impli-cations for the Holocene climate of Scandinavia. Paleogeogr. Paleoclimatol. Paleoecol., 118, 269–290, 1995.
Barber, K. E., Chambers, F. M., and Maddy, D.: Holocene palaeoclimates from peat stratig-raphy: macrofossil proxy climate records from three oceanic raised bogs in England and
5
Ireland, Quat. Sci. Rev., 22, 521–539, 2003.
Berglund, B. E.: Human impact and climate changes – synchronous events and a causal link?, Quat. Int., 105, 7–12, 2003
Bj ¨orck, S. and Clemmensen, L. B.: Aeolian sediment in raised bog deposits, Halland, SW Swe-den: a new proxy record for winter storminess variation in southern Scandinavia?, Holocene,
10
14, 677–688,2004.
Bobrov, A. A., Charman, D. J., and Warner, B. G.: Ecology of testate amoebae from oligotrophic peatlands: Specific features of polytypic and polymorphic species, Biology Bulletin, 29, 605– 617, 1999.
Bond, G., Kromer, B., Beer, J., Muscheler, R., Evans, M. N., Showers, W., Hoffmann, S.,
Lotti-15
Bond, R., Hajdas, I., and Bonani, G.: Persistent solar influence on North Atlantic climate during the Holocene, Science, 294, 2130–2135, 2001.
Borgmark, A.: Holocene climate variability and periodicities in south-central Sweden, as inter-preted from peat humification analysis, Holocene, 15, 387–395, 2005.
Borgmark, A. and Schoning, K.: A comparative study of peat proxies from two eastern central
20
Swedish bogs and their relation to meteorological data, J. Quat. Sci., 21, 109–114, 2006. Bradley, R. S., Briffa, K. R., Cole, J., Hughes, M. K., and Osborn, T. J.: The climate of the last
Millennium, in: Paleoclimate, global change and the future, edited by: K. Alverson , Springer, 2002.
Briffa, K. R., Jones, P. D., Schweingruber, F. H., and Osborn, T. J.: Influence of volcanic
erup-25
tions on Northern Hemisphere summer temperature over the past 600 years, Nature, 393, 450–455, 1998.
Briffa, K. R., Jones, P. D., Bartholin, T. S., Eckstein, D., Schweingruber, F. H., Karlen, W., Zetter-berg, P., and Eronen, M.: Fennoscandian summers from AD 500: temperature changes on short and long timescales, Clim. Dyn., 7, 111–119, 1992.
30
Bronk Ramsey, C.: Radiocarbon calibration and analysis of stratigraphy: the OxCal program, Radiocarbon, 37, 425–430, 1995.
CPD
3, 383–408, 2007Increased aeolian activity during climatic regime shifts
R. de Jong et al. Title Page Abstract Introduction Conclusions References Tables Figures ◭ ◮ ◭ ◮ Back Close
Full Screen / Esc
Printer-friendly Version Interactive Discussion
EGU 363, 2001.
Charman, D. J., Blundell, A., and Accrotelm members: A new European testate amoebae transfer function for palaeohydrological reconstruction on ombrotrophic peatlands, J. Quat. Sci, 22, 209–221, 2007.
Charman, D. J., Blundell, A., Chiverell, R. C., Hendon, D., and Langdon, P. G.: Compilation of
5
non-annually resolved Holocene proxy climate records: stacked Holocene peatland palaeo-water table reconstructions from northern Britain. Quat. Sci. Rev., 25, 336–350, 2006. Charman, D. J., Brown, A. D., Hendon, D., and Karofeld, E.: Testing the relationship between
Holocene peatland palaeoclimate reconstructions and instrumental data at two European sites, Quat. Sci. Rev., 23, 137–143, 2004.
10
Charman, D. J., Hendon, D., and Woodland, W. A.: The identification of testate amoebae
(Pro-tozoa: Rhizopoda) in peats, QRA Technical Guide No. 9, Quaternary Research Association,
London. 147 pp, 2000.
Clarke, M. L., Rendell, H., Tastet, J. P., Clave, B., and Masse, L.: Late-Holocene sand invasion and North Atlantic storminess along the Aquitaine coast, south-west France, Holocene, 12,
15
231–238, 2002.
Clarke, M. L. and Rendell, H. M.: Effects of storminess, sand supply and the North Atlantic Oscillation on sand invasion and coastal dune accretion in western Portugal, Holocene, 16, 341–355, 2006.
Clemmensen, L. B., Pye, K., Murray, A., and Heinemeier, J.: Sedimentology, stratigraphy and
20
landscape evolution of a Holocene coastal dune system, Lodbjerg, NW Jutland, Denmark, Sedimentology, 48, 3–27, 2001a.
Clemmensen, L. B., Murray, A. S., Bech, J.-J., and Clausen, A.: Large-scale aeolian sand movement on the west coast of Jutland, Denmark in late Subboreal to early Subatlantic time – a record of climate change or cultural impact? GFF, 123, 193–220, 2001b.
25
Clemmensen, L. B., Pedersen, K., Murray, A., and Heinemeier, J.: A 7000-year record of coastal evolution, Vejers, SW Jutland, B. Geol. Soc. Denmark, 53, 1–22, 2006.
Crowley, T. J.: Causes of climate change over the past 1000 years, Science, 289, 270–277, 2000.
Dawson, A. G., Hickey, K., Holt, T., Elliott, L., Dawson, S., Foster, I. D. L., Wadhams, P.,
Jons-30
dottir, I., Wilkinson, J., McKenna, J., Davis, N. R., and Smith, D. E.: Complex North Atlantic Oscillation (NAO) index signal of historic North Atlantic storm-track changes, Holocene, 12, 363–369, 2002.
CPD
3, 383–408, 2007Increased aeolian activity during climatic regime shifts
R. de Jong et al. Title Page Abstract Introduction Conclusions References Tables Figures ◭ ◮ ◭ ◮ Back Close
Full Screen / Esc
Printer-friendly Version Interactive Discussion
EGU Dawson, A. G., Elliott, L., Mayewski, P., Lockett, P., Noone, S., Hickey, K., Holt, T., Wadhams,
P., and Foster, I.: Late-Holocene North Atlantic climate “seesaws”, storminess changes and Greenland ice sheet (GISP2) palaeoclimates, Holocene, 13, 381–392, 2003.
De Jong, R., Bj ¨orck, S., Bj ¨orkman, L., and Clemmensen, L. B.: Storminess variation during the last 6500 years as reconstructed from an ombrotrophic peat bog in Halland, south-west
5
Sweden, J. Quat. Sci., 21, 905–919, 2006.
Dijkmans, J. W. A.: Niveo-aeolian sedimentation and resulting sedimentary structures; Sondre Stromfjord area, western Greenland, Permafrost Periglacial process, 83–96, 1990.
Digerfeldt, G.: Reconstruction and regional correlation of Holocene lake-level fluctuations in lake Bysj ¨on, south Sweden, Boreas, 17, 165–182, 1988.
10
Furevik, T. and Nilsen, J. E.Ø.: Large-scale atmospheric circulation variability and its impact on the nordic seas ocean climate - a review, in: The Nordic Seas: an integrated perspec-tive, edited by: Drange, H., Dokken, T., Furevik, T., Gerder, R., Berger, W., Geophysical monograph, series 158, American Geophysical union, Washington DC, pp 105–136, 2005. Granlund, E.: De Svenska h ¨ogmossarnas geologi. Deras bildningsbetingelser,
utvecklingshis-15
toria och utbredning j ¨amte sambandet mellan h ¨ogmossebildning och f ¨orsumpning. Sveriges Geologiska Unders ¨okning , C, 373, 1932.
Grospietsch, Th.: Wechseltierchen (Rhizopodon), Einf ¨uhrung in die Kleinlebewelt, Kosmos. Stuttgart, 1958.
Gouirand, I., Moberg, A., and Zorita, E.: Climate variability in Scandinavia for the past
mil-20
lennium simulated by an atmosphere-ocean general circulation model, Tellus, 59A, 30–49, 2007.
Grudd, H., Briffa, K. R., Karlen, W., Bartholin, T. S., Jones, P. D., and Kromer, B.: A 7400-year tree ring chronology in northern Swedish Lapland: natural climatic variability expressed on annual to millennial timescales, Holocene, 12, 657—665, 2002.
25
Hammarlund, D., Bj ¨orck, S., Buchardt, B., Israelson, C., and Thomsen, C. T.: Rapid hydrological changes during the Holocene revealed by stable isotope records of lacustrine carbonates from lake Igelsj ¨on, southern Sweden, Quat. Sci. Rev., 22, 353–370, 2003.
Hughes, P. D. M., Mauquoy, D., Barber, K. E., and Langdon, P. G.: Mire-development pathways and palaeoclimatic records from a full Holocene peat archive at Walton Moss, Cumbria,
30
England, Holocene, 10, 467–479, 2000.
Hurrell, J. W.: Decadal Trends in the North-Atlantic Oscillation - Regional Temperatures and Precipitation, Science, 269, 676–679, 1995.
CPD
3, 383–408, 2007Increased aeolian activity during climatic regime shifts
R. de Jong et al. Title Page Abstract Introduction Conclusions References Tables Figures ◭ ◮ ◭ ◮ Back Close
Full Screen / Esc
Printer-friendly Version Interactive Discussion
EGU Jiang, H., Eiriksson, J., Schulz, M., Knudsen, M.-L., and Seidenkrantz, M.-S.: Evidence of solar
forcing of sea-surface temperature on the North Icelandic shelf during the late Holocene, Geology, 33, 73–76, 2005.
Jones, P. D. and Briffa, K. R.: The “Little Ice Age”: local and global perspectives, Clim. Change, 48, 5–8, 2001.
5
J ¨onsson, P. and B ¨arring, L.: Zonal index variations, 1899–1992: links to air temperature in southern Scandinavia, Geogr. Ann. Ser. A-Phys. Geogr., 76, 207–219, 1994.
Lamb, H. H.: Climate, history and the modern world, Routledge, London, 1995.
Lewkowicz, A. G.: Aeolian sediment transport during winter, Black Top Creek, Fosheim Penin-sula, Ellesmere Island, Canadian Arctic, Permafrost Periglacial Process, 9, 35–46, 1998.
10
Li, X. Y., Liu, L. Y., and Wang, J. H.: Wind tunnel simulation of aeolian sandy soil erodibility under human disturbance, Geomorphology, 59, 3–11, 2004.
Maasch, K. A., Mayewski, P. A., Rohling, E. J., Stager, J. C., Karlen, W., Meeker, L. D., and Meyerson, E. A.: A 2000-year context for modern climate change, Geogr. Ann. Ser. A-Phys. Geogr., 87, 7–15, 2005.
15
Mauquoy, D., Engelkes, T., Groot, M. H. M., Markesteijn, F., Oudejans, M. G., van der Plicht, J., and Van Geel, B.: High-resolution records of the late-Holocene climate change and carbon accumulation in two north-west European ombrotrophic peat bogs, Paleogeogr. Paleoclima-tol. Paleoecol., 186, 275–310, 2002.
Mauquoy, D., Van Geel, B., Blaauw, M., and Van der Plicht, J.: Evidence from north-west
20
European bogs shows “Little Ice Age” climatic changes driven by variations in solar activity, Holocene, 12, 1–6, 2002.
Moberg, A., Sonechkin, D. M., Holmgren, K., Datsenko, N. M., and Karlen, W.: Highly variable Northern Hemisphere temperatures reconstructed from low – and high-resolution proxy data, Nature, 433, 613–617, 2005.
25
Nilsson, C., Stjernquist, I., B ¨arring, L., Schlyter, P., J ¨onsson, A. M., and Samuelsson, H.: Recorded storm damage in Swedish forests 1901–2000, For. Ecol. Manage., 199, 165–173, 2004.
Ogilvie, A. E. J. and Jonsson, T.: “Little Ice Age” research: a perspective from Iceland, Clim. Change, 48, 9–52, 2001.
30
P ˚asse, T.: Jordartskartan Varberg SO/Ullared SV, Serie Ae 86, 1: 50 000 (Quaternary map of Varberg SO/Ullared SV) OffsetCenter AB, Uppsala, 1987.
CPD
3, 383–408, 2007Increased aeolian activity during climatic regime shifts
R. de Jong et al. Title Page Abstract Introduction Conclusions References Tables Figures ◭ ◮ ◭ ◮ Back Close
Full Screen / Esc
Printer-friendly Version Interactive Discussion
EGU map of Varberg SO/Ullared SV), Uppsala, 98 p, 1988.
Raab, B. and Vedin, H.: Sveriges Nationalatlas. Bokf ¨orlaget Bra B ¨ocker, H ¨ogan ¨as, 1995. Raible, C. C., Yoshimori, M., Stocker, T. F., and Casty, C.: Extreme midlatitude cyclones and
their implications for precipitation and wind speed extremes in simulations of the Maunder Minimum versus present day conditions, Clim. Dyn., 28, 409–423, 2007.
5
Reimer, P., Baillie, M., Bard, E., Bayliss, A., Beck, J., Bertrand, C., Blackwell, P., Buck, C., Burr, G., Cutler, K., Damon, P., Edwards, R., Fairbanks, R., Friedrich, M., Guilderson, T., Hogg, A., Hughen, K., Kromer, B., McCormac, G., Manning, S., Ramsey, C.B., Reimer, R., Remmele, S., Southon, J., Stuiver, M., Talamo, S., Taylor, F., Van der Plicht, J., and Weyhenmeyer, C.: IntCal04 Terrestrial Radiocarbon Age Calibration, 0–26 cal Kyr BP, Radiocarbon, 46, 1029–
10
1058, 2004.
Renssen, H., Goosse, H., and Muscheler, R.: Coupled climate model simulation of Holocene cooling events; oceanic feedback amplifies solar forcing, Clim. Past., 2, 79–90, 2006. Ruddiman, W. F.: Plows, plagues and petroleum – how humans took control of climate,
Prince-ton University Press, New Jersey, 2005.
15
Schoning, K., Charman, D. J., and Wasteg ˚ard, S.: Reconstructed water tables from two om-brotrophic mires in eastern central Sweden compared with instrumental meteorological data, Holocene, 15, 111–118, 2005.
Sepp ¨a, H., Hammarlund, D., and Antonsson, K.: Low-frequency and high-frequency changes in temperature and effective humidity during the Holocene in south-central Sweden:
implica-20
tions for atmospheric and oceanic forcings of climate, Clim. Dyn., 25, 285–297,2005. Shindell, D. T., Schmidt, G. A., Mann, M. E., Rind, D., and Waple, A.: Solar Forcing of Regional
Climate Change During the Maunder Minimum, Science, 294, 2149–2152, 2001.
Siegismund, F. and Schrum, C.: Decadal changes in the wind forcing over the North Sea, Clim. Res., 18, 39–45, 2001.
25
Smith, M., Miller, G. H., Otto-Bliesner, B., and Shin, S.-I.: Sensitivity of the Northern Hemi-sphere climate system to extreme changes in Holocene Arctic sea ice, Quat. Sci. Rev., 22, 645–658, 2003.
Tipping, R.: Holocene evolution of a lowland Scottish landscape: Part 1, peat and pollen-stratigraphic evidence for raised moss development and climatic change, Holocene, 5, 69–
30
81, 1995.
Tsoar, H. and Pye, K.: Dust Transport and the Question of Desert Loess Formation, Sedimen-tology, 34, 139–153, 1987.
CPD
3, 383–408, 2007Increased aeolian activity during climatic regime shifts
R. de Jong et al. Title Page Abstract Introduction Conclusions References Tables Figures ◭ ◮ ◭ ◮ Back Close
Full Screen / Esc
Printer-friendly Version Interactive Discussion
EGU van Geel, B., Buurman, J., and Waterbolk, H. T.: Archaeological and palaeoecological
indica-tions of an abrupt climate change in The Netherlands, and evidence for climatic teleconnec-tions around 2650 BP, J. Quat. Sci., 11, 451–460, 1996.
Wilson, P., Orford, J. D., Knight, J., Braley, S. M., and Wintle, A. G.: Late-Holocene (post-4000 years BP) coastal dune development in Northumberland, northeast England, Holocene,
5
11, 215–229, 2001.
Wilson, P., McGourty, J., and Bateman, M. D.: Mid-to late Holocene coastal dune event stratig-raphy for the north coast of Northern Ireland, Holocene, 14, 406–416, 2004.
CPD
3, 383–408, 2007Increased aeolian activity during climatic regime shifts
R. de Jong et al. Title Page Abstract Introduction Conclusions References Tables Figures ◭ ◮ ◭ ◮ Back Close
Full Screen / Esc
Printer-friendly Version Interactive Discussion
EGU
Table 1. The testate amoebae are grouped into three different wetness categories based on
their wetness preferences on peat bogs.
Wet indicators Indifferent Dry indicators
Amphitrema flavum Assulina seminulum Assulina muscorum
Amphitrema wrightianum Centropyxis cassis type Bullinilaria indica
Arcella discoides type Cyclopyxis arcelloides Corythion-Trinema type
Centropyxis aculeata type Difflugia pristis type Difflugia pulex
Difflugia leidyi Heleopera rosea Euglypha rotunda type
Euglypha compressa Nebela tincta Nebela militaris
Euglypha strigosa Sphenoderia lenta Heleopera petricola
Hyalosphenia elegans Heleopera sphagni
CPD
3, 383–408, 2007Increased aeolian activity during climatic regime shifts
R. de Jong et al. Title Page Abstract Introduction Conclusions References Tables Figures ◭ ◮ ◭ ◮ Back Close
Full Screen / Esc
Printer-friendly Version Interactive Discussion EGU K a t t e g a t S ka g er r ak N o r t h S e a B a l t ic S e a S W E D E N D E N M A R K G E R M A N Y N Igelsjön Store Mosse Undarsmosse Vejers
Fig. 1.Map showing the location of the Undarsmosse bog on the south-west coast of Sweden. The locations of three other sites (Store mosse bog, Vejers dunefield, lake Igelsj ¨on) mentioned in the text are also shown.
CPD
3, 383–408, 2007Increased aeolian activity during climatic regime shifts
R. de Jong et al. Title Page Abstract Introduction Conclusions References Tables Figures ◭ ◮ ◭ ◮ Back Close
Full Screen / Esc
Printer-friendly Version Interactive Discussion EGU Arcella discoides 10 Hyalosphenia papilio 10 20 Amphitr ema flavum 20 40 60 Cal. y rs BP 0 100 200 300 400 500 600 700 800 900 1000 1100 1200 1300 1400 1500 1600 Cycl opyxi s arcel loides 10 20 30 Assulina seminulum 10 20 Assul ina m uscorum 10 20 30 40 Cor ythion-Trinema type 10 20 30 Trigonopyxi s arcul a type 10 20 ye a rs A D 300 400 500 600 700 800 900 1000 1100 1200 1300 1400 1500 1600 1700 1800 1900 Difflugia pulex 20 40 60 Amphitr ema wr ightianum 10 % of total assemblage
Wet indicators Indifferent Dry indicators
Fig. 2.The most common testate amoebae at Undarsmosse shown as the percentage of total testate amoebae plotted on common timescale (right y-axis) and cal. yrs BP (left y-axis). The testate amoebae are grouped according to their ecological wetness preferences.
CPD
3, 383–408, 2007Increased aeolian activity during climatic regime shifts
R. de Jong et al. Title Page Abstract Introduction Conclusions References Tables Figures ◭ ◮ ◭ ◮ Back Close
Full Screen / Esc
Printer-friendly Version Interactive Discussion EGU 0 20 40 60 80 100 1700 1600 1500 1400 1300 1200 1100 1000 900 800 700 600 500 400 300 200 100 0 0 2 4 6 ASI > 125 µm (gr cm-2yr-1) 0 20 40 60 80
sum of ‘wet’ indicators (%)
sum of ‘dry’ indicators (%) ASI > 125 µm (gr cm-2yr-1)
δ18OSed (‰V-PDB)
Cal. yrs BP
Undarsmosse bog Lake Igelsjön Store Mosse bog Vejers
dunefield a b c d e 0 0.4 0.8 1.2 1.6 2 -10 -9.6 -9.2 -8.8 -8.4 -8 300 400 500 600 700 800 900 1000 1100 1200 1300 1400 1500 1600 1700 1800 1900 years AD
Increased aeolian activity at Undarsmosse and Store Mosse
MWA
DACP
RO LIA
Fig. 3. (a)Data from Undarsmosse bog, showing humidity fluctuations as reconstructed by testate amoebae analysis, with an alternating dominance of wet and dry indicators. Curves are based on the taxa presented in Fig. 2 and Table I. Grey shading indicates transitional phases between relatively stable hydrological conditions as reconstructed by testate amoebae. Also shown are ASI variations from the same core for grainsizes >125 µm. (b) Summary of ASI data from Undarsmosse and Store mosse bogs(curve d). Yellow boxes indicate the timing and duration of increased aeolian activity at both sites. Light yellow boxes represent increased aeolian activity mainly recorded at one of the sites. (c) Effective humidity changes as recorded by Hammarlund et al. (2003) and Sepp ¨a et al. (2005). This proxy is comparable to the wetness indicators at this study site (Fig. 3a) and shows a similar pattern. (d) ASI results from Store Mosse bog. Comparison to the ASI record from Undarsmosse bog shows that the two records are highly similar. (e) Stars indicate the onset of dune formation at Vejers dunefield (Fig. 1), interpreted as a proxy for westerly storm activity and sand erodibility (Clemmensen et al., 2001; Clemmensen and Murray, 2006).