DRIVERS' EVALUATION OF
ADVANCED TRAVELER INFORMATION SYSTEMS
FOR INTER-CITY EXPRESSWAYS IN JAPAN
byYOSHIYASU MURASHIGE Bachelor of Engineering, Civil Engineering
University of Tokyo, Tokyo, Japan, 1983 Bachelor of Science, Geography University of Tokyo, Tokyo, Japan, 1981
Submitted to the Department of Civil and Environmental Engineering in Partial Fulfillment of the Requirements for the Degree of
Master of Science in Transportation at the
Massachusetts Institute of Technology
May 1995
C 1995 Yoshiyasu Murashige. All rights reserved.
The author hereby grants to MIT permission to reproduce and to distribute publicly paper and electronic copies of this thesis document in whole or in part
4
"I..
Signature of Author
D
tmen f
a--- , . ·, .~ - r --
-Civil and Environmeal Engineering
May 12, 1995
Certified by /- .
-Moshe E. Ben-Akiva Professor of Civil and Environmental Engineering Thesis Supervisor
-
f)
Accepted by J '
Joseph M. Sussman Chairman, Departmental Committee on Graduate Studies
MASSACHtSE7-'T INSTITUTE n ae 't" '~~···· -.;
DRIVERS' EVALUATION OF
ADVANCED TRAVELER INFORMATION SYSTEMS
FOR INTER-CITY EXPRESSWAYS IN JAPAN
by
YOSHIYASU MURASHIGE
Submitted to the Department of Civil and Environmental Engineering on May 12, 1995 in Partial Fulfillment of the Requirements for the Degree of
Master of Science in Transportation
ABSTRACT
This thesis proposes a comprehensive methodology for assessing drivers' evaluation of Advanced Traveler Information Systems (ATIS) on the most important artery in Japan, the Tomei Expressway, where traffic information systems have been in full-scale use for over
20 years.
We constructed a modeling framework for drivers' traffic information acquisition and their travel responses to acquired traffic information. This research is based on a survey that consists of a revealed preference (RP) part and a stated preference (SP) part. The RP part assessed drivers' actual traffic information acquisition and travel responses, and the SP part evaluated their choice from among hypothetical routes with various attributes,
including different levels of quality of traffic information services.
From the estimation results of discrete choice logit models, we obtained a plethora of useful conclusions. For example, drivers who have acquired traffic information before their departure are most likely to acquire information during the trip. These drivers also tend to consult the same traffic information sources before and during the trip. Users of the Tomei expressway have a choice among multiple pre-trip and en-route traffic information
services. The modeling results have shown that the most important factor affecting the choice among information sources is their perceived usefulness.
Drivers' responses to the acquired traffic information are represented by the following sequence. The first response is the choice of departure time. The second is the choice of an
entrance to the inter-city expressway. The third is the choice of time spent at rest areas,
and finally the fourth is the choice of an exit. Each of these decisions is strongly affected by the content of the acquired traffic information as well as drivers' previous decisions (e.g., drivers who have changed entrances are more likely to change exits).
Moreover, the data indicates that some drivers respond to traffic information, despite having no firm conviction that traffic delays will be shorter as a result of their actions. Therefore, the major effect of ATIS on inter-city expressways is psychological; it alleviates drivers' anxiety and frustration. Furthermore, considering the results of our survey, simply receiving traffic information has a greater effect on alleviating drivers' frustration than changing travel plans.
Finally, the major conclusion of the SP experiment is that current en-route traffic information services on the Tomei Expressway are valued by the drivers to be worth 14% of the toll. This finding implies that the benefits of the existing ATIS significantly exceed the costs.
Acknowledgments
I would like to express my deepest appreciation to all the people who have contributed toward the completion of this thesis.
Throughout my stay at MIT, I have been privileged to have Professor Moshe E.
Ben-Akiva as my academic advisor and thesis supervisor. He gave me precious advice on this thesis despite his busy schedule. His constructive criticism and steady support helped me
immensely. It has been a great experience working with him, and I can not thank him
enough for the support and encouragement he has given me.
I wish to express my gratitude to Ms. Amalia Polydoropoulou, a Ph.D. student at MIT. She provided me devoted assistance all along the way and helped me to keep the research on the right track.
I would like to thank Professor Tetsuo Yai who always gave me valuable suggestions and comments on this thesis.
Thanks are due to Mr. Keiichi Ogawa, a graduate student at Tokyo Institute of Technology, who helped me with questionnaire design and data coding.
Thanks to all my friends in the Center for Transportation Studies for their timely
advice and support.
I am indebted to the Japan Highway Public Corporation for giving me the opportunity to study at MIT for two years, and for providing me with survey data which were
essential to this research.
Finally, but not least, I would like to express my true love and gratitude toward my family. Especially I am greatly indebted to my dedicated wife, Hiromi, who has always encouraged and supported me throughout my stay at MIT. Had it not been for her kindness and dedication, I would not have been able to pursue and accomplish my
Table of Contents
Title ... 1
A bstract ... 2
A cknow ledgm ents ... 3
Table of C ontents ...4
List of Figures ... 6
L ist of T ables ... 7
Chapter 1 Introduction ... 8
1.1 Main Issues of Inter-City Expressways in Japan ... ... 8
1.2 Motivation underlying the Research ... 12
1.3 Objectives of the Research ... 13
1.4 Brief Literature Review ... 16
1.5 Thesis Outline ... 21
Chapter 2 Advanced Traveler Information Systems in Japan ... 22
2.1 Inter-City Expressway System ... 22
2.2 Countermeasures against Traffic Congestion ... 26
2.2.1 Reconstruction ... 27
2.2.2 New Tomei Expressway and Meishin Expressway ... 27
2.2.3 Completion of the Inter-City Expressway Network in the Tokyo Metropolitan Area ... 27
2.3 Advanced Traveler Information Systems . . ... 29
2.3 1 Historical Background ... 29
2.3.2 Traffic Management Systems ... 30
2.3.3 ATIS on the Tomei Expressway ... 33
2.3.4 Conventional Traffic News ... 43
2.3.5 Other Traffic Information Sources ... 44
Chapter 3 Framework for Drivers' Behavior and Model Structure ... 47
3.1 Introduction to Drivers' Behavior on Inter-City Expressways in Japan ... 47
3.2 General Framework for Drivers' Behavioral Models ... 49
3.3 Model Structure of the Acquisition of Pre-Trip Traffic Information ... 51
3.4 Model Structure of the Acquisition of En-Route Traffic Information ...52
3.5 Model Structure of the Response to Traffic Information ... 53
3.6 Summary of the Behavioral Models ... 56
Chapter 4 Survey of Evaluation of Traffic Information ... 58
4.1 Questionnaire Design ... 58
4.2 Revealed Preference (RP) Survey ... 59
4.3 Stated Preference (SP) Survey ... 60
4.3.1 Building the (Un-customized) Pairwise Comparison ... 61
4.3.2 Building the (Customized) Quadruple Comparison ... 62
4.4 Distribution of the Questionnaires ... 67
4.5 Response Rate ... 68
Chapter 5 Descriptive Statistics ... 69
5.1 Drivers' Socioeconomic Characteristics ... 69
5.2 Trip Characteristics ... 72
5.3.2 En-Route Traffic Information ... 78
5.3.3 Drivers' Usage and Awareness of the ATIS ... 80
5.3.4 Content of Traffic Information ... 82
5.3.5 Actual Traffic Conditions ... 82
5.4 Response to Traffic Information ... 85
5.5 Decision Making Tree ... 8... 87
5.6 Expectations of Traffic Delays ... 88
5.7 Expectations of Traffic Delays and Response to Traffic Information ... 89
5.8 Satisfaction with Response to Traffic Information ... 91
5.9 Evaluation of the ATIS ... 93
5.10 General Evaluation of Traffic Information Sources ... 94
5.11 Attitudes toward Driving Behavior ... 97
5.12 Im portance in Route Choice ... 97
5.13 Summary of the Descriptive Statistics ... 98
Chapter 6 Model Estimation Results... 100
6.1 Estimation Techniques ... 100
6.1.1 Logit Model... 100
6.1.2 Modeling with Fitted Value of Attitudes ... 100
6.2 Traffic Information Acquisition... 101
6.3 Pre-Trip Traffic Information Acquisition ... 102
6.3.1 Pre-Trip Traffic Information Acquisition Model (Binary Logit)... 102
6.3.2 Pre-Trip Traffic Information Source Choice Model (MNL)... 104
6.3.3 Summary of the Pre-Trip Traffic Information Acquisition Models ... 108
6.4 En-Route Traffic Information Acquisition... 109
6.4.1 En-Route Traffic Information Acquisition Model (Binary Logit)... 109
6.4.2 En-Route Traffic Information Source Choice Model (MNL) ... 112
6.4.3 Summary of the En-Route Traffic Information Acquisition Models ... 115
6.5 Response to Traffic Information ... 116
6.5.1 Response to Traffic Information Choice Model (MNL) ... 116
6.5.2 Response Model: Changed Departure Time (Binary Logit) ... 120
6.5.3 Response Model: Changed Entrance (Binary Logit) ... 122
6.5.4 Response Model: Changed Time Spent at Rest Area (Binary Logit) ... 124
6.5.5 Response Model: Changed Exit (Binary Logit) ... 126
6.5.6 Summary of the Response to Traffic Information Models ... 128
6.6 Summary of the Model Estimation Results ... 130
Chapter 7 Route Choice (Stated Preference) Model . ... 131
7.1 Analysis and Interpretation of the Estimation Results ... 131
7.2 Forecasting Willingness to Pay for the ATIS ... ... 133
7.3 Influence of the RP Characteristics on the SP Choice ... 135
7.4 Summary of the Route Choice (SP) Model ... 136
Chapter 8 Conclusions . ...138
8.1 Contributions ... 138
8.2 Major Findings ... 139
8.3 Future Work ... 141
Appendix .. ... 144
Questionnaire and Descriptive Statistics of the Survey ... 144
List of Figures
Figure 1.1 Figure 2.1 Figure 2.2 Figure 2.3 Figure 2.4 Figure 2.5 Figure 2.6 Figure 2.7 Figure 2.8 Figure 2.9 Figure 2.10 Figure 2.11 Figure 2.12 Figure 3.1 Figure 3.2 Figure 3.3 Figure 3.4 Figure 3.5 Figure 3.6 Figure 4.1 Figure 4.2 Figure 5.1 Figure 6.1Traffic Management Configuration ... ... 9
Master Plan for Inter-City Expressway Network ... 24
Share of Inter-City Expressways in Domestic Transportation ... 25
Expressways in the Tokyo Metropolitan Area ... 28
Recommendation of a Shortcut ... 30
Traffic Management Systems ... 32
ATIS on the Tomei Expressway ... 34
Example of a Variable Message Sign ... ... 35
Variable Message Sign Subsystem ... ... 37
Travel Time Information Subsystem ... ... 38
Variable Message Signs on the Tomei Expressway ... 39
Highway Radio Subsystem ... 41
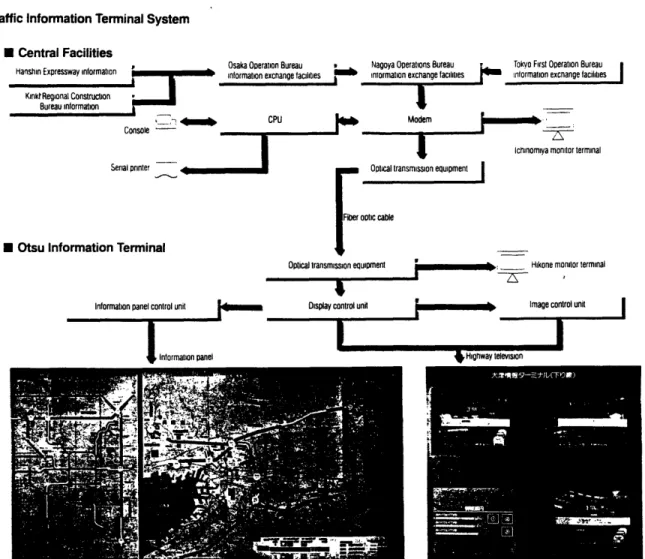
Highway Information Terminal Subsystem ... 42
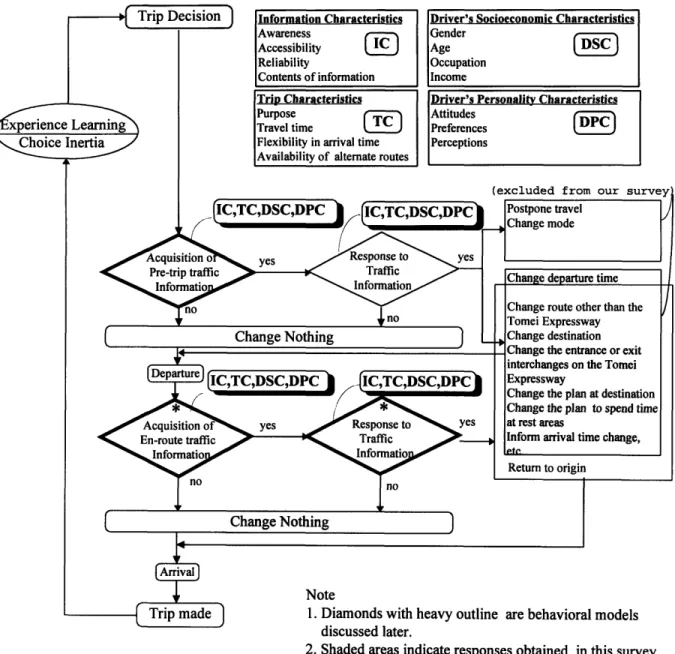
Drivers' Decision Making Flow ... 48
General Framework for Drivers' Behavioral Models ... 50
Model Structure of the Acquisition of Pre-Trip Traffic Information ... 51
Model Structure of the Acquisition of En-Route Traffic Information ... 52
Model Structure of the Response to Traffic Information ... 55
Behavioral Models in This Study ... 57
Structure of the Questionnaire ... 67
Sites of Questionnaire Distribution ... 68
Decision Making Tree ... 88
List of Tables
Table 2.1 Roads in Japan ... 23
Table 2.2 International Comparison of Expressways ... 26
Table 4.1 Example of Pairwise Comparison ... 64
Table 4.2 Example of Quadruple Comparison ... 65
Table 4.3 Attributes of Comparison (un-customized) ... 66
Table 4.4 Attributes of Comparison (customized) ... 66
Table 4.5 Response Rate ... 68
Table 5.1 Drivers' Socioeconomic Characteristics ... ... 71
Table 5.2 Trip Characteristics ... 74
Table 5.3 Travel Time on the Chosen Route and on the Best Alternate Route ... 75
Table 5.4 Traffic Information Sources ... 79
Table 5.5 Drivers' Usage and Awareness of the ATIS ... 81
Table 5.6 Content of Traffic Information ... 83
Table 5.7 Actual Traffic Conditions ... 84
Table 5.8 Average Traffic Delays ... 84
Table 5.9 Response to Traffic Information ... 86
Table 5.10 Threshold of Diverting from the Tomei Expressway ... 87
Table 5.11 Expectations of Traffic Delays ... ... 90
Table 5.12 Expectations of Traffic Delays and Response to Traffic Information ... 91
Table 5.13 Satisfaction with Response to Traffic Information ... 93
Table 5.14 Evaluation of The ATIS ... 94
Table 5.15 General Evaluation of Traffic Information Sources . . ... 96
Table 5.16 Attitudes toward Driving Behav ... ior 97 Table 5.17 Importance in Route Choi ... ce 98 Table 6.1 Estimation Results of Pre-Trip Traffic Information Acquisition Model (Binary Logit) ...103
Table 6.2 Specification of Pre-Trip Traffic Information Source Choice Model (MNL) ...105
Table 6.3 Estimation Results of Pre-Trip Traffic Information Source Choice Model (MNL) ...106
Table 6.4 Estimation Results of En-Route Traffic Information Acquisition Model (Binary Logit) ... 110
Table 6.5 Specification of En-Route Traffic Information Source Choice Model (MNL) ... 113
Table 6.6 Estimation Results of En-Route Traffic Information Source Choice Model (MNL) ... 114
Table 6.7 Specification of Response Model (MNL) ... ... ...117
Table 6.8 Estimation Results of Response Model (MNL) ... ... 118
Table 6.9 Estimation Results of Response Model: Changed Departure Time (Binary Logit) ...120
Table 6.10 Estimation Results of Response Model: Changed Entrance (Binary Logit) ... 123
Table 6.11 Estimation Results of Response Model: Changed Time Spent at Rest Areas (Binary Logit).125 Table 6.12 Estimation Results of Response Model: Changed Exit (Binary Logit) ...127
Table 7.1 Estimation Results of Un-Customized Rote Choice Model (Binary Logit) ...132
Table 7.2 Value of Traffic Information Services (Classified by Drivers' Income) ... 137
Chapter 1
Introduction
This thesis will address the effectiveness of the traffic information provision on drivers' behavior of the inter-city trip in Japan.
1.1 Main Issues of Inter-City Expressways in Japan
From the road administrator's viewpoint, there are three main issues concerning customer service: traffic safety, traffic congestion, and traffic information. Traffic Information is considered to be one of the quick but efficient solutions of traffic safety and traffic congestion problems.
1. Traffic Safety
The accident rate on inter-city expressways is about one-ninth of that on ordinary
roads. Once an accident occurs, however, the number of fatalities2 can be so high that
public awareness of traffic safety on these expressways is also rather high.
In recent years, 300 to 400 people have been killed on inter-city expressways in Japan
each year.
2. Traffic Congestion
Compared with urban expressways, inter-city expressways have fewer problems with congestion. In areas surrounding large cities, however, congestion occurs frequently. For example on the Tomei Expressway, which is the most important artery connecting Tokyo
'12 accidents/100 million vehicle-km for inter-city expressways and 105 accidents/100 million vehicle-km for ordinary roads
2 In 1974 an accident occurred in a long tunnel, involved more than 200 vehicles, and killed over 100 people.
and Nagoya, occurred congestion in 6,315 congestion episodes3 occurred in 1993
(averaging 17.3 congestion episodes per day). The total duration of these congestion episodes amounted to 10,138 hours in 1993 (averaging 27.8 hours per day). This means that, on average, the back up would continue for 1.6 hours for each congestion episode.
Congestion on inter-city expressways is divided into four types: congestion due to saturation, road work, accidents, and other (such as weather conditions, etc.). Congestion due to saturation occurs naturally when the road capacity is insufficient for traffic
volume. This is the most common cause of congestion. To deal with saturation-induced congestion, a variety of measures that concentrate on expanding the traffic capacity have been proposed and are being implemented. Fundamental countermeasures such as increasing the number of lanes, increasing entrance or exit ramp lanes, increasing the operating lanes at tollgates, and improving access roads, need much expenditure and a long construction period. However, inter-city expressway users expect quick-acting countermeasures.
Practical and fundamental countermeasures to combat congestion are discussed with concrete examples in Chapter 2. In this chapter, commonly used countermeasures concerning traffic management (see Figure 1.1) are discussed.
Figure 1.1 Traffic Management Configuration
In Japan, control of the traffic volume using traffic management strategies is extremely difficult on inter-city expressways, for the following reasons.
(1) Modal Shift
The modal shift from the inter-city expressway to rail is not large. As regards freight, the proportion of transport volume handled by the inter-city expressway is growing from year to year, and the shift to rail has not been achieved successfully due to insufficient rail capacity. Concerning passenger transportation, the modal shift is also not entirely successful, because the Japanese bullet trains are already greatly used and it would be difficult to increase their capacity. Besides, the trip characteristics of the inter-city expressway users are different from those of the bullet train riders. For example, the average trip length of inter-city expressway users is about 50 to 100 km, while that of the bullet train users is over 300 km. Moreover, commuting traffic on inter-city expressways is so light that a diversion to public transportation can not be expected.
(2) Route Diversion
Since Japan does not have an adequate inter-city expressway network system to share the traffic volume, route diversion is inconsistent with reality. For long inter-city trips, the alternatives are so slow (most of them are ordinary roads and their average speed is
approximately 30 km/h) that drivers usually have no choice but to use inter-city
expressways. Although route diversion is useful and effective on urban expressways which have adequate network systems, it is not used on inter-city expressways. (3) High Occupancy Vehicle (HOV) Lanes
HOV lanes are not practical. Since the length of inter-city expressways which have more than three lanes in each direction is very short and those multilane sections support heavy traffic volume in metropolitan areas, it is highly impractical to dedicate a lane to HOV. There is no HOV lane on inter-city expressways in Japan at present.
(4) Road Pricing
Road pricing is considered an effective countermeasure for traffic demand control. However all inter-city expressways in Japan are already toll roads and the politically determined toll rates are approximately the same throughout the country. Moreover the toll rate in Japan is now the most expensive in the world, and the users of inter-city
expressways are sensitive to raising the toll rate. Thus there is little room to for
congestion pricing on inter-city expressways.
3. Traffic Information
After discussing measures that have been used and proposed for reducing congestion, this research focuses on issues of traffic information, one of the most important means of alleviating congestion problems.
The Japan Highway Public Corporation (JHPC), which administers all the inter-city expressways in Japan, is trying to improve traffic information systems for a variety of reasons:
(1) The provision of traffic information is considered an easy countermeasure against traffic congestion, because traffic information would divert drivers to an alternate route. Even though, it is very rare for inter-city expressway users to switch routes. The
psychological effect of receiving traffic information on the drivers is significant, because their anxieties and frustration can be reduced.
(2) The provision of traffic information is considered a countermeasure against traffic accidents, since the implementation of the fundamental countermeasures against traffic accidents, such as the improvement of geometric design, the widening of the carriageway, the improvement of the service level of snow removal and ice control, the raising of the level of illumination inside tunnels, etc. take much time and are expensive. Moreover, in terms of the direct effect of the traffic information service on traffic safety, drivers who have acquired information about congestion are more attentive and therefore more likely to avoid rear-end collisions, and drivers who have snow and ice or storm information can avoid hazardous situations.
(3) The social need for information has been growing in all areas of our information-oriented society. Drivers' demands for traffic information has also increased rapidly. (4) The breakthrough in the telecommunication area, such as the practical use of optical fiber cables, has made it possible to provide a large amount of traffic information. In other words, technical innovation has prepared the groundwork for the information era.
1.2 Motivation underlying the Research
The JHPC and other urban expressway corporations have been pushing forward with Advanced Traveler Information Systems (ATIS). Existing ATIS services provide
sophisticated traffic information, such as travel time and location of congestion and queue length, through variable message sign boards (including graphic map types), advisory traffic radios (dedicated local transmitting stations using automatically computer-synthesized announcements) and auto-answering telephone service, updated every five minutes. The ATIS were developed not only as countermeasures against traffic
congestion and traffic accidents, but primarily as a part of customer service. Users of inter-city expressways, which are all toll roads, have never had the concept of paying money for traffic information, and the JHPC has no conception, either, of investigating the monetary value of traffic information services. However, the JHPC should be able to obtain customer evaluations of the ATIS and make a strategic implementation plan of them, something it has not achieved heretofore.
The improvement of traffic information service increases the utility of inter-city expressway users who have been diverted from ordinary roads. However, the following items are only considered to be of benefit to inter-city expressway users:
1. save travel time
2. save fuel cost, save wear of tires and engine oil
3. improve passenger comfort 4. reduce damage to freight 5. improve traffic safety
As stated above, all inter-city expressways in Japan are toll roads. The toll rates must
be set at such levels as to be sufficient to cover the cost of construction, the acquisition
cost of the right-of-way and interest charges, and the cost of current maintenance and operation. The period of toll collection is basically 30 years from the completion of the
nationwide network. In addition the toll rates must be fair and reasonable so that each
toll should not exceed the benefit normally received by the customer. However, the utility of the traffic information service is not counted as a user's benefit.
One particular characteristic of the toll system of inter-city expressways is the pool system. Since these expressways form a single road network which extends throughout Japan, their construction costs are accounted for at the network level rather than at the
individual inter-city expressway link. Thus, toll rates are raised every three to five years
subject to the expansion of the inter-city expressway network plan. After every raise,
customers require an improvement of the service level, and the JHPC always lists a
reinforcement of the traffic information system on the improvement menu in order to escape customers' criticism. The improvement of traffic information systems is easy to implement and attracts the attention of customers. However, as long as the JHPC does
not know the real value of the traffic information service, it can not make a feasible investment plan for the ATIS. Moreover, as long as it does not know how and in what situations drivers require traffic information, it can not draw up a comprehensive and strategic master plan for the ATIS.
1.3 Objectives of the Research
The purpose of this thesis is to propose a method for assessing drivers' evaluation of
the ATIS. Also it analyzes the influence of the ATIS on drivers' responses by
constructing behavioral models. This is a case study based on a survey of drivers on the
Tomei Expressway. The most important point of this study is that the survey questioned
the users of ATIS which has been in actual operation. Japan is the only country where ATIS are in full-scale practical use. Users of inter-city expressways have used ATIS for over 20 years, so that they have sufficient familiarity and knowledge about ATIS. The
data gathered in this study provides us unique and significant findings about users' evaluation of ATIS. Furthermore this research focuses not on urban expressways which have networks, but on inter-city expressways. Although inter-city expressways do not
have a complete network which would provide alternate routes for drivers, it is very
useful to investigate how the users of the ATIS on inter-city expressways evaluate them and how the users respond to them. In addition, the methodology developed in this
In evaluating the existing ATIS implemented on the Tomei Expressway, this research will identify:
(1) The traffic information sources which are more attractive for users and the important factors for this attractiveness of these information sources
(2) The contents of traffic information likely to affect drivers' decisions (such as departure time choice, route choice, entrance and exit choice, etc.)
(3) The drivers' concealed "willingness to pay" for ATIS
In order to achieve these goals, a four-stage methodology was implemented. This methodology consists of the:
(1) Development of an inter-city drivers' behavioral framework. The hypothesis underlying this framework is that information acquisition and response to traffic
information behaviors are influenced by trip characteristics, information characteristics, drivers' socioeconomic characteristics, and drivers' personal characteristics. This behavioral framework specifies how and in what situations drivers acquire traffic information, which information sources drivers consult, and how drivers respond to traffic information, based on traffic conditions.
(2) Development of a data collection methodology which includes the survey design and data collection on the Tomei Expressway. This survey consists of the following parts: [Revealed Preference (RP) Part] Trip characteristics, drivers' usage and evaluation of the ATIS, responses to traffic information and expectations of traffic delays, attitudes toward driving, and socioeconomic characteristics
[Stated Preference (SP) Part] Drivers' choice from among hypothetical routes (3) Development of a modeling methodology which includes the following models:
1. Pre-trip traffic information acquisition 2. En-route traffic information acquisition 3. Responses to traffic information
4. Route choice (4) Forecasting of:
1. How the drivers responses will be affected by the characteristics of traffic information
2. How the willingness to pay for the ATIS will be affected by the trip characteristics, drivers' socioeconomic characteristics, or drivers' evaluation of the ATIS.
It may be desirable to mention briefly the points of this methodology to summarize and to give a more concrete idea of the main topics of this research:
(1) The development of drivers' behavioral models for traffic information acquisition and responses to traffic information
The above mentioned behavioral models are derived from revealed preference (RP) data taken from the survey of drivers on the Tomei Expressway. The focus of this research is on the influence of traffic information on drivers' response.
As a result, we can capture the impact of each information source and of the contents
of information on drivers' response, and then we can make it clear which information services should be expanded and what kind of contents of information should be
improved. After understanding these factors, we could estimate what portion of drivers would exit the expressway to ordinary roads influenced by particular traffic information,
e.g. "5 km ahead of you there exists a 10-km-long back up due to an accident, and it takes
40 minutes to go through the back up." These findings are to be used for comprehensive traffic management strategies on the inter-city expressway network, which will be
completed at the beginning of the next century, and for an appropriate allocation of traffic volume among existing expressways and ordinary roads.
(2) An assessment of the drivers' evaluation of the ATIS
In assessing the drivers' evaluation, stated preference (SP) data from the survey are used. As mentioned in Section 1.1, drivers on inter-city expressways have little possibility to change their routes, so that their main alternatives are to change their departure times, to change entrance or exit interchanges, or to change their plans for spending time at rest areas. Therefore traffic information does not have a significant impact as far as saving travel time and travel cost is concerned. The major effect that the availability of traffic information on inter-city expressways has on drivers is considered to be psychological; it alleviates drivers' anxiety and frustration due to insufficient traffic information and justifies drivers' decisions to take inter-city expressways. They feel
relieved knowing the actual traffic conditions even though there are no obstacles in the
way.
Estimate drivers' perceptions of utility of routes and evaluate the benefit of the following en-route information service levels:
1) Future Tomei Expressway [the length of the back up, travel time, and information
about alternate ordinary roads]
2) Present Tomei Expressway [the length of the back up and travel time] 3) Old Tomei Expressway [the length of the back up]
Based on the evaluation of each service level, we can make a feasible investment plan for future traffic information services, and also justify the investment in the existing traffic information services.
The JHPC plans to expand the state-of-the-art ATIS on the Tomei Expressway to other metropolitan areas. In carrying out this plan, the findings of this research should be
applied.
Future expansion of the inter-city expressway network will lead to situation with valuable route diversion possibilities. These will present opportunities to implement more advanced traveler information system with route diversion recommendations.
1.4 Brief Literature Review
Current research efforts on ATIS fall into two main categories: travel behavioral modeling and traffic simulation (Khattak et al. (1995)). An extensive literature review on existing research efforts on travel behavior modeling is presented in Ben-Akiva et al. (1993). Based on this review, we would like to present an overview of state-of the-art research on ATIS.
1. Framework for Drivers' Behavior and Model Structure
Most research conducted to date has been focused on modeling the ATIS usage, travel response, and learning.
ATIS Usage
Polydoropoulou et al. (1993) proposed a modeling framework for pre-trip and en-route information acquisition, and the influence of the acquired information on drivers' route
choice and route switching. Abdel-Aty et al. (1994) also proposed simultaneous models for usage and travel response of commuters.
Travel Response
Modeling Pre-Trip Choices
Cascetta and Biggiero (1992), Polak and Jones (1992), and Polydoropoulou et al. (1994) have developed models of the influence of pre-trip information on travelers' mode choice, departure time, route choice, and frequency of route changes. Cascetta and Biggiero (1992) estimated logit models for departure time and path choice for home-to-work trips, based on an RP survey. Polak and Jones (1992) studied the impact of in-home pre-trip traffic information.
Modeling En-Route Choices
Adler et al. (1992 a, b, 1993), Bonsall and Parry (1991), Jayakrishnan and
Mahmassani (1991), Khattak et al. (1991, 1992), Lotan and Koutsopoulos (1993) have made modeling efforts on various aspects of en-route traveler behavior in the presence of information. Jayakrishnan and Mahmassani (1991) presented a model of the path
selection decisions of individual motorists along their journey in response to supplied information. Khattak et al. (1991) investigated short term driver diversion response to incident-induced congestion delay and evaluated the ways in which drivers use real-time traffic information. Khattak et al. (1992) used SP data to evaluate the effects of real-time traffic information, along with driver attributes, roadway characteristics and situational factors on drivers' willingness to divert. Bonsall and Parry (1991) developed an interactive route-choice simulator to investigate drivers' compliance to route guidance advice. Lotan (1992) modeled the route choice process and the drivers' perceptions in the presence of information by using concepts from fuzzy sets theory, approximate reasoning and fuzzy control. Adler et al. (1992 a, b, 1993) used a driving simulator to collect data for estimation and calibration of predictive models of drivers' behavior under the influence of real-time information.
Learning
Ben-Akiva et al. (1984) suggested a simplified model of day-to-day travel adjustment and Vythoulkas (1990) extended the model which assumed that individuals were
informed about actual travel time on the previous day and that they used this information in making their travel decisions for the next trip. Horowitz (1984) assumed that drivers acquire their information on travel costs from previous commuting experiences. Hatcher and Mahmassani (1992) addressed the day-to-day variation of individual trip scheduling and route decisions for the evening commute.
Updating perceptions
Iida et al. (1992 a) investigated the mechanism of travel time prediction by analyzing the dynamics of the route choice behavior using laboratory-like experiments that
repeatedly asked participants to respond to hypothetical route choice situations. Van. der Mede and Van Berkum (1991) used a route-choice computer game to simulate and model individuals' route choice sequences in situations where RTI (Road Transport
Informatics), and a particular VMS (Variable Message Sign) were available or not. Vaughn et al. (1993) and Yang et al. (1993) instructed each participant using a simulator
whose objective is to minimize travel time by deciding when to follow the ATIS recommendation.
2. Data Collection Methodologies
Data collection methodologies can be classified into three main groups: travel surveys, travel simulators, and field experiments.
Travel Surveys
A. General Traveler population Surveys
1. To capture user response to commercially available traffic information services This type of surveys have only addressed the acquisition of radio traffic reports and the influence of such information on drivers' route choice behavior (see Khattak et al. (1991), Mahmassani et al. (1989,1991), Kaysi (1992), Lotan (1992)).
2. To address user response to un-implemented ATIS services
Polydoropoulou (1993b) conducted a pilot survey to investigate the willingness to pay for the ATIS. A nationwide ATIS-related survey was conducted at the University of Washington (Ng et al. (1993)). Khattak et al. (1995) explored how people respond to
ATIS through a survey of Bay Area automobile commuters, and travelers' response to
future ATIS technologies through stated preference.
B. Survey targeting Operational Test and Simulation Experiment Subject Surveys conducted in conjunction with actual field experiments provide the
opportunity to investigate awareness and access decisions related to actual ATIS. These
surveys are also helpful in collecting information regarding trip decisions (ATIS usage and travel response), perceptions of information quality, and learning effects.
Multisystems (1993,1994) conducted ATIS-related surveys in association with the
SmartTraveler system. Kantonwitz et al. (1993) presented a focus group study conducted
to investigate customer evaluation of the Travtek.
Travel Simulators
Koutsopoulos et al. (1993) presented the categories of data collected so far from travel simulators developed by various research teams, based on the available reports and informal communication with developers of these simulators. Existing travel simulators have been utilized to collect data only for Usage, Travel Response, and Updating of Perceptions of the modeling framework.
Field Experiments
Whitworth (1993) presented a comprehensive review of the role of operational tests in understanding user response to ATIS. This review says there are many demonstration projects in the U.S. which provide data supporting the various stages of user response to ATIS. User response is primarily based on the evaluation plans that have been developed
for these operational tests. The ATIS usage stage and route choice dimension of the travel response stage are covered quite well, however little or no data is expected from
these demonstration projects with regard to awareness or willingness to pay.
3. Studies on Drivers' Response to ATIS in Japan
Since Japan has more than 20 years experience in full-scale practical use of ATIS,
especially in the Tokyo and the Osaka metropolitan areas, there are many studies related
to ATIS. These studies fall into three main categories: 1) Field Survey on Drivers' Behavior
3) Simulation of Route Choice in the presence of information
Field Survey on Drivers' behavior
lida et al. (1992 b, 1993 a) conducted a survey of drivers who could obtain travel time
information on three routes connecting Sakai (about 15 km south from Osaka, population 806,000) and Osaka C.B.D. and then estimated MNL route choice models to illustrate the degree of the influence of travel time information on drivers' route choice. Uchida et al. (1992) analyzed the departure time choice behavior of commuting drivers by using an
empirical data collected through roadside surveys and a panel survey. Taniguchi et al. (1993) and Hato et al. (1995) introduced a floating-car technique on the Metropolitan Expressways and on the alternate ordinary surface roads, as well as an SP survey to
investigate the influence of traffic information on drivers' route choice.
Experimental Approach to Drivers' Behavior
Iida et al. (1989 a, 1991 a) analyzed drivers' dynamic route choice behavior from the results of an SP panel survey. Iida et al. (1990 a,1991 b, 1993 b) also constructed travel
time prediction models considering the pattern of drivers' route choice in the presence of
travel time information based on an SP panel survey. Iida et al. (1992 c) analyzed an
interaction between drivers' travel experiences and their dynamic route choice behavior
using an SP panel survey
Simulation of Route Choice in the Presence of Information.
There are many studies on route choice simulation. Those studies attempt to construct a dynamic route choice model which can simulate the route choice behavior and traffic flow under the operation of providing information on the hypothetical network (for
example, see Iida et al. (1989 b, 1990 b, 1992 d, 1993 c, 1993 d, 1993 e), Kobayashi (1990, 1992), Kobayashi et al. (1993 a, 1993 b), Uchida et al. (1991), Moritsu et al. (1992, 1993), Nakagawa (1993), and Wakabayashi (1993)).
4. Conclusions
The above literature review revealed that data collection efforts focused so far on inter-city drivers' behavioral responses to conventional information sources (such as radio
inter-city expressways in Japan, we have the differential advantage to collect revealed preference data of inter-city drivers' behavior toward a variety of existing ATIS.
Current modeling efforts have not been able to quantify travelers' willingness to pay for ATIS. The design of the SP experiment in this study will allow making inferences on travelers' evaluation of various levels of information sources.
Travelers' usage models have been focused on the decision to acquire or not traffic information. We will be able to extend these models, and develop models of the actual choice of a specific ATIS among various pre-trip and en-route alternative choices.
Furthermore, existing travel response models mostly focused on travelers' decisions to change their usual commuting behavior. No models have been developed so far for the inter-city travelers.
Finally, most studies conducted in Japan on drivers' behavior are based on SP data. We will use our stated preference experimental results to compare with the results of these studies.
1.5 Thesis Outline
This thesis consists of eight chapters. Chapter 2 introduces the ATIS in Japan which has already more than 20 years history of full-scale practical use. This chapter also reviews the background information of drivers who use inter-city expressways in Japan. Chapter 3 discusses the model structure and the framework for drivers' behavior. The basic concepts underlying the drivers' responses in the presence of traffic information are analyzed. Chapter 4 discusses data collection methodologies including questionnaire design. Chapter 5 presents descriptive statistics of our survey comparing them with the previous surveys conducted on the inter-city expressways in Japan. Chapter 6 presents the analysis and interpretation of the estimation results of approaches used to model the acquisition of pre-trip traffic information, the acquisition of en-route traffic information, and the response to traffic information. Chapter 7 explores drivers' perception of the utility of the ATIS services on the inter-city expressways by estimating our route choice model based on the SP data. Chapter 8 presents contributions and major findings as well as plans for future work.
Chapter 2
Advanced Traveler Information Systems in Japan
In this chapter, the Advanced Traveler Information Systems (ATIS) in Japan are introduced. To understand the background of this study which developed drivers'
behavioral models of responses to the ATIS, it would be useful to know what is going on concerning ATIS in Japan. First, the inter-city expressway system and countermeasures against traffic congestion are explained. Then the discussion focuses on the ATIS on the Tomei Expressway. Last, traffic information sources other than the ATIS are explained
2.1 Inter-City Expressway System
Japan started to improve public facilities as the infrastructure in the 1950's after restoring itself from the devastation of World War II. In this period, the improvement of roads was recognized as indispensable for the well-balanced development of national
land, and thus it became an urgent issue, as the traffic demand on roads grew remarkably. At that time, roads in Japan were out-of-date by several decades compared to behind those in Europe and in North America. In order to respond to expanding traffic demands,
it was also necessary to secure financial resources for roads, however, it was quite
difficult to carry out the planned development within the limited national budget. Therefore, the toll road system was introduced in 1952. Using this system, the costs for road construction were borrowed from the government and financial institutions and the repayments were made by toll collection after roads opened. In 1956, the Japan Highway
Public Corporation (JHPC) was established. The JHPC is a special nationwide
organization that is capable of widely utilizing not only governmental funds but also private funds, and of managing the toll road business efficiently and comprehensively.
Since its establishment, the JHPC has expanded the nationwide inter-city expressway system and contributed a great deal to the nation's economic development and social
welfare. The JHPC now operates 5,614 km of national inter-city expressways which have a master plan that requires the completion of the network of 11,520 km by the
beginning of the 21 st century (see Table 2.1 and Figure 2.1). Inter-city expressways have now become the arteries of the Japanese Archipelago. Not only are they essential to
industry for moving freight and conducting business effectively, they have also become indispensable to daily life, for both work and leisure.
Table 2.1 Roads in Japan (as of April 1, 1993)
Classification Total Length (A) Paved Length (B) (B)/(A)
(km) (km) (%) National Inter-city (5,614) (5,614)
Expressway
5,404
5,404
(100.0)
(0.5)
(0.7)
100.0
Urban
Expressway
473 473 100.0(0.1)
(0.1)
National
Highway
53,304
52,400
98.3
(4.7)
(6.4)
Prefectural
Road
123,536
115,184
93.2
(10.9)
(14.1)
Municipal
Road
948,169
641,669
67.7
(83.8)
(78.7)
Total 1,130,886 815,130 72.1Source: he JHPC, (1994), ANNUAL REPORT. Tokyo
Note: Percentage(%) of all roads is shown in( )
Figures of National Inter-city Expressway in ( ) are asof September 1, 1994
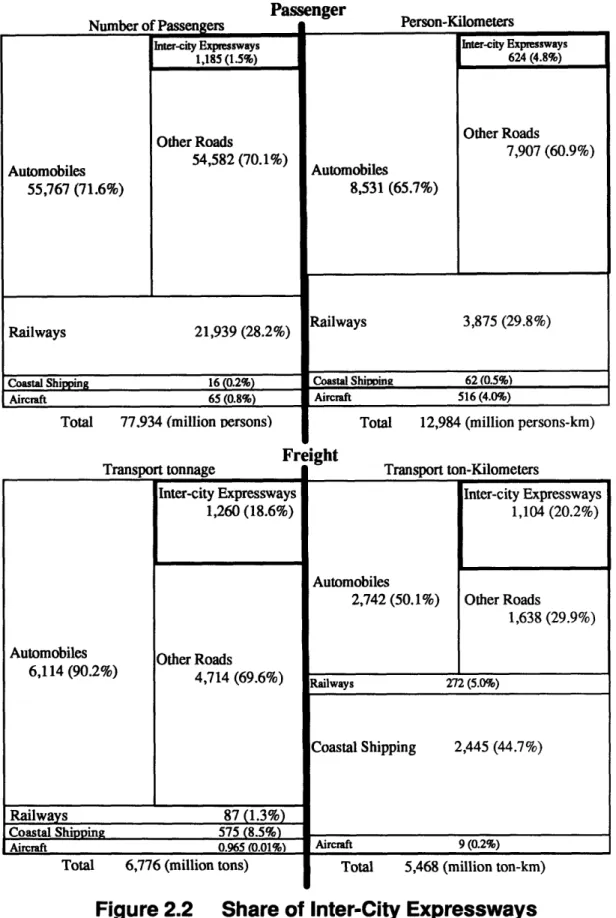
In 1990, inter-city expressways accounted for 20.2% of freight transport (ton-km) and 4.8% of passenger transport (person-km). In addition, although inter-city expressways carried an estimated 40.3% of freight and 7.3% of passengers transported by automobiles, they accounted for only 0.6% of the total length of paved roads in Japan (see Figure 2.2).
In Japan, road systems are divided into two categories. One is the expressway and the
other is the ordinary road. The expressway consists of the inter-city expressway and the urban expressway, and the ordinary road consists of the national highway, the prefectural
, 9 _5, 11' " ;1 -cd) 4 0
z
U) W cc 0. WI a a x w) L1I Xl Itt a Aa
z 2.~I
L -Zh~~~~~ E_
tz _ $, z ( LNumber of Passengers Automobiles 55,767 (71.6%) Railways Inter-city Expressways 1,185 (1.5%) Other Roads 54,582 (70.1%) 21,939 (28.2%) Coastal Shipping 16 (0.2%) Aircraft 65 (0.8%)
Total 77.934 (million ersons)
Transport tonnage Inter-city Expressways 1,260 (18.6%) Automobiles thr Roads 6,114 (90.2%) 4,714 (69.6%) Railways 87 (1.3%) Coastal Shipping 575 (8.5%) Aircraft 0.965 (0.01%)
Total 6,776 (million tons)
Passenger Person-Kilometers Automobiles 8,531 (65.7%) Railways Inter-city Expressways 624 (4.8%) Other Roads 7,907 (60.9%) 3,875 (29.8%) Coastal Shivin 62 (0.5%) Aircraft 516 (4.09)
Total 12,984 (million persons-km) Freight Transport ton-Kilometers Inter-city Expressways 1,104 (20.2%) Automobiles 2,742 (50.1%) Other Roads 1,638 (29.9%) Railways 272 (5.0%) Coastal Shipping 2,445 (44.7%) Aircraft 9 (0.2%)
Total 5,468 (million ton-km)
Figure 2.2 Share of Inter-City Expressways in Domestic Transportation
O
2.2 Countermeasures against Traffic Congestion
The most effective countermeasure is to increase road capacity and to complete the nationwide network of inter-city expressway. To meet this requirement, the Japanese
Government decided to construct 11.520 km of inter-city expressway network, of which 5,614 km has already been completed. This level of road infrastructure is low compared to the standard in industrialized countries on the basis of population, area, GNP, number of automobiles, and vehicle-km statistics (see Table 2.2).
Table 2.2
International Comparison of Expressways
Country Japan U.S.A. iFormerWes U.K. France Italy
. i Germany: Length km 5,929 72,857 8,959 2,903 7,450 6,767 Length km Landarea 10,000km 157.0 77.7 360.4 118.9 135.1 224.6 Length km Population 10,000 0.48 2.88 i 1.40 * 0.51 1.31 * 1.19 ... ... ... . ... ... I... ... ... length km
Area x Popuration J10,000xO,km 2
8. 67 14.97 22.44 7 76 i 13.28 . 16.32 ... ... ... ... .... . ...
Length km .. . i .
.
Automobile ownership 10,000vehcles 0. 9 3 . 8 .2 6 8 1 .0 9 2. 81 2 . 20 ...nn.'. ... .... '... t... '... . ... 1. ... ... ; ...
Annual average km/year
length of constructio 260 501 i 181 .. 200
(1985-1989) . ,
Source: Ministry of Construction, (1993), ROAD HANDBOOK. Tokyo
Note: 1. Length is based on "World Road Statistics 1992" (IRF), as of the end of 1990.
2. As of the end of 1991 for France; as of the end of 1989 for Italy; length of Interstate Highway as of 31 December 1991 in "Highway Statistics 1991" for U.S.A.; length of expressways as of the end of 1992 fiscal year for Japan.
3. In New Road Improvement 6-Year Program starting in 1992, U.S.A. plans to construct 155,000 miles (approximately 248,000 km) as National Highway System.
4. Population is based on "Monthly Bulletin of statistics, December 1992," and as of the midpoint of 1991.
5. Land area is for 1990 in "international statistics Abstract 1992/1993" (management and
coordination Agency)
6. Automobile ownership is based on "Automobile Statistics in Major Countries 1992" (Japan automobile manufacturers Association), and as of the end of 1991.
7. Annual average length of construction for the former West Germany is an average of
2.2.1 Reconstruction
Reconstruction work of the existing bottleneck section is the most effective countermeasure against traffic congestion by increasing its road capacity. It requires much expenditure and a long construction period, however, slow but steady progress has
been made in recent years. The Tomei Expressway and The Meishin Expressway which were constructed in the earliest stage, have been playing an important role as an artery
indispensable for daily life and economy for more than a quarter century. These expressways have experienced rapid motorization, and their traffic volume has greatly increased beyond their original design level, thereby inducing frequent traffic congestion. Therefore the reconstruction of these inter-city expressways started as a response to an urgent problem and is now under way in the sections where the traffic volume is
extremely large.
2.2.2 New Tomei Expressway and Meishin Expressway
The JHPC has a plan to construct the Super-Expressways which permit highspeed driving at approximately 140 km/h. After completion of these new expressways, their six-lane carriageways will support the heaviest traffic volume of this section, however, it may not happen until the second decade of the next century.
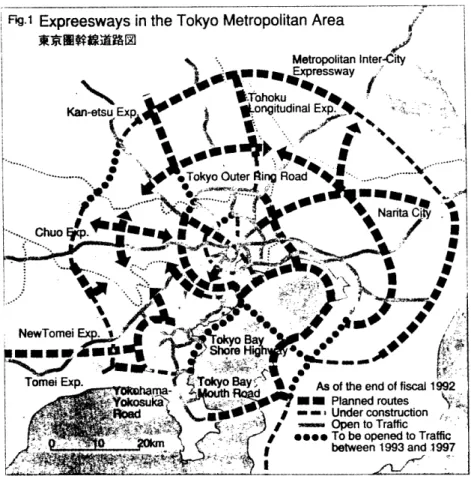
2.2.3 Completion of the Inter-City Expressway Network in the Tokyo Metropolitan Area
From the 1950's until the mid 1960's, the expressway network which comprised the skeleton of the Tokyo metropolitan area had been the subject of careful study which resulted in the formulation of the "Three Rings (Central Circular Route, Tokyo Outer Ring Road, and Metropolitan Inter-city Expressway) and Nine Radials." Almost 30 years have passed since this plan was first conceived, and at present, Nine Radials have been constructed according to the original concept. However, with respect to the Three Rings, by 1987, only the east half of the Central Circular Route had been placed in service. In
November 1992, a northern part of the Tokyo Outer Ring Road started its service.
The west half of the Tokyo Bay Shore Highway is near completion, and Trans-Tokyo-Bay Highway will be completed in spring, 1997. The construction of the inter-city expressway network is making little progress, however, it is alleviating congestion problems gradually in the Tokyo metropolitan area. By the completion of the network, which may not occur until the middle of the next century, the congestion problems will dramatically improve.
Figure 2.3 Expressways in the Tokyo Metropolitan Area
2.3 Advanced Traveler Information Systems
2.3.1 Historical Background
In 1963, for the first time since the establishment of the JHPC, a section (71 km) of the Meishin Expressway was opened to traffic. At that time, "traffic patrol squads" were already organized in order to control traffic. The tasks of traffic patrol squads include immediate actions in case of accidents, removal of obstacles to traffic, aid to disabled cars, and collection of traffic information. This was the beginning of the traffic
management systems of the JHPC. (These traffic patrol squads have no police powers, so
they can not issue tickets to violators. However, as road administrators they can control
vehicle restrictions, especially against overweight trucks. Before the traffic patrol squads were organized, it was discussed if they should have police powers or not. The security officers of the former Japan National Railways had police powers in the railroad
territory.)
In 1969, the Tomei Expressway was completed, and also sections of the Chugoku Expressway and Kinki Expressway in the Osaka metropolitan area were opened.
Besides, the network of the Hanshin Expressway Public Corporation (urban expressways in the Osaka metropolitan area) had expanded. The congestion on the Meishin
Expressway in the Osaka metropolitan area became worse than ever. Moreover, an international exposition was planned to be held in Osaka for six months from March 1970. At this time the comprehensive traffic management system was introduced to the expressways in the Osaka metropolitan area. The traffic information was gathered by vehicle detectors and traffic patrol squads, and sent to the traffic control center where the dispatchers controlled variable message signs on the expressways. This system was the prototype of the traffic management system of the JHPC.
The New Tokyo International Airport, which is 70 km away from downtown Tokyo, was opened in May 1978. After the completion of the Tokan Expressway in April 1982, passengers for the airport became able to choose among two alternate routes which are both inter-city expressways. However, the routine congestion occurred especially during the morning and evening peak hours, and some passengers missed their flights due to
traffic delay. In order to minimize the traffic delay and make effective use of the road capacity by sharing traffic demand between the two routes, through variable message signs the provision of traffic information to drivers for their route choice started (see
Figure 2.4).
WIDE AREA TRAFFIC INFORMATION
Shortcut to the center of Tokyo, Take the Tokan Expressway
Length of the back up:
Keiyo route 13 km
Tokan route 5 km
Figure 2.4
Recommendation of a Shortcut
This attempt succeeded in effective use of the expressways and became popular among drivers. In addition to the length of the back up, the JHPC tried to indicate travel time for both routes, however, the highway police interfered with this and the JHPC postponed this attempt. The police understand that provision of traffic information is under the jurisdiction of the National Police Agency, not of the JHPC or other road administrators. However, historically traffic information on expressways has been provided by the JHPC and the other expressway public corporations, because all
expressways in Japan are toll roads and users of expressways have required a high level of traffic information services. This fact constrains the police and makes them resistant to further progress in ATIS implementation. In recent years, urban expressway public corporations started to provide travel time, and they suffered from obstructions by the
police.
2.3.2 Traffic Management Systems (TMS)
Road administrators provide road and traffic information that benefits highway users by assuring highway functionality despite impeding factors, such as congestion,
accidents, roadwork for maintenance and repairs, snow removal and ice control, falling objects, as well as hazardous driving conditions caused by rain, snow and ice, fog, wind,
and earthquakes. The purpose of TMS is to encourage drivers to make appropriate decisions; road administrators also solicit drivers' caution by imposing traffic restrictions that counter the effects of impeding factors. This activity maintains a smooth traffic flow
and ensures safety.
Incident detection and follow-up action to remove incidents
The road administrator, such as the JHPC or other urban expressway public
corporations, sets up a traffic control center for the TMS. The following is an
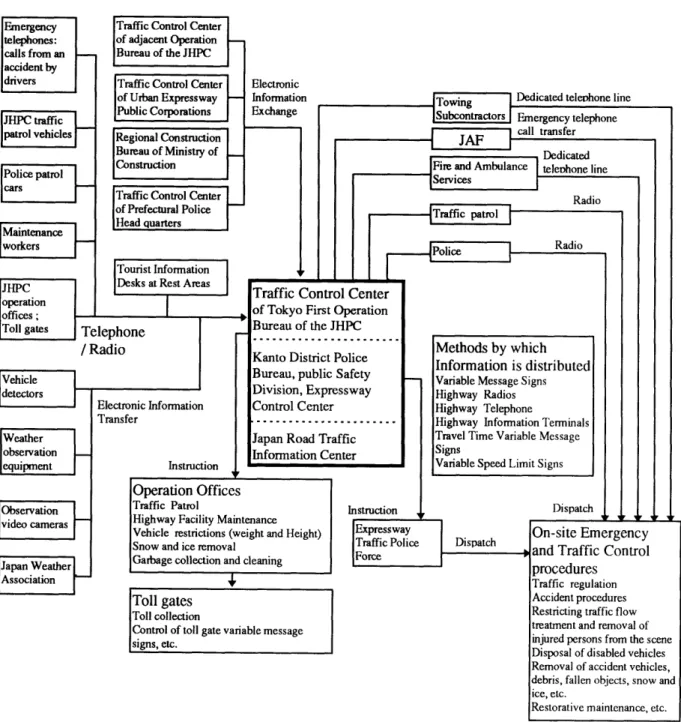
introduction to the TMS giving the example of the Tomei Expressway. In Figure 2.5,
general idea about TMS is shown.
The traffic control center gathers round-the-clock information on road, traffic, and weather conditions, as well as other abnormal situations. On the other hand, the road administrator organizes traffic patrol squads as mentioned above. They collect traffic relevant information by means of regular and special road patrols 24 hours a day. Information on accidents or vehicle breakdowns comes through the emergency telephones installed roadside at one km intervals. The traffic patrol squad is then
dispatched and it will take measures to deal with accidents and traffic congestion, such as
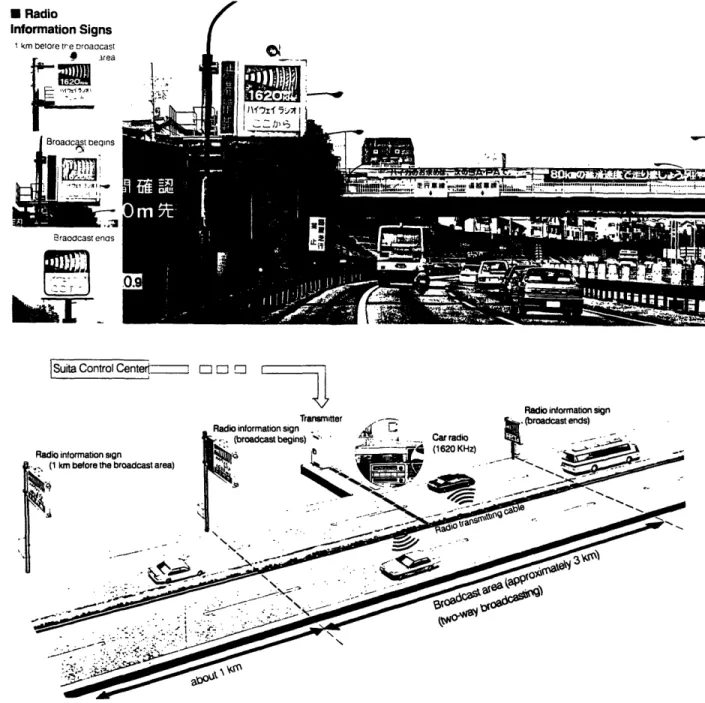
by imposing traffic restrictions, surveying for recovery work, and for preventing secondary accidents, and giving necessary aid. At the same time, in response to the information, the traffic control center dispatches the highway police squads, the fire department, rescue teams, JAF (Japan Automobile Federation: corresponds to American Automobile Association (AAA)), towing subcontractors as well as traffic patrol squads. On the operation panel at the traffic control center, data on an incident are entered into a computer. Information for drivers is sent by computer to variable message signs, Highway Radio transmitters, and Highway Telephone information banks to alert drivers to the problem. The traffic control center's computer contains prerecorded message
fragments relating to accidents, breakdowns, and weather conditions. The computer pieces together an audio announcement for the Highway Radio and the Highway
Telephone explaining the incident from the message fragments. The dispatchers simply enter the lane direction, nearest kilometer marker, and other details of the incident.
Emergency telephones: calls from an accident by drivers JHPC traffic patrol vehicles Police patrol cars Maintenance workers Vehicle detectors Weather observation -equipment _ Observation video cameras Japan Weather Association Information Gathering ITourist Information Electronic Information Transfer Instruction Electronic Information Exchange Information Processing
Towing Dedicated televhone line Subcontractors Emergency telephone I c all ransfer _
Fire and Ambulance Services Instruction Dedicated telephone line Dispatch Expressway
Traffic Police Dispatch Force
Information Distributing
Figure 2.5 Traffic Management Systems Traffic Control Center
of adjacent Operation Bureau of the JHPC
Traffic Control Center of Urban Expressway Public Corporations Regional Construction Bureau of Ministry of Construction Traffic Control Center of Prefectural Police Head quarters
Radio
Traffic Control Center
of Tokyo First Operation Bureau of the JHPC Kanto District Police Bureau, public Safety Division, Expressway Control Center
...
Japan Road Traffic Information CenterMethods by which Information is distributed
Variable Message Signs Highway Radios Highway Telephone
Highway Information Terminals Travel Time Variable Message Signs
Variable Speed Limit Signs
Operation Offices
Traffic Patrol
Highway Facility Maintenance Vehicle restrictions (weight and Height) Snow and ice removal
Garbage collection and cleaning
; ;~
.1
Toll gates
Toll collection
Control of toll gate variable message signs, etc.
On-site Emergency and Traffic Control procedures
Traffic regulation Accident procedures Restricting traffic flow treatment and removal of injured persons from the scene Disposal of disabled vehicles Removal of accident vehicles, debris, fallen objects, snow and ice, etc.
Restorative maintenance, etc.
On-site Procedures - _ L; L -I l
__ - - I
JNI
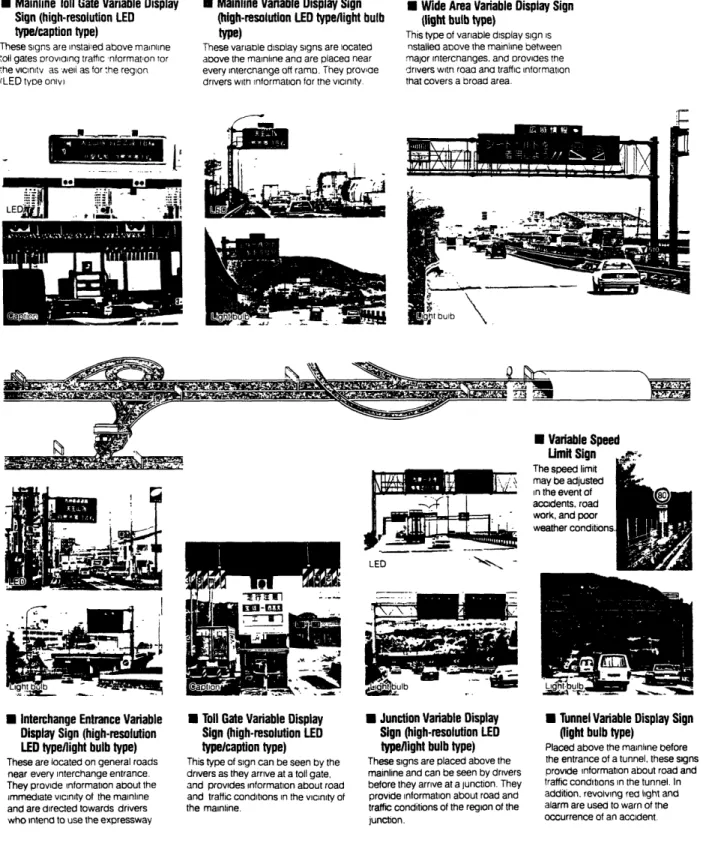
I I l , FThe variable message signs, which can relate traffic congestion information at one km intervals or information on traffic restrictions due to weather or accidents, offer detailed information using characters and pictographs. The whole system is set up to ensure that accurate information is provided to travelers as quickly as possible. When vehicle detectors, which are installed every two km (or every one km in places particularly prone to bottleneck points), detect that the average speed of vehicles has dropped below 40 km/h, the computer decides that congestion has occurred and automatically adjusts the messages on the variable message signs and the information broadcast over the Highway Radio and the Highway Telephone.
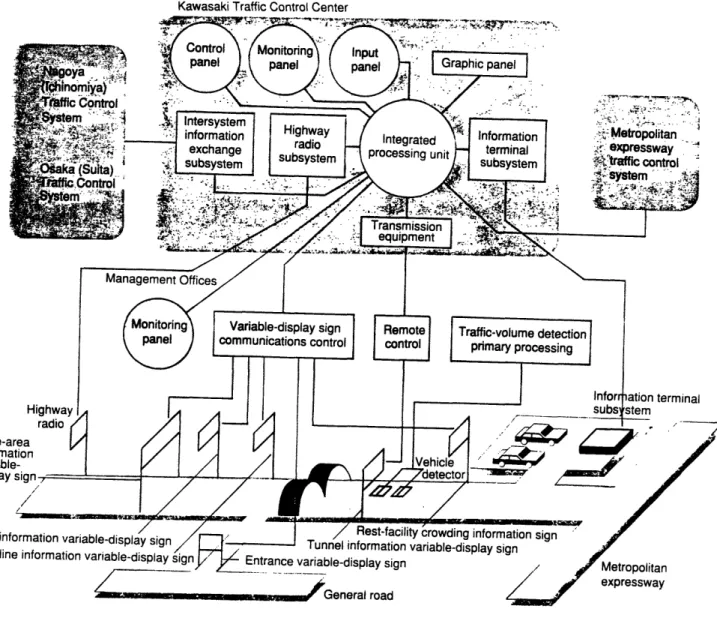
2.3.3 ATIS on the Tomei Expressway
The ATIS on the Tomei Expressway use some of the latest computer and fiber optic
technologies (see Figure 2.6). Their distinctive features are as follows:
Traffic condition monitoring subsystem
Traffic volume and vehicle speed are measured by detectors installed along the lanes of the expressway at two km intervals (one km interval along stretches of frequent
congestion). Using criteria set forth in a manual, average speed data sampled every five minutes are used to determine the length of the back up automatically.
Remote monitoring and control subsystem (see 2.3.2)
This system for monitoring and controlling traffic information consists of equipment for transmitting information, and for integrating and processing it. Whenever an
unanticipated event such as an accident occurs, traffic information is entered into the system via the event control method: a dispatcher at the traffic control center inputs data of an incident relating to time, location, causes, and current situation (obtained from traffic patrol vehicle reports, emergency telephone calls, etc.), using a video display terminal. These data are then computer-processed according to set procedures to control the number and location of the variable message signs and the messages to be displayed.
Meanwhile, the processed information appears on graphic panels in color-coded display, allowing an instant assessment of what happened and where. The information is then disseminated to the Highway Radio subsystem and other systems, where it is
accessible on-line. Thereafter, traffic volume data are automatically processed to determine congestion conditions, and the Variable Message Signs, the Highway Radio broadcasts, and the Highway Information Terminal subsystem are updated every five minutes.
Kawasaki Traffic Control Center
. . '->Jer '; ;F -.. . · ,..
Control Monitoring Input
panel panel panel Graphic panel
-ffc Control
~
''
'-::
-~
.,-
F---Intersystem---~
exchange ado Integrated Information Metpoitan
;aa(
ss i)s m us t pnexpressway-Processing unit subsystem trafficcontrol
~m+'--~.
.fControlha
~~~(~..s~ita)_.,
:..~:.~:..\.
.:..~ ...~
-
~::.j
sutbyl__~.~.~._j
suosystem
XksE I.3v. ·
-·a,~·,,
,-
Transmision .. ^nManagement Offices
Monitoring Variable-display sign Remote Traffic-volume detection panel communications control control primary processing
Infor ation terminal
Highway sub tem
radio
'ea
tion V
sign etector
/
_
7
_
_s
A_
M
/ Rest-facilitycrowding information sign Local information variable-display sign / '1 Tunnel information variable-display sign
Mainline information variable-display sign Entrance variable-display sign
/-p General road
Metropolitan expressway
Figure 2.6
ATIS on the Tomei ExpresswaySource: Maeda, Y., (1991), "Unanticipated Events on National Expressways," the wheel extended, No. 76, Toyota Motor Corporation, Tokyo.
Wide-ar informa variable display., -r7 ei
Variable message sign subsystem (see Figure 2.7, 2.8, 2.10)
Variable message signs at critical locations have been upgraded from older light-bulb matrix types to signs using light-emitting diodes (LEDs) for message display. These have the following unique characteristics:
1) They are very effective in terms of visibility and attractiveness for displaying high-definition Chinese characters and graphic information thanks to improved resolution and color display (red, amber, green) provided by the LEDs.
2) They offer several ways to display information, including event control (described above), flexible control of display patterns, preset messages (location, causes, etc. for a total of 255 messages), and text control, which permits a speedy response to different
events.
3) They use fiber-optic cable to transfer at high speeds (19,200 bps) the massive amount of data needed to control high resolution LEDs and color data effectively.
2 kilometers Ahead The meaning of this variable message
Accident Congestion) sign is "10-km congestion due to an
cIdent3 minutes accident is starting 2 km ahead, and it
0 km 30 m utes takes 30 minutes to go through the congestion," in compact expression using Chinese characters.
Figure 2.7 Example of a Variable Message Sign
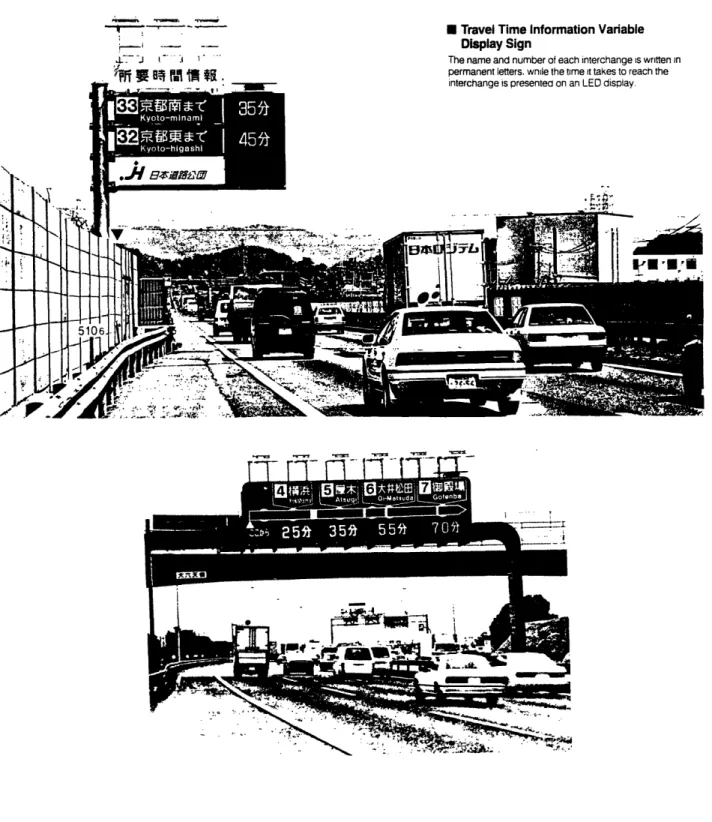
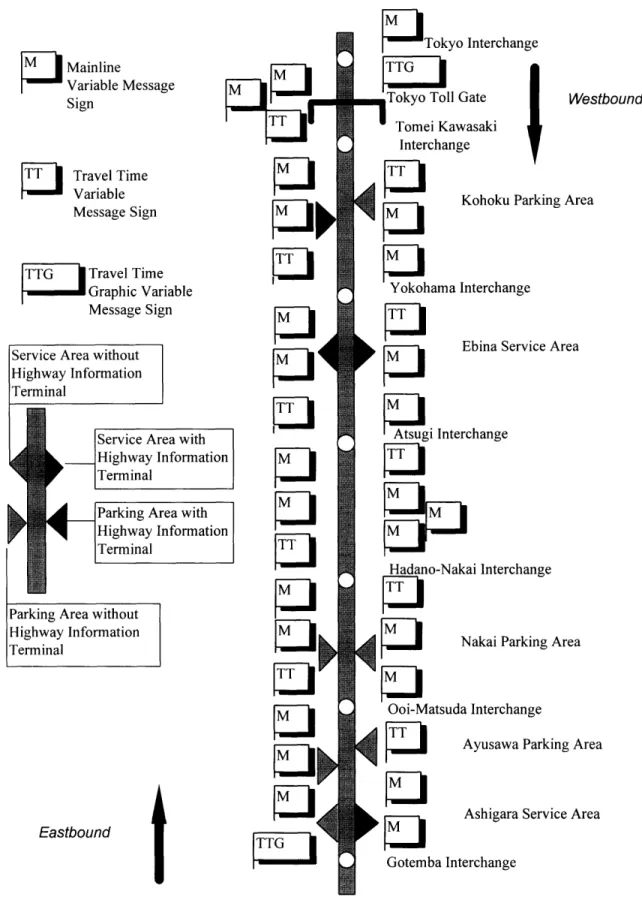
Travel time information subsystem (see Figure 2.9)
Users of inter-city expressways have come to depend on high quality information. To satisfy their requirements, travel time information has recently been provided by LED signs. This continuously operating system automatically provides the drivers with up-to-minute information.
On the Travel Time Variable Message Sign, the name and number of each interchange is written in permanent letters, while the travel time that it takes to reach the interchange
is presented on an LED display. Each Travel Time Variable Message sign is located on the roadside after an interchange and a road sign (which lists distances to the three main
interchanges).
Time units displayed on the sign vary; travel times under one hour in length are displayed in units of five minutes, times of up to two hours in units of ten minutes, and those longer than two hours display "two hours +." If the traffic is moving normally, times are displayed with green letters. When traffic back ups occur, the times are
displayed with amber letters. If the travel times exceed two hours, they are displayed in red letters. Road closure and congestion caused by accidents or road work and so forth, are indicated with a red horizontal line, because it is quite difficult to predict the travel
time in such cases.
The Travel Time Graphic Variable Message Sign indicates congested sections graphically Congested sections are displayed with amber stripes on a column graph which repents an approximately 100 km-segment of the Tomei Expressway. Multiple back ups are likely to occur simultaneously in this segment. Travel times to reach several
exits are also displayed on the Travel Time Graphic Massage Sign as same as on the
Travel Time Variable Message Sign. Drivers can easily understand the location and the length of the back ups and the traffic conditions about accidents or road closures as well as travel times to major interchanges. Two Travel Time Graphic Variable Message Signs (eastbound and westbound) are installed and in operation on the Tomei Expressway at this point.
In order to calculate the travel time, at first the average speed of each segment is calculated by means of vehicle detectors that are installed under the lanes approximately every two km. Then the travel time between locations of vehicle detectors is computed and displayed on the appropriate travel time variable message signs. Travel time information is also updated every five minutes.