HAL Id: insu-02417211
https://hal-insu.archives-ouvertes.fr/insu-02417211
Submitted on 20 Dec 2019
HAL is a multi-disciplinary open access
archive for the deposit and dissemination of sci-entific research documents, whether they are pub-lished or not. The documents may come from teaching and research institutions in France or abroad, or from public or private research centers.
L’archive ouverte pluridisciplinaire HAL, est destinée au dépôt et à la diffusion de documents scientifiques de niveau recherche, publiés ou non, émanant des établissements d’enseignement et de recherche français ou étrangers, des laboratoires publics ou privés.
the Temporal Pattern of Soil and Stream Water
Dissolved Organic Matter
Guillaume Humbert, Thomas Parr, Laurent Jeanneau, Rémi Dupas, Patrice
Petitjean, Nouraya Akkal-Corfini, Valérie Viaud, Anne-Catherine
Pierson-Wickmann, Marie Denis, Shreeram Inamdar, et al.
To cite this version:
Guillaume Humbert, Thomas Parr, Laurent Jeanneau, Rémi Dupas, Patrice Petitjean, et al.. Agri-cultural Practices and Hydrologic Conditions Shape the Temporal Pattern of Soil and Stream Water Dissolved Organic Matter. Ecosystems, Springer Verlag, 2020, 23 (7), pp.1325-1343. �10.1007/s10021-019-00471-w�. �insu-02417211�
Agricultural practices and hydrologic conditions shape the temporal
1
pattern of soil and stream water dissolved organic matter
2
Short title:
3
Spatiotemporal controls of soil and stream water DOM
4
Authors:
5
Guillaume Humbert*a, Thomas B. Parr b
, Laurent Jeanneauc, Rémi Dupasa, Patrice Petitjeanc, Nouraya Akkal-Corfinia, Valérie
6
Viauda, Anne-Catherine Pierson-Wickmannc, Marie Denisc, Shreeram Inamdarb, Gérard Gruauc, Patrick Duranda, Anne
7
Jaffrézica
8
* Corresponding author (Present address) 9
Sorbonne Université, UPEC, CNRS, IRD, INRA, IEES, F-75005 Paris, France
10 [email protected] 11 Affiliations 12 a
AGROCAMPUS OUEST, INRA, SAS, F-35000 Rennes, France
13
b
University of Delaware, Department of Plant and Soil Science, Newark, DE, 19716, United States
14
c
Univ Rennes, CNRS, Géosciences Rennes, F-35000 Rennes, France
15
Author contributions
16
GH, LJ, PP, ACPW, GG, and AJ designed the experiment, GH, LJ, RD, PP, MD collected the hydro-17
chemical data. NAC and VV collected and analyzed the agricultural land and management data, GH 18
and TBP analyzed the data, all authors contributed to writing the paper. 19
Abstract
20
This study investigates the combined effects of land management, and hydrology on the temporal 21
dynamics of dissolved organic matter (DOM) quantity and composition in stream water and 22
groundwaters in an agricultural watershed. We assessed dissolved organic carbon (DOC) 23
concentrations, DOM UV-Vis absorbance, and DOM fluorescence in groundwater under cultivated 24
upland, riparian grassland, and riparian woodland land covers, as well as in the stream water at the 25
watershed outlet and livestock-impacted runoff. During one year, stream water and groundwater 26
were monitored weekly to biweekly, complemented by sub-hourly stream sampling during 7 storm 27
events. Results showed that: i) Groundwater DOC concentration was lower in cultivated upland 28
(6.4 ± 5.6 mg l-1) than in riparian grassland and woodland (22.4 ± 13.7 mg l-1 and 17.2 ± 9.9 mg l-1, 29
respectively). ii) The proportion of microbially-processed compounds decreased in the order upland 30
cropland > riparian grassland > riparian woodland. iii) Principal component analysis (PCA) of 31
groundwater DOM revealed a change in composition indicating that low aromaticity microbially-32
processed compounds were preferentially exported to the stream. iv) PCA of stream DOM indicated 33
that seasonal increases in groundwater elevation expanded the contributing source areas, thereby 34
increasing the connectivity between upland croplands and the stream, which amplified the effects of 35
cultivation on fluvial DOM during the winter. v) Storm events occurring after manure application in 36
spring produced hot moments of manure-derived protein-like DOM transport to streams. Together, 37
these results suggest that cultivated uplands in agricultural lands using animal manure as fertilizer 38
may leach more DOM than vegetative buffers. 39
Key words: DOM fluorescence, groundwater, agricultural watershed, riparian soils, buffer strip,
40
animal manure 41
Highlights
42
- Cultivation increased microbially processed DOM in groundwater 43
- Groundwater elevation increase amplified the effects of cultivation on fluvial DOM 44
- Manure-derived DOM can be transported to the stream during storm events 45
Introduction
46
Cropland and pasture account for nearly 40% of Earth’s land surface (Foley and others 2005). 47
The production and management practices (e.g. tillage, engineered drainage, and organic and 48
inorganic fertilizer application) used on these lands are biogeochemically reactive with direct and 49
indirect effects on the carbon cycle. Frequently overlapping temporally and spatially, the net effect of 50
these practices on carbon sequestration in terrestrial soils (Han and others 2016), transport to, and 51
processing in fluvial networks (Stanley and others 2012) varies with environmental context. Much of 52
the carbon export from terrestrial soils occurs as dissolved organic matter (DOM) (Stanley and others 53
2012) and during high discharge periods (Humbert and others 2015). The quantity and composition 54
of this terrestrially derived DOM affects aquatic ecosystem functions and derived ecosystem services 55
(Wallace and others 2008). However, a better understanding of the linkages between management 56
actions and ground and surface water DOM dynamics is needed to enhance science-based 57
management and restoration solutions (i.e. practices to maintain ‘natural’ DOM regimes; Stanley and 58
others 2012). 59
Agricultural land use and management affect the quantity and composition of soil and 60
stream water DOM. These influences can be conceptualized as the combined effects of short- and 61
long-term positive and negative feedbacks (Chantigny 2003). Liming, animal manure, and fertilizer 62
application are examples of practices with short-term effects on DOM quantity and quality. Shifts in 63
vegetative cover type and quantity of plant litter returned to the soil are examples of practices 64
driving long-term effects. In soils, forested and arable lands typically differ in DOM quantity and 65
composition. The net effect of this is that forest soils typically contain a larger proportion of high 66
molecular weight DOM that is less microbially decomposed, whereas cropland or pasture commonly 67
contain a greater proportion of low molecular weight DOM that is more highly decomposed or 68
microbially derived (Chantigny 2003). However, the degree of difference between ‘natural’ and 69
agricultural land covers depends on landscape context, spatial scale, and temporal scale (Stanley and 70
others 2012). Therefore, understanding the differences in DOM composition between arable soils 71
and non-cultivated soils, such as in tree or grass buffers may provide a useful tool in assessing degree 72
of impact agriculture has on surface water and the effectiveness of best management practices in 73
reducing that impact. 74
While these agriculturally driven changes to soil DOM quantity and composition do not 75
necessarily change the quantity of DOM exported from watersheds to surface waters, they do alter 76
the composition frequently towards more microbially-processed sources (Wilson and Xenopoulos 77
2009; Williams and others 2010; Graeber and others 2015). This may occur through several different 78
hydrologic and microbial processes. Subsurface drainage can transport microbially processed DOM to 79
streams from deep, organic-poor soil horizons (Dalzell and others 2011). In streams with sufficient 80
light, nutrient enrichment may enhance in-stream algal productivity and release of exudates (Stanley 81
and others 2012). Finally, terrestrial DOM altered by agricultural practices can be transported to the 82
stream from arable soils through seasonal and event-driven changes in water flow paths (Fuß and 83
others 2017; Fasching and others 2019). The dynamics of this process, while better understood at the 84
storm event scale (Naden and others 2010; Singh and others 2014) are understudied at the seasonal 85
scale (Shang and others 2018). However, the latter approach can contribute to better understand the 86
environmental and ecological controls that drive contradictory stream DOM responses to agricultural 87
management of lands (increasing the proportion of DOM compounds with high molecular weight; 88
Graeber and others 2012; Shang and others 2018). 89
Seasonal changes in groundwater elevation regulate the hydrologic connectivity between a 90
stream and its watershed resulting in variable source areas contributing to streamflow. Under the 91
assumption of conservative transport, each source area contributes a unique quantity and 92
composition of stream DOM (Laudon and others 2011). For example, Lambert and others (2013) 93
showed that a strong change in the isotopic composition of stream DOM toward the one of upland 94
sources was related to the rise of the upland groundwater. These drivers of stream DOM dynamics 95
are periodic mechanisms with greater seasonal than inter-annual variability (Humbert and others 96
2015). Agriculture impacts the spatial distribution and timing of OM inputs within a watershed and 97
seasonal and event-driven hydrology regulate the spatial extent of the contributing area, however, 98
their combined effects are seldom considered. 99
Riparian wetlands are typically a dominant source of DOM export during stormflow in the 100
headwater watersheds (Morel and others 2009), however in agricultural watersheds, management 101
practices can introduce novel sources of DOM which may come to dominate exports during 102
stormflows (Naden and others 2010; Singh and others 2014). During a brief period (<1 month) 103
following surficial manure application, storm events can cause the ‘pulsed’ transport of manure-104
derived DOM to stream ecosystems. During these pulses, the flux of manure-derived DOM is small 105
(0.004-0.016%) relative to the total mass of manure applied (Naden and others 2010; Singh and 106
others 2014). However, strong changes in DOM optical properties indicated that its contribution to 107
stream water DOM exceeded those from other terrestrial sources. This leaves a large pool of 108
manure-derived organic matter that can feed medium to longer-term biogeochemical reactive 109
processes and transports. This longer-term potential of the flux and its DOM signature have not been 110
investigated, but may be important as seasonal variations in groundwater hydrology enhance the 111
connectivity of agricultural lands with surface waters. 112
To address the critical knowledge gap regarding the effect that land management has on 113
aquatic DOM, we investigated how different watershed sources, cultivated soils receiving manure 114
applications and non-cultivated riparian grassland and forest, contribute to stream water DOM. We 115
hypothesized that seasonal interactions between hydrology and agricultural practices would impact 116
the composition of DOM in stream water and groundwater. We tested this hypothesis by 117
characterizing DOM quantity and composition in the stream and its primary DOM sources of an 118
intensively farmed watershed (i.e. groundwater in the riparian grasslands, riparian woodlands and 119
upland croplands; livestock-impacted runoff) during different hydrologic conditions (i.e. seasonal and 120
storm) over the course of a year. Our specific objectives were (i) to differentiate stream water DOM 121
sources using their fluorescent dissolved organic matter (FDOM) composition; (ii) to describe the 122
dynamics in DOM composition of groundwater over the year; and (iii) to assess the contribution of 123
various sources to stream DOM across seasonal and event-driven hydrologic conditions. By providing 124
a mechanistic understanding of source contributions to the stream DOM quantity and composition, 125
this study furthers efforts to assess the impact that agricultural practices may have on the 126
environment. 127
Materials and methods
128
Study watershed
129
The Kervidy-Naizin watershed (KN) is a 5 km² agricultural watershed that is part of the Agrhys 130
environmental research observatory in Brittany, France (Figure 1). The watershed is drained by an 131
intermittent 2nd order stream. The riparian zone is close-canopied with little light reaching the stream 132
channel. The climate is temperate oceanic, with average annual (2000-2014) rainfall of 845 mm, 133
specific discharge of 341 mm, and temperature of 11.2 °C. Elevation ranges from 93-135 m above sea 134
level, with gentle slopes < 5% (Figure 1a). Previous research on groundwater fluctuations and soil 135
moisture deficit assessments in this watershed have defined three hydrologic periods or 136
“hydroseasons” (Figure S1; see details in Humbert and others 2015): (i) riparian rewetting (hereafter 137
‘rewetting’; October-December 2013), characterized by increasing riparian wetland soil moisture; (ii) 138
rise of upland groundwater (hereafter ‘wetting’; December 2013-March 2014), characterized by high 139
groundwater elevation in the upland domain, prolonged waterlogging of wetland soils, and lateral 140
water flows to the stream from wetland soils; and (iii) drying of watershed soils (hereafter ‘drying’; 141
April-May 2014), as groundwater draws down. 142
Ninety percent of the total watershed area is used for agriculture (Figure 1b, Table S1). These 143
areas are fertilized in the spring with both organic (predominantly swine slurry) and mineral 144
fertilizers. The cropping systems used in this watershed and the area allocated to each crop type 145
have changed little over the past 20 years (Viaud and others 2018). See detailed land use and 146
management summary in Text S1 and Table S1. Soils are silty loams, classified as Luvisols (IUSS 147
Working Group and others 2006), well-drained in the upland domain and waterlogged in valley 148
bottoms (Figure 1a). Approximately 20% of the watershed topsoil (< 0.4 m depth), mostly around the 149
stream network, is seasonally waterlogged and can be hydrologically connected to the stream (Figure 150
1a). On average, these seasonally waterlogged soils are covered by cropland (55%), permanent 151
grassland (29%, i.e. permanent grassland and fallow lands), and woodland (7%). While tile drains 152
were installed > 40 years ago, they have not been maintained. Therefore, it is unlikely that significant 153
quantities of runoff from upland croplands bypasses riparian areas via tile drains. 154
155
Figure 1.Location and maps of the study-site. (a) Elevation map of the KN watershed and periodically waterlogged soils
156
with redoximorphic features above 0.4 m deep (grey area). (b) Land use map and location of parcels amended with swine
157
slurry before or during the water year 2013-2014. Artificial area gathers housing and livestock buildings. Not available areas
158
are agricultural parcels where agricultural practices applied were unknown.
159
Identification of DOM sources
160
Previous studies established that stream water DOM in the KN watershed was primarily 161
allochthonous and derived from the upper layers of riparian wetland and hillslope soils (Texts S2 and 162
S3; Morel and others 2009; Lambert and others 2013). Accordingly, groundwater (or soil pore water) 163
was sampled in six sites from soil horizons at depths ranging from 0.1 to 1 m (two to four horizons 164
per site). The six sites were selected in the seasonally waterlogged zone representing three different 165
land covers at different distances from the stream (i.e. riparian grassland and riparian woodland 166
closer to the stream, and upland cropland further from the stream) (Figure 1 and Table 1). 167
Management at the cropland sites was consistent with the other cropping systems in place in the KN 168
watershed (Tables 1 and S1); with maize-cereals-vegetables rotation covering 35% of the total 169
watershed area and 47% of the seasonally waterlogged area. In addition to groundwater DOM 170
sources, livestock-impacted DOM can be transported to the stream through the surface and 171
subsurface runoff from farmyards, manure amended soils, and septic tanks (Baker 2002; Old and 172
others 2012). Swine-slurry-impacted runoff previously characterized by Jaffrezic and others (2011) 173
was used as the end member for DOM from this source in this study (Text S4). 174
Table 1. Selected characteristics of sampling sites.
175
Land use Vegetation Adjacent field Organic fertilization of field/adjacent
field Upland cropland K2 - K3
cropland maize
(Zea mays) -
400 kg C ha-1 of swine slurry applied on
May 2, 2014 (after maize sowing)
Riparian woodland K1
woodland buffer strip 50 m wide
shrubs and trees
(Populus negro, Salix coprea, Betula alba)
maize residues (Zea mays)
400 kg C ha-1 of swine slurry applied on
May 2, 2014
Riparian grassland G2 and G3
grassland buffer strip 50 m wide
unfertilized herbaceous species (Dactylis glomerata, Agrostis canina)
winter barley (Hordeum vulgare)
400 kg C ha-1 of swine slurry applied on
April 9, 2014
Riparian woodland M
woodland buffer strip 60 m wide
shrubs and trees
(Populus negro, Salix coprea, Betula alba)
maize residues
(Zea mays) n.a.
Hydrological monitoring and water sampling
176
Stream discharge (l s-1) was calculated from the stream stage (m) recorded at one minute 177
intervals using a float-operated sensor (Thalimèdes OTT, ±2 mm) and a stage-discharge relationship 178
(Figure 2a). Groundwater depth was recorded at 15-minute intervals using pressure sensors 179
(Orpheus Mini OTT, ±2 mm) along two transects of 2-10 m deep piezometers (G2-3 and K1-3, Figures 180
1 and S1). 181
A variable sampling frequency approach was used to capture the effects of land management 182
on stream water and groundwater DOM over time, and seasonal and pulsed change in water flow 183
paths (Figure 2b). Stream water and groundwater were sampled during regularly scheduled 184
‘baseflow’ sampling campaigns for DOC concentration and DOM composition every 7 or 14 days from 185
October 2013 to May 2014 (20 sampling campaigns total). The effects of land management (i.e. land 186
cover and practices) on stream water and groundwater DOM over time were investigated with these 187
samples collected whatever the discharge and groundwater levels. Although baseflow sampling 188
occasionally occurred on rising or falling limbs of the hydrograph, the composition and dynamics 189
reported here indicate that scheduled sampling predominantly reflects baseflow DOM composition. 190
Hereafter we refer to these as baseflow samples. Sampling frequency decreased to every 14 days 191
after the transition from the rewetting to the wetting period (i.e. from January 2014) due to less 192
temporal variation in hydrology and DOM composition. Drying prevented stream water sampling 193
prior to October 28, 2013, and groundwater sampling from June through October 2014. In addition, 194
stream water was sampled manually on a daily basis at the watershed outlet for dissolved organic 195
carbon concentration ([DOC]). This allowed us to assess the validity of weekly sampling for capturing 196
the stream DOM dynamics (Figure 2b). Finally, the changes in stream water DOM with management 197
practices over pulsed changes in water flow paths were investigated for seven storm events spanning 198
3 hydrologic seasons (1 rewetting season, 4 wetting season, 2 drying season) and maximum 199
discharges ranging from 49-794 l s-1. We collected samples for DOM quantity and composition at 200
30-minute intervals using a refrigerated (4°C) ISCO sampler. 201
Groundwater samples were collected with zero-tension lysimeters installed close to 202
piezometers. Three months prior to the start of our study, lysimeters were installed at 6 sites in 203
triplicate (spaced ca. 1 m apart) in 13 soil layers for a total of 39 lysimeters. The lysimeters collected 204
free-draining soil solution while maintaining in situ-anoxic conditions. 205
All samples were stored in polypropylene bottles in the dark at 4°C until filtration and 206
analysis. All manually collected samples were filtered within 24 hours, while automated ISCO samples 207
were typically filtered within 1 week. All filtration was performed with cellulose acetate membrane 208
filters (0.22 µm, Sartorius) prewashed with 500 ml of deionized water and then rinsed with sample. 209
210
Figure 2. Hydrochemical monitoring from October 2013 to May 2014. (a) Mean daily discharge. The rectangle with solid 211
thick lines indicates the time period when more than 70% of organic amendment applications occurred. Arrows indicate the
212
sampled events. (b) Stream water dissolved organic carbon concentration ([DOC]) from daily grab samples, storm events
213
(both in black dots), and regularly scheduled samples (open dots, squares, and triangles for the rewetting, wetting, and
214
drying periods, respectively).
215
DOM characterization
216
Filtered samples were analyzed for DOC concentration and DOM composition. The 217
concentration of DOC was analyzed using the high-temperature catalytic oxidation method as TC-IC 218
(Shimadzu TOC-VCSH, ±5%). Dissolved organic matter composition was characterized using ultra-violet
219
and visible light (UV-Vis) absorbance and excitation-emission matrix (EEM) fluorescence. The UV-Vis 220
absorbance measures the light-absorbing DOM (colored DOM or CDOM) and fluorescence measures 221
the part of CDOM that, after absorbing light, reemits it (FDOM; Coble 2007). The UV-Vis absorbance 222
of DOM was measured in a 10 mm quartz cell on a spectrophotometer (Perkin-Elmer Lambda 20) at 223
0.5 nm intervals from 200 to 600 nm. Specific ultraviolet absorbance at 254 nm (SUVA254;
224
l·mg C-1·m-1) was calculated as the UV-Vis absorbance at 254 nm per meter (m-1) divided by the DOC 225
concentration (mg C·l-1). Samples with higher values of SUVA254 are typically more aromatic
226
(Weishaar and others 2003). Fluorescence analysis was performed using a Perkin-Elmer LS 55 227
scanning spectrofluorometer. The EEMs were collected by scanning fluorescence emissions (em.) 228
between 250 nm to 600 nm in 0.5 nm increments at a scan speed of 1500 nm min-1 at each of the 229
excitation (ex.) wavelengths from 200-420 nm in 5 nm increments. All EEMs were then corrected for 230
instrumental bias following the manufacturer’s method, inner-filter effects (Ohno 2002), and dilution 231
(where necessary). If the prior UV-Vis measurements indicated that the absorbance at 254 nm was 232
greater than 0.3, samples were diluted to <0.2
so the
inner-filter correction procedure would be 233valid (Ohno 2002). 234
Data handling and statistical analysis
235
Parallel factor analysis (PARAFAC) was used to identify statistically independent classes of 236
fluorescent molecules (Stedmon and Rasmus 2008). The analysis was performed from 715 237
groundwater and stream water sampled during the study period. Prior to conducting PARAFAC, a DI 238
blank was subtracted from all EEMS and their fluorescence intensities were normalized by the area 239
under the Raman peak at ex. 350 nm. The PARAFAC modeling was performed in Matlab R2008b 240
using the drEEM v.0.2.0 toolbox as described by Murphy and others (2013). Due to noise at low ex. 241
and high em. wavelengths, we only modeled the EEM region within ex. 250-420 nm and em. 250-524 242
nm. To save computation time, we modeled em. at 2 nm intervals. The final model was validated by 243
split-half validation. The EEMs previously obtained from DOM in swine-slurry-impacted runoffs were 244
not used in modeling, rather they were fit to our validated model to estimate the PARAFAC scores of 245
livestock-impacted DOM sources (R2 ranging from 0.85 to 0.95, n= 6; Jaffrezic and others 2011). For 246
each component, we report PARAFAC results as absolute scores (Fmax values; Raman Units (RU)) as
247
well as percent abundance (%; individual component score divided by the sum of absolute scores for 248
all identified components in a sample x 100). We compared the PARAFAC components modeled from 249
our data set to previous studies, using a modified Tucker’s Congruence Coefficient (mTCC), with 250
values ≥ 0.95 indicative of a close match (Parr and others 2014). 251
In addition to PARAFAC components, we calculated three fluorescence indices. The 252
fluorescence index (FI) describes the relative dominance of microbially vs. terrestrially derived 253
organic matter in a sample; higher values (greater than 1.4) indicate a preponderance of microbial 254
DOM and lower values (less than 1.4) indicate predominantly terrestrial sources (Cory and others 255
2010). The humification index (HIX) describes the condensation of DOM (Ohno 2002); values range 256
from 0 to 1 and higher values indicate more condensed DOM (i.e. with higher aromaticity and 257
molecular weight). The β:α ratio, or freshness index, ranges from 0 to 1; relatively higher values 258
indicate more recently derived DOM (Wilson and Xenopoulos 2009). 259
All statistical analyses were performed in [R] (R Core Team, 2014). We estimated the 260
correlations between variables with Spearman’s rank-order correlations (rs; cor.test). We used
261
principal components analysis (PCA) to understand the responses of DOM composition as measured 262
by PARAFAC fluorescence components in stream water and groundwater to different land uses and 263
land management practices through time (FactoMineR R package; Husson and others 2013). 264
Specifically, we constructed three separate PCA analyses to assess the DOM sources diversity and the 265
contribution of these sources to stream DOM across seasonal and event-driven hydrologic conditions 266
using the percent abundance of fluorescence components. These PCAs analyzed: 1) changes in 267
composition of groundwater DOM with land cover, season and time (432 groundwater samples); 2) 268
changes in composition of stream water DOM with seasonal and pulsed changes in water flow paths 269
(93 stream water samples); 3) changes in stream DOM with management practices (31 stream water 270
samples). In all PCA analyses five supplementary variables ([DOC], SUVA254, FI, HIX, β:α) were
271
displayed to facilitate interpretation of the PARAFAC PCA results. Supplementary variables or 272
individuals are not used in the initial PCA computation, rather their coordinates are calculated based 273
on their correlations with the variables used in the PCA (Text S5). 274
Univariate and multivariate statistics were used in addition to the PCAs to assess our 275
hypotheses. Significant differences among land covers were assessed for each variable by applying a 276
paired Monte Carlo permutation test stratified by sampling date to account for potential temporal 277
variations (oneway_test, coin R package, 9999 iterations; Hothorn and others 2008). In complement 278
to the first of the three PCAs, the significance of land cover control on the composition of 279
groundwater DOM was tested using global and pairwise permutative multivariate analyses of 280
variance based on the percent abundance of fluorescence (PERMANOVA; adonis, vegan R package, 281
999 iterations; Oksanen and others 2006). Finally, we tested for the presence of dispersion effects in 282
the PERMANOVA (betadisp, vegan R package, 999 iterations; Oksanen and others 2006), to ensure 283
that the differences resulted from different mean values of groups and not from differences in 284
within-group variance (Anderson 2001). 285
Results
286
Spatial variations in quantity and composition of groundwater DOM
287
PARAFAC modeling resolved a five-component model (‘Kervidy-Naizin model’; abbreviated 288
KN1-5; Figure S2), with components similar in shape and location to those observed in previous 289
studies (Table S3). Across samples, components KN1 and KN4 comprised 37.1 ± 2% and 14.8 ± 3.6% 290
of total fluorescence, respectively. Both of these components have been associated with plant-291
derived and microbial-derived materials (McGarry and Baker 2000; Cory and McKnight 2005). The 292
KN2 fluorophore accounted for 26.8 ± 3.9% of total fluorescence and it resembled fluorescence 293
associated with plant-derived aromatic compounds in previous studies (McGarry and Baker 2000; 294
Fellman and others 2009). The KN3 component (17.9 ± 3.5%) resembled components highly 295
associated with forested land covers (Stedmon and Markager 2005; Lapierre and Frenette 2009). 296
Component KN5 (3.4 ± 2.8%) resembled protein-like fluorescence frequently associated with 297
microbially-derived DOM (Cory and McKnight 2005; Fellman and others 2009; Singh and others 298
2013). 299
The quantity and composition of DOM varied with land cover. Groundwater [DOC] varied 300
significantly (p < 0.05) among riparian grassland (22.4 ± 13.7 mg l-1; mean ± standard 301
deviation) > riparian woodland (17.2 ± 9.9 mg l-1) > upland cropland (6.4 ± 5.6 mg l-1) (Figure S3a). The 302
relative abundance of microbially processed and protein-like DOM in groundwater decreased in the 303
order upland cropland > riparian grassland > riparian woodland (p < 0.05); with averaged FI 304
(1.66 > 1.46 > 1.43), β:α ratio (0.57 > 0.47 > 0.43), %KN4 (20 > 14 > 12) and %KN5 (4 > 3 > 2) (Figures 305
S3d-e, and S3i-j). Conversely, mean %KN2 increased (p < 0.05) among the three different land covers 306
with cropland (22) < grassland (28) < woodland (30) (Figure S3g). The DOM composition was more 307
aromatic in riparian grassland and woodland than in upland cropland; with higher average values 308
(p < 0.05) for SUVA254 (3.64-3.77 > 2.86; Figure S3b), HIX (0.97 > 0.95; Figure S3c) and for %KN3
309
(19-20 > 16; Figure S3h). The %KN1 was higher in average in the upland cropland than in the riparian 310
lands (39 > 36; Figure S3f). 311
This difference in groundwater DOM composition among the land covers was depicted by a 312
PCA presented in Figure 3. The principal component axis (PC) 1 distinguished the origin of DOM 313
(plant-derived vs. microbially processed) and PC 2 distinguished its character (protein-like vs. 314
aromatic) (Figure 3a). Although the PCA (Figures 3b) shows distinct locations of land cover centroids, 315
the analysis of group dispersions heterogeneity suggests that dispersion effects are also present. This 316
means that PERMANOVA results cannot be conclusively interpreted to provide significant evidence 317
that land cover influenced the DOM composition (Table S4). Although being close to each other in 318
the PCA analysis, grassland and woodland DOM differed significantly from each other (F = 23.1, 319
p < 0.01), as revealed by the pairwise comparisons (Table S4). While the centroid of cropland DOM
320
was distinct from grassland and woodland (p < 0.01), it also had higher dispersion (p < 0.001), likely 321
due to the higher range of groundwater sampling depth and short-term effects of agricultural 322
practices. 323
324
Figure 3. Principal component analysis (PCA) of groundwater fluorescent dissolved organic matter (FDOM) composition. 325
The first two axes explain 88% of the variance in percent abundance PARAFAC components for the soil solutions of different
326
land covers. (a) Loading plot showing the contribution of percent abundance of PARAFAC components to the computing of
327
the first two principal components (PC). Blue dashed arrows indicate supplementary variables ([DOC], SUVA254, FI, HIX, β:α)
328
not used in the calculation of the PARAFAC component PCA, but do facilitate its interpretation. (b) Scores plot showing
329
annual and seasonal centroids aggregated by land cover. Annual centroids were built from 126, 119 and 187 samples for
330
cropland, grassland, and woodland, respectively. Centroids of rewetting, wetting and drying periods were built from 34-70,
331
73-98 and 11-19 samples, respectively. (c) Close-up view of scores plot showing temporal dynamics of centroids aggregated
332
by land cover. Centroids were built from 2-12, 1-12 and 4-15 samples for cropland, grassland, and woodland, respectively.
333
The FDOM composition determined for the swine-slurry-impacted runoff is presented as supplementary individual in
334
figures b and c. Its location on the score plot is indicated with brackets [PC1, PC2].
Temporal variation in quantity and composition of groundwater DOM
336
The composition and quantity of DOM were highly variable over time. However, 337
groundwater [DOC] presented similar patterns among the three different land covers (Figure S4). 338
Associated with these [DOC] dynamics, Figures S5 to S9 show for each land cover the temporal 339
variations in the groundwater % abundance of fluorescence components. Figures 3b and c map these 340
changes in the first two axes of the PCA performed from groundwater FDOM composition. 341
From the third sampling date of the rewetting period, groundwater median [DOC] decreased 342
from 10.5 to 2.5 mg l-1 in cultivated upland and from 26.5 to 6.3 mg l-1 in riparian grassland (Figure 343
S4). Main changes were observed for fluorescence components %KN4 and %KN5, with medians 344
increasing by factors ranging from 1.3 to 2.2 (Figures 3c, S5-9). Groundwater median [DOC] remained 345
rather stable over this period in riparian woodlands (ranging from 13.9 to 16.4 mg l-1), with a DOM 346
composition mainly characterized by a progressive decrease in median %KN5 from 1.73 to 1.17. 347
These changes occurred during a dry period (18 days without precipitation) within the 72-day long 348
rewetting period (216 mm of total rainfall; Figure S1). Lower groundwater elevations were monitored 349
in riparian grassland and cultivated upland than in riparian woodland. 350
Median groundwater [DOC] decreased during the wetting period (i.e. from December to 351
February; Figure S4); from 8.2 to 2.8 mg l-1 in cultivated upland, from 30.5 to 10.2 mg l-1 in riparian 352
grassland, and from 16.4 to 10.8 mg l-1 in riparian woodland. The decrease in %KN5 and increase in 353
%KN3 were the common dynamics observed for groundwater DOM composition of all land covers 354
(Figures 3c, S7, and S9). Contrasted dynamics were observed among the land covers for others 355
fluorescence components; with low decrease in median %KN2, and low increase in median %KN4 of 356
both upland cropland and riparian grassland groundwater, while these components remained rather 357
stable in riparian woodland groundwater (Figures 3c, S6, and S8). 358
Increasing median groundwater [DOC] was monitored in all land covers from March to May 359
2014 (Figure S4). This trend was rather progressive in riparian grassland and woodland, while 360
occurring mainly during the transition from wetting to drying period in upland cropland (increasing 361
from 2.8 to 6.4 mg l-1 on average). Concurrently, median %KN5 more than doubled for groundwater 362
DOM composition of all land covers (Figures 3c, S7, and S9). The protein-like signature of livestock-363
impacted DOM sources was detected in cropland groundwater throughout the drying period, with 364
the May samples, collected after manure was applied to the fields having at least a 60% higher 365
abundance of protein-like compounds compared to pre manure application April samples. A similar 366
signature was detected in the DOM groundwater of riparian grassland, but only on April 15 (first 367
green triangle in Figure 3c), though its composition was more microbially processed than the other 368
samples between February and May. 369
Superimposed on these patterns, pulsed [DOC] were observed in the groundwater of all land 370
covers subsequently to rain events responsible for increased groundwater levels during the transition 371
from rewetting to wetting period and on February 4 (Figures S1 and S4). Concurrently, the median 372
%KN5 doubled at the transition period in the riparian woodland groundwater and %KN5 increased by 373
factors ranging from 1.1 to 1.5 in groundwater DOM of all land covers on February 4 (Figures 3c and 374
S9). 375
Temporal variation in quantity and composition of stream water DOM
376
The quantity and composition of groundwater DOM from the three land covers constrained 377
the ones observed in stream water over time (Figure S3). Stream water [DOC] (5.3 ±4 mg l-1) was 378
consistently lower (p < 0.05) than [DOC] in riparian grassland and woodland groundwaters, but was 379
not significantly different from [DOC] in upland croplands groundwaters (Figure S3a). Daily stream 380
[DOC] decreased from approximately 12 to 3 mg l-1 over the course of the water year (Figure 2b), 381
with a more pronounced decrease when the water year began. Pulsed increases in concentration 382
were observed during the storm events and the rises in groundwater elevation, but were 383
progressively damped over the water year (Figures 2b, 4 and 6), as evidenced by the lack of marked 384
increase in [DOC] in February, whereas high discharge was monitored. Contrasting with this general 385
pattern, high [DOC] (i.e. >30 mg l-1) was monitored during stormflow on April 23 (Figures 2b and 6d). 386
Associated with these concentration dynamics, temporal variations in the DOM composition 387
of the stream water are detailed in figure S10 and depicted in the PCA presented in Figures 4 and 5. It 388
was conducted with the % abundance of fluorophores obtained from both baseflow and stormflow 389
samples of the rewetting and wetting periods. The PC axes 1 and 2 distinguished the stream DOM 390
sources; with PC1 negatively related to the DOM composition of riparian woodland groundwater, 391
and PC2 positively related to the DOM composition of cultivated upland groundwater (Figure 4a). 392
During the rewetting period, the composition of stream water DOM was closely related to 393
the composition of riparian woodland DOM; in the PCA plot, the ordination spaces occupied by 394
stream water and woodland groundwater FDOM overlapped (Figure 4c). Concurrent with the 395
decrease in stream water [DOC] reported during this period, a progressive increase in aromatic 396
compounds within the composition of stream water DOM can be inferred from the increase in %KN3 397
(from 15.4% to 19.3%). During the wetting period, two patterns are depicted (Figure 4e). First, the 398
composition of stream water DOM became relatively enriched in terrestrial microbially-processed 399
compounds (increases in %KN1 and %KN4, respectively; Figure S10a and d) and resembled the DOM 400
signature of upland croplands (Figure 4e). This does not exclude the contributions to the stream 401
water DOM of riparian woodland and grassland groundwater DOM. However, this riparian 402
groundwater contribution to stream water DOM has decreased during the wetting period as 403
compared to the rewetting period; there is an increasing separation between stream water and 404
riparian groundwater FDOM within the ordination spaces of PCA plot. Noticeably, the greatest 405
change in stream DOM composition occurred approximately two weeks after the rise in groundwater 406
level during the onset of the wetting period (on January 7, 2014). Second, similar to the pattern 407
observed during the rewetting period, %KN3 progressively increased in the composition of stream 408
water DOM over the course of the wetting period (Figures S10b-c). When the wetting period ended 409
(on April 1, 2014), the composition of stream water DOM decreased in %KN1 and %KN4 (by 4.7% and 410
2.6%, respectively), which was more similar to the composition of riparian groundwaters (Figure 4e). 411
412
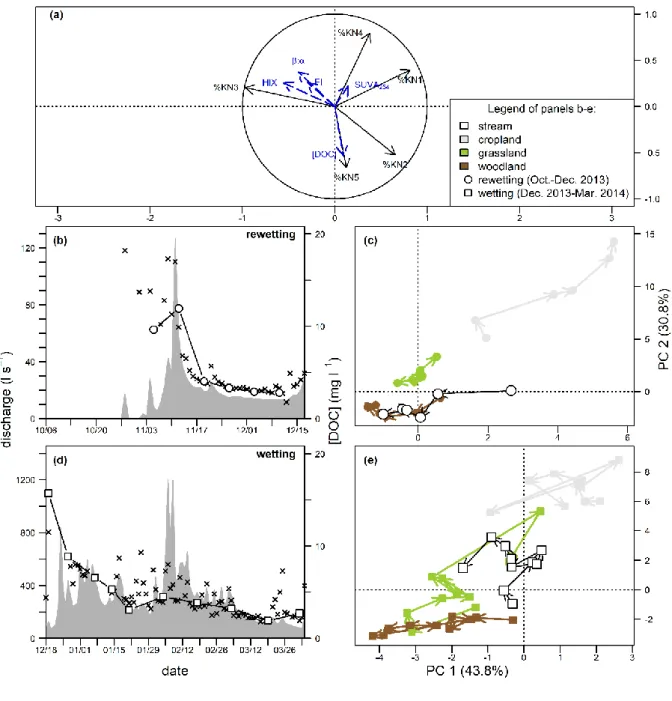
Figure 4. Baseflow dynamics of fluorescent dissolved organic matter (FDOM) composition in stream water during the 413
rewetting and wetting periods. (a) In the PCA plots, the first two principal components (PC) explain 75% of the variance in
414
percent abundance of PARAFAC components for the stream water samples of rewetting and wetting periods (baseflow and
415
stormflow samples). Loading plot showing the contribution of percent abundance of PARAFAC components to the
416
computing of the first two PCs. Blue dashed arrows indicate supplementary variables ([DOC], SUVA254, FI, HIX, β:α) not used
417
in the calculation of the PARAFAC component PCA, but do facilitate its interpretation. (b and d) Mean daily discharge (grey
418
area) and [DOC] for the daily samples (black cross) and the samples collected manually weekly or fortnightly (white
419
symbols) over the rewetting and wetting periods. Note the changes in axis scales for discharge. (c and e) Score plots
420
showing the temporal dynamics of the stream water FDOM composition over the rewetting and wetting periods. The
421
temporal dynamics of centroids aggregated by land cover as depicted in Fig. 3c are presented. Centroids were built from
12, 1-12 and 4-15 samples for cropland, grassland, and woodland, respectively. Note that each white symbol resulted from
423
the DOC concentration or the FDOM composition of a unique sample collected at the watershed outlet.
424
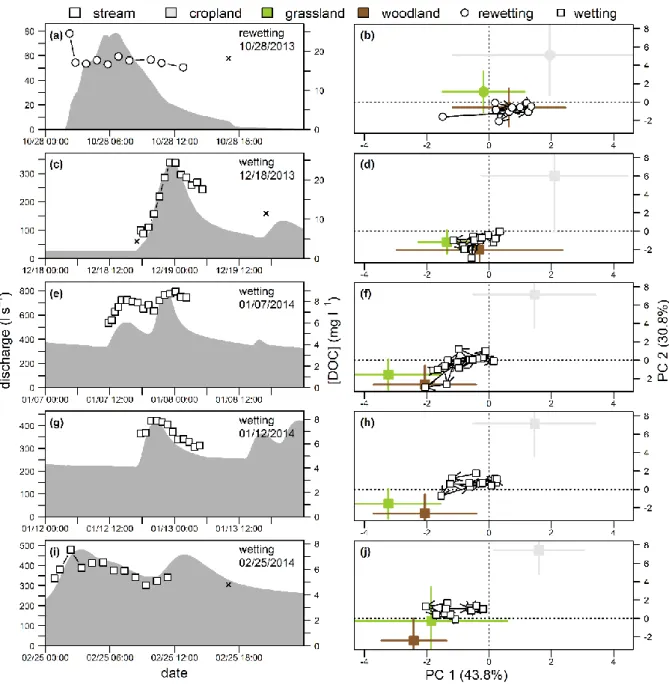
The composition of stream water DOM differed between the storm events and depended on 425
the hydroseason in which it occurred (Figures 5 and S11). In the rewetting period, during the first 426
storm event, DOM had a fluorescent composition similar to that of riparian woodland groundwater, 427
and exhibited little change in quantity and composition over the course of the event (Figures 5a and 428
b). Relative to the rewetting period, stream water DOM in the first storm event sampled during the 429
wetting period had a slightly more aromatic composition, with an increase in %KN3 from 17.3 ±0.9 to 430
18.7 ±0.5 (Figures 5b, 5d, and S11). The DOM signature of stream water was similar to both riparian 431
grassland and woodland sources. As compared to the DOM signature of the first event of the wetting 432
period, the mean %KN5 progressively decreased (from 3.2 ±0.7 to 2.5 ±0.3), while the mean %KN4 433
increased (from 13 ±0.3 to 14.2 ±0.3). However, the contribution of upland cropland DOM to the 434
stream water DOM was lesser in the stormflow of the wetting period than in baseflow of this period 435
(Figures 5f-5j). 436
437
Figure 5. Storm flow dynamics of fluorescent dissolved organic matter (FDOM) composition in stream water during 438
rewetting and wetting periods. (a, c, e, g, i) Discharge (grey area) and [DOC] for storm events (white symbols) and daily
439
samples (black cross). Note the changes in axis scales for discharge and concentration. (b, d, f, h, j) Score plots showing the
440
change in stream water FDOM composition during storm events. Mean and standard deviation of FDOM composition
441
aggregated by land cover type are presented for soil solutions sampled before or after (rewetting, figure b) the storm
442
event.Note that each white symbol resulted from the DOC concentration or the FDOM composition of a unique sample
443
collected at the watershed outlet.
444
Livestock-impacted DOM sources affected stream water DOM only during drying period 445
storm events occurring shortly after the swine slurry was applied to the soils. The PCA presented in 446
Figure 6 was conducted with the % abundance of fluorophores obtained from both baseflow and 447
stormflow of the drying period. The first and second PC axes (PC1, PC2) distinguish stream DOM 448
sources. The PC1 represented a gradient of DOM derived from livestock-impacted source to DOM 449
derived primarily from riparian woodland groundwater. The PC2 represented a gradient of increasing 450
contributions from groundwater underlying cultivated uplands (Figure 6a). Although increasing in 451
%KN5 as compared to DOM composition of wetting period baseflow (Figure S10), little variation was 452
observed over the course of the drying period baseflow, the stream DOM composition reflected a 453
mixture of riparian grassland and woodland sources. However, livestock-impacted DOM clearly 454
altered the amount and composition of stream water DOM during the two storm events. 455
The livestock-impacted DOM source used in this study had protein-like component KN5 that 456
was six to twelve times more abundant than terrestrial DOM sources. This is confirmed by the visual 457
inspection of residuals that resulted from KN fluorophores fitting to the swine-slurry-impacted 458
runoff. While the model fits the swine slurry endmember EEMs well, it appears to contain a protein-459
like component that is not fully explained by the surface and groundwater DOM model. This 460
component may not be transferred to stream water and groundwater due to rapid abiotic (soil 461
interactions) or biotic (microbial degradation) removal. During storms following swine slurry 462
application, increases in protein-like fluorescence (%KN5 ranged from 3.7 to 21) relative to baseflow 463
samples were approximately four times greater than the increases observed during storms occurring 464
before swine slurry application. For example, during the storm event on April 23, the composition of 465
stream water DOM started out similar to riparian grassland and woodland DOM. Over the course of 466
the storm its composition developed characteristics indicating high increases (2-5 fold over baseflow 467
samples) in the contributions from upland cropland and livestock-impacted sources (Figure 6e). The 468
transfer to the stream of swine slurry applied to the soils was quickly mitigated. During the event on 469
22 May, the magnitude of increase in protein-like fluorescence relative to baseflow samples was 470
<1.5. The temporal pattern was reversed, the stormflow DOM was first a mixture of DOM originating 471
from upland cropland treated with swine-slurry and then a mixture of DOM originating from riparian 472
grassland and woodland (Figure 6g). 473
474
Figure 6. Principal component analysis (PCA) of fluorescent dissolved organic matter (FDOM) composition in stream water 475
of drying period. The first two axes explain 79% of the variance in percent abundance of PARAFAC components for the
476
stream samples (baseflow and storm event samples). (a) Loading plot showing the contribution of percent abundance of
477
PARAFAC components to the computing of the first two PCs. Blue dashed arrows indicate supplementary variables ([DOC],
478
SUVA254, FI, HIX, β:α) not used in the calculation of the PARAFAC component PCA, but do facilitate its interpretation. (b, d,
479
and f) Discharge (averaged daily in b; grey area) and [DOC] for baseflow stream water and storm events (white symbols) 480
and daily samples (black cross). Note the changes in axis scales for discharge and concentration. (c) Score plots showing the
481
temporal dynamics of the stream water FDOM composition during the drying period. (e and g) Score plots showing the
482
change in stream FDOM composition during storm events of the drying period. Axis scales differed to better map the
483
temporal dynamics during the events. The FDOM composition aggregated by land cover type is presented for soil solutions
sampled during the drying period (c) and before the storm event (e and g). Centroids were built from 2-12, 1-12 and 4-15
485
samples for cropland, grassland, and woodland, respectively. Similarly, the FDOM composition determined for the
swine-486
slurry-impacted runoff is presented as supplementary individual in figures c, e, and g. Its location on the score plot can be
487
indicated with brackets [PC1, PC2]. Note that each white symbol resulted from the DOC concentration or the FDOM
488
composition of a unique sample collected at the watershed outlet.
489
Discussion
490
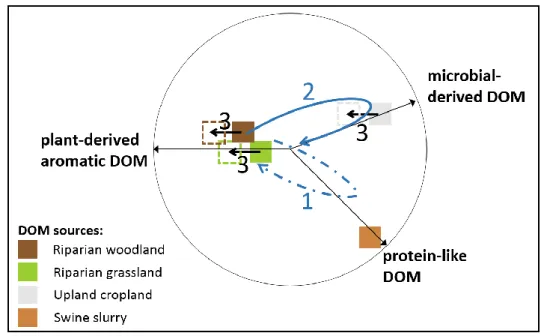
Tillage, cropping and fertilizer application alter the quantity, composition, and timing of DOM 491
export. These agricultural practices increase the proportion of protein-like compounds likely to be 492
exported at sub-hourly and annual time-scales (December-May; processes 1 and 2 in Figure 7). More 493
generally, these practices increased the signature of microbial processing in and reduced the 494
quantity of groundwater DOM under cultivated uplands compared to grassland and tree buffer 495
strips. In addition, our results suggested that seasonal waterlogging and hydrological connection to 496
the stream of soils drives the major changes in their DOM composition by increasing the proportion 497
of aromatic compounds (October-March; process 3 in Figure 7). 498
499
Figure 7. Sketch diagram summarizing the temporal dynamics of DOM composition in stream water and groundwater under 500
the combined impacts of land use, management, and hydrology. It summarizes the results of the principal component
501
analysis conducted in this study. The numbers ‘1’ to ‘3’ refer to the changes in DOM composition discussed in the text and
502
observed in stormflow shortly following application of swine slurry on cultivated uplands, baseflow of the wetting period,
503
and in groundwater during both the rewetting and wetting periods, respectively.
Short-term effects of swine slurry application on stream water and groundwater DOM
505
Climate and biogeochemically reactive management practices interact at different time 506
scales and affect the timing of agriculturally-derived DOM export. Export of swine slurry applied in 507
the uplands was greatest in the spring, when precipitation events occurred during or after 508
application periods, and briefly impacted stream water and groundwater (process 1 in Figure 7). 509
Livestock-impacted DOM was enriched in protein-like compounds (Baker 2002; Naden and others 510
2010) distinguishing it from stream water and groundwater DOM sources. In May, we observed the 511
highest abundance of protein-like compounds in the groundwater of upland croplands – after 512
approximately 400 kg ha-1 of swine slurry was applied. Similarly on April 15th, 6 days after application 513
of swine slurry in the adjacent field, we observed a pulse of protein-like compounds in the grassland 514
buffer strip groundwater. Finally, transport to the stream water of swine slurry applied on cropland 515
was evidenced during a storm event in the main application period, with pronounced increases in 516
stream water [DOC] and abundance of protein-like compounds. Similar vertical and lateral transports 517
of animal wastes were reported elsewhere at plot and watershed scales (Naden and others 2010; 518
Singh and others 2014). With precipitation intensities and durations predicted to increase across 519
Europe, careful planning of the application of organic and inorganic soil amendment will be essential 520
for protecting waterways from agricultural pollutions (European Environment Agency 2017). 521
Long-term effects of agricultural land management on the composition of groundwater DOM
522
The diversity and frequency of operations performed on the cropland (harvest removal, 523
fertilization, liming, tillage and pest management; Table S1) likely mitigate the significance of 524
differences in DOM composition observed between cultivated and non-cultivated lands. For 525
example, the strong short-term effects of swine slurry on DOM composition (see above) obscures 526
longer-term effects that management of land for cropping may have on DOM composition and 527
quantity through direct and indirect mechanisms. These mechanisms could result in lower topsoil 528
[DOC] and more protein-like and less aromatic groundwater DOM in upland cropland than in riparian 529
grassland and woodland (i.e. PARAFAC components KN1, KN4, and KN5; Figure 7). 530
Each agricultural practice can have a persistent effect on groundwater DOM through indirect 531
mechanisms that influence the processing of organic matter in arable soils. For example, previous 532
work showed that animal manure applications could explain persistent differences in DOM 533
composition of cropland groundwater (Ohno and others 2009; Bilal and others 2010). They showed 534
that these signatures were particularly persistent in soils amended with swine slurry which was 535
consistent with the results presented here. Possible explanations for the persistence of the swine-536
slurry signature in amended soils include: (i) the sorption of manure-derived compounds to binding 537
sites left free due to herbicides and biomass removal (Kaiser and Kalbitz 2012); (ii) the consumption 538
or production alteration of the protein-like DOM either directly or by changing the soil microbial 539
community (Haynes and Naidu 1998; Peacock and others 2001). Tillage of arable soils would also 540
partially explain the change in DOM quantity and composition through soil aggregate disruption and 541
increasing the rate of soil organic matter mineralization (Balesdent and others 2000; Toosi and 542
others 2012). 543
Management practices controlling vegetative biomass and the organic amendments directly 544
influence both DOM quantity and composition. Biomass removal during crop harvest combined with 545
herbicide suppression of weed growth decreases the C inputs to soil and subsequently may decrease 546
the Corg content of soil and concentration of DOC in groundwater under cropland (Chantigny 2003).
547
The lower Corg content observed in cultivated upland compared to riparian grassland and woodland
548
in this study were consistent with these mechanisms (Table S2). In addition to this, Ohno and Bro 549
(2006) reported between- and within-groups variations in the fluorescence signatures of DOM 550
extracted from plants (crops and wetland plants), manures and tree leaves, with the highest 551
variations observed within the manures group. Persistent effects of these materials on groundwater 552
DOM can be hypothesized through repetitive throughfall and/or biomass incorporation in soils 553
combined with adsorption processes to soil particles (Kalbitz and others 2000). An additional indirect 554
mechanism that would involve interactions between the initial quality of the inputs and the 555
decomposer community can also be inferred (Wickings and others 2012). The significance of 556
differences in composition of groundwater DOM observed here between riparian grassland and 557
woodland, where no management practice occurs seems consistent with these hypotheses. 558
Seasonal hydrologic control of the impact of agriculture on the composition of stream water DOM
559
Globally, agriculture frequently increases the abundance of more microbially processed DOM 560
in streams compared to watersheds dominated by ‘natural’ land cover, but our study suggests that 561
the strength of this effect may be seasonal, weakening when low groundwater levels sustain the 562
stream discharge. In headwater watersheds, the composition of stream water DOM depended on the 563
specific landscape elements connected to the stream (Laudon and others 2011). Although upland 564
croplands are located further from the stream than riparian grasslands and forests, they can 565
significantly affect the composition of stream water DOM during hydrologic wet periods when the 566
rising water table provides a hydrologic pathway to reconnect these soils. 567
The seasonal reconnection of upland croplands to the stream increased the abundance of 568
more microbially processed DOM in streams (process 2 in Figure 7). Similarly, Wilson and Xenopoulos 569
(2009) found that the strength of the correlation between agricultural land use and indicators of 570
aromaticity depended on soil moisture conditions in watersheds of Ontario, Canada; with soil 571
wetness being negatively related to stream DOM aromaticity. In contrast with these results, Graeber 572
and others (2012) observed low seasonal variation in DOM quantity and composition of agriculturally 573
impacted watersheds. The high drainage density reported in the latter study (>76% of agricultural 574
watersheds area) could explain this lack of seasonality in the stream water DOM. Indeed, subsurface 575
drainage lowers the variations of groundwater level and/or of transit time in vadose zone, 576
transporting to the stream whatever the season DOM from deep soil horizons (Dalzell and others 577
2011). However, microbially processed DOM with low rather than high aromaticity is expected to be 578
transported to the stream through subsurface drainage. 579
Preferential leaching loss of protein-like DOM from waterlogged soils
580
Due to its richness in microbially processed compounds with low aromaticity, the cropland 581
DOM pool would be more readily depleted than other watershed DOM pools. Protein-like, 582
microbially-processed DOM was preferentially and progressively leached from waterlogged soils 583
during the rewetting and wetting periods. Continuous waterlogging of all sampled soil profiles in the 584
riparian woodland during the rewetting period and in all land covers during the wetting period 585
altered the DOM that remained in groundwater towards a more aromatic and less protein-like 586
composition (process 3 in Figure 7). In addition, [DOC] decreased in watershed groundwaters during 587
these periods without increasing mineralization of soil organic matter (Figure S4). Buysse and others 588
(2016) reported for KN watershed soils low CO2 efflux during winter and related this low biological
589
activity to decreasing temperatures and soil waterlogging. The combined lack of chemical moieties 590
necessary to form strong interactions with mineral surfaces and greater water solubility of proteins 591
could explain the preferential elution and transport of hydrophilic or low aromaticity compounds to 592
surface waters (Chassé and others 2015). This preferential leaching and export of low molecular 593
weight protein-like compounds from soils to surface waters is also consistent with the observed 594
decrease in groundwater [DOC] and increase in groundwater DOM aromaticity. 595
The preferential leaching loss of protein-like DOM from waterlogged soils combined with a 596
seasonal change in production rates of these compounds could explain the seasonal dynamics of 597
stream water [DOC] observed in many headwater watersheds (Mehring and others 2013; Wilson and 598
others 2013). During both the rewetting and wetting periods, the progressive change in DOM 599
composition of watershed groundwater towards higher aromaticity suggests that the remaining 600
DOM moieties are less readily transported from soils to the stream. During these periods, supply 601
limitation of watersheds drives the stream water [DOC] and the pool of readily leachable DOM is not 602
replenished. Consequently, the amount of DOM that can be transported to the stream diminishes 603
and the stream water [DOC] decreases. Conversely during drying periods, transport limitation of 604
watersheds drives the stream water [DOC]. The production rate of readily reachable DOM moieties 605
(i.e. molecules with lower aromaticity) in watershed soils exceeds the rate of DOM export from these 606
soils. In larger rivers and open canopied headwater streams, autochthonous production can 607
significantly contribute to DOM fluxes (Kaplan and Bott 1982). However, in our system where the 608
riparian canopy is closed and little light is transmitted to the stream, we broadly estimate that these 609
fluxes would only have been significant on the last sampling date (on May 27th) where they could 610
have represented <25% of the DOM exported daily (Morel 2009). 611
In summary, this paper addressed the effects of agriculture on both groundwater and stream 612
water DOM over one water year in a headwater watershed. The PARAFAC analysis of fluorescence 613
EEM data applied in this study allowed a detailed mechanistic understanding of sources and 614
transport mechanisms within an agricultural watershed. Hot moments of manure-derived protein-615
like compounds transport to the stream water were evidenced during storm events following the 616
initial application of swine slurry on upland croplands. The seasonal rise in upland groundwater 617
drives longer period of alteration of the stream water DOM towards a more microbially processed 618
composition typical of upland croplands amended with swine slurry. These dynamics observed at 619
watershed scale were confirmed by the one observed among DOM pools. Low aromatic protein-like 620
compounds are preferentially leached from waterlogged soils that are hydrologically connected to 621
the stream. 622
Since microbially processed DOM has been shown to support high rates of in-stream 623
microbial activity (Williams and others 2010), several environmental issues related to the DOM 624
derived from cultivated and amended soils can be expected (e.g. depressed O2 levels below those
625
required for aquatic life; increased production potential of greenhouse gas). Given these risks, two 626
management options that have to be tested further can be proposed. (i) The buffer strips 627
enlargement to include all the waterlogged topsoils that can be seasonally connected to the stream 628
network through groundwater fluctuations. (ii) The determination of appropriate periods of animal 629
manure applications based on groundwater fluctuations and the watershed soil moisture rather than 630
calendar (fixed) periods. 631
Acknowledgments
632
This work was supported by the French National Research Agency [Project MOSAIC ANR-12-AGRO-633
0005]; the French Ministry of Scientific Research; the University of Rennes 1; and the French national 634
institute for agricultural research. Long-term monitoring in the Kervidy-Naizin watershed was 635
supported by ‘ORE AgrHys’ (http://www6.inra.fr/ore_agrhys_eng/). We thank all those who helped 636
with the field and lab work: Armelle Racapé, Gilles Dutin, Yannick Hamon, Nicolas Gilliet and Valentin 637 Lemée. 638 639 References 640
Anderson MJ. 2001. A new method for non-parametric multivariate analysis of variance. Austral Ecol 641
26:32–46. https://doi.org/10.1111/j.1442-9993.2001.01070.pp.x 642
Baker A. 2002. Fluorescence properties of some farm wastes: implications for water quality 643
monitoring. Water Res 36:189–95. https://doi.org/10.1016/S0043-1354(01)00210-X 644
Balesdent J, Chenu C, Balabane M. 2000. Relationship of soil organic matter dynamics to physical 645
protection and tillage. Soil Tillage Res 53:215–30. https://doi.org/10.1016/S0167-646
1987(99)00107-5 647
Bilal M, Jaffrezic A, Dudal Y, Le Guillou C, Menasseri S, Walter C. 2010. Discrimination of Farm Waste 648
Contamination by Fluorescence Spectroscopy Coupled with Multivariate Analysis during a 649
Biodegradation Study. J Agric Food Chem 58:3093–100. https://doi.org/10.1021/jf903872r 650
Buysse P, Flechard CR, Hamon Y, Viaud V. 2016. Impacts of water regime and land-use on soil CO2 651
efflux in a small temperate agricultural catchment. Biogeochemistry 130:267–88. 652
https://doi.org/10.1007/s10533-016-0256-y 653
Chantigny MH. 2003. Dissolved and water-extractable organic matter in soils: A review on the 654
influence of land use and management practices. Geoderma 113:357–80. 655
https://doi.org/10.1016/S0016-7061(02)00370-1 656
Chassé AW, Ohno T, Higgins SR, Amirbahman A, Yildirim N, Parr TB. 2015. Chemical Force 657
Spectroscopy Evidence Supporting the Layer-by-Layer Model of Organic Matter Binding to Iron 658
(oxy)Hydroxide Mineral Surfaces. Environ Sci Technol 49:9733–41.
659
https://doi.org/10.1021/acs.est.5b01877 660
Coble PG. 2007. Marine optical biogeochemistry: The chemistry of ocean color. Chem Rev 107:402– 661
18. 662
Cory RM, McKnight DM. 2005. Fluorescence spectroscopy reveals ubiquitous presence of oxidized 663
and reduced quinones in dissolved organic matter. Environ Sci {&} Technol 39:8142–9. 664
https://doi.org/10.1021/es0506962 665
Cory RM, Miller MP, McKnight DM, Guerard JJ, Miller PL. 2010. Effect of instrument-specific response 666
on the analysis of fulvic acid fluorescence spectra. Limnol Oceanogr Methods 8:67–78. 667
https://doi.org/10.4319/lom.2010.8.67 668
Dalzell BJ, King JY, Mulla DJ, Finlay JC, Sands GR. 2011. Influence of subsurface drainage on quantity 669
and quality of dissolved organic matter export from agricultural landscapes. J Geophys Res 670
Biogeosciences 116:1–13. https://doi.org/10.1029/2010JG001540 671
European Environment Agency. 2017. Heavy precipitation assessment. Eur Environ Agency. 672
7fc060b1a7be41adba441f0e844ebeb3 673
Fasching C, Wilson HF, D’Amario SC, Xenopoulos MA. 2019. Natural Land Cover in Agricultural 674
Catchments Alters Flood Effects on DOM Composition and Decreases Nutrient Levels in 675
Streams. Ecosystems:1–16. http://link.springer.com/10.1007/s10021-019-00354-0 676
Fellman JB, Miller MP, Cory RM, D’Amore D V., White D. 2009. Characterizing dissolved organic 677
matter using PARAFAC modeling of fluorescence spectroscopy: A comparison of two models. 678
Environ Sci Technol 43:6228–34. https://doi.org/10.1021/es900143g 679
Foley JA, DeFries R, Asner GP, Barford C, Bonan G, Carpenter SR, Chapin FS, Coe MT, Daily GC, Gibbs 680
HK, Helkowski JH, Holloway T, Howard EA, Kucharik CJ, Monfreda C, Patz JA, Prentice IC, 681
Ramankutty N, Snyder PK. 2005. Global consequences of land use. Science (80- ) 309:570–4. 682
https://doi.org/10.1126/science.1111772 683
Fuß T, Behounek B, Ulseth AJ, Singer GA. 2017. Land use controls stream ecosystem metabolism by 684
shifting dissolved organic matter and nutrient regimes. Freshw Biol. 685
http://doi.wiley.com/10.1111/fwb.12887. Last accessed 16/01/2017 686