HAL Id: hal-00295379
https://hal.archives-ouvertes.fr/hal-00295379
Submitted on 22 Dec 2003
HAL is a multi-disciplinary open access
archive for the deposit and dissemination of
sci-entific research documents, whether they are
pub-lished or not. The documents may come from
teaching and research institutions in France or
abroad, or from public or private research centers.
L’archive ouverte pluridisciplinaire HAL, est
destinée au dépôt et à la diffusion de documents
scientifiques de niveau recherche, publiés ou non,
émanant des établissements d’enseignement et de
recherche français ou étrangers, des laboratoires
publics ou privés.
alkanes and cycloalkanes
R. Atkinson
To cite this version:
R. Atkinson. Kinetics of the gas-phase reactions of OH radicals with alkanes and cycloalkanes.
At-mospheric Chemistry and Physics, European Geosciences Union, 2003, 3 (6), pp.2233-2307.
�hal-00295379�
and Physics
Kinetics of the gas-phase reactions of OH radicals with alkanes and
cycloalkanes
R. Atkinson
Air Pollution Research Center, and Department of Environmental Sciences, and Department of Chemistry, University of California, Riverside, CA 92521, USA
Received: 27 February 2003 – Published in Atmos. Chem. Phys. Discuss.: 29 July 2003 Revised: 17 November 2003 – Accepted: 18 November 2003 – Published: 22 December 2003
Abstract. The available database concerning rate con-stants for gas-phase reactions of the hydroxyl (OH) radical with alkanes through early 2003 is presented over the en-tire temperature range for which measurements have been made (∼180–2000 K). Measurements made using relative rate methods are re-evaluated using recent rate data for the reference compound (generally recommendations from this review). In general, whenever more than one study has been carried out over an overlapping temperature range, recom-mended rate constants or temperature-dependent rate expres-sions are presented. The recommended 298 K rate constants, temperature-dependent parameters, and temperature ranges over which these recommendations are applicable are listed in Table 1.
1 Introduction
Large quantities of volatile organic compounds (VOCs) are emitted into the atmosphere from anthropogenic and bio-genic sources, and a large number of VOCs are present in ambient air (including those formed in situ from the atmo-spheric reactions of other VOCs). In the troposphere, VOCs can be transformed by photolysis (at wavelengths ≥290 nm), reaction with hydroxyl (OH) radicals (mainly during daylight hours), reaction with nitrate (NO3) radicals (during evening and nighttime hours), and reaction with ozone (O3) (Atkin-son, 2000).
Alkanes are an important class of VOCs (Calvert et al., 2002) which in the atmosphere react with OH radicals and, to a lesser extent, with NO3 radicals (Atkinson, 2000). Rate constants for the gas-phase reactions of OH radicals with alkanes have been periodically reviewed and evaluated (Atkinson, 1986, 1989, 1994, 1997), and the reactions of OH
Correspondence to: R. Atkinson
(ratkins@mail.ucr.edu)
radicals with ≤C4alkanes are included in the ongoing NASA (2003) and IUPAC (2003) data evaluations (which are now only available on the World Wide Web, at the locations given in NASA (2003) and IUPAC, 2003). This review and evalua-tion continues the previous reviews and evaluaevalua-tions of Atkin-son (1986, 1989, 1994, 1997), and employs the same general format.
For each alkane and cycloalkane for which experimental kinetic data are available in the readily accessible literature, these rate constants are listed. In the table associated with each reaction, the experimental techniques used are denoted by the abbreviations listed in Table 2. For example, use of a flash photolysis system to generate OH radicals with reso-nance fluorescence monitoring of OH radicals is denoted by PF-RF. When relative rate methods (denoted in the “Tech-nique” column by “RR”) were used, the rate constant for the reference compound from the most recent review and eval-uation is used to re-evaluate the rate constant for the alkane in question (which therefore may be different from that cited in the original publication). For relative rate studies, the rate constant used for the reference reaction to place the measured rate constant ratio(s) on an absolute basis is noted, and is that recommended from this evaluation (including the rate con-stants derived in this review and evaluation for the reactions of OH radicals with H2and CO), unless noted otherwise.
For absolute rate studies, the temperature-dependent rate expressions are also given (if cited), either as the Arrhe-nius expression k=Ae−B/T (in which case no entry is given
in the column labeled n) or as the three-parameter expres-sion k=ATne−B/T. When rate constants have been mea-sured over a range of temperatures, Arrhenius plots of ln k vs 1/T often exhibit curvature (Atkinson, 1986, 1989, 1994, 1997), and hence the recommended temperature-dependent expressions are then given in terms of the three-parameter expression k=CTne−D/T rather than the Arrhenius expres-sion k=Ae−B/T. Generally a value of n=2 is used (Atkin-son, 1986, 1989, 1994, 1997), resulting in the expression
Table 1. Recommended 298 K rate constants, temperature-dependent parameters (k=ATne−B/T), and temperature ranges over which the recommendations are applicable.
1012×k(298 K) A Temperature alkane (cm3molecule−1s−1) (cm3molecule−1s−1) n B(K) Range (K) methane 0.00640 1.85×10⁻²⁰ 2.82 987 190–1240 methane-d1 0.00528 5.19×10⁻¹⁸ 2 1332 240–430 methane-d2 0.00340 2.18×10⁻¹² 1926 270–360 methane-d3 0.00195 1.46×10⁻¹² 1972 270–360 methane-d4 0.000916 5.70×10⁻¹⁸ 2 1882 240–800 ethane 0.248 1.49×10⁻¹⁷ 2 499 180–1230 propane 1.09 1.65×10⁻¹⁷ 2 87 190–1220 n-butane 2.36 1.81×10⁻¹⁷ 2 -114 230–760 2-methylpropane 2.12 1.17×10⁻¹⁷ 2 -213 210–1150 n-pentane 3.80 2.52×10⁻¹⁷ 2 -158 220–760 2-methylbutane 3.6 2,2-dimethylpropane 0.825 1.86×10⁻¹⁷ 2 207 280–910 n-hexane 5.20 2.54×10⁻¹⁴ 1 112 290–970 2-methylpentane 5.2 3-methylpentane 5.2 2,2-dimethylbutane 2.23 3.37×10⁻¹¹ 809 240–330 2,3-dimethylbutane 5.78 1.66×10⁻¹⁷ 2 -407 240–1220 n-heptane 6.76 1.95×10⁻¹⁷ 2 -406 290–1090a 2,4-dimethylpentaneb 4.8 2,2,3-trimethylbutane 3.81 9.20×10⁻¹⁸ 2 -459 240–760 n-octane 8.11 2.72×10⁻¹⁷ 2 -361 290–1080 2,2,4-trimethylpentane 3.34 2.35×10⁻¹⁷ 2 -140 290–1190 2,3,4-trimethylpentaneb 6.6 243-313c 2,2,3,3-tetramethylbutane 0.972 1.99×10⁻¹⁷ 2 178 290–1180 n-nonane 9.70 2.53×10⁻¹⁷ 2 -436 290–1100a 3,3-diethylpentane 4.8 n-decane 11.0 3.17×10⁻¹⁷ 2 -406 290–1110a 3,4-diethylhexaneb 6.9 n-undecane 12.3 n-dodecane 13.2 n-tridecane 15.1 n-tetradecaneb 17.9 (312 K) n-pentadecaneb 20.7 (312 K) n-hexadecaneb 23.2 (312 K) cyclopropane 0.0815d 4.21×10⁻¹⁸ 2 454 200–460 isopropylcyclopropaneb 2.6 cyclobutane 2.03 2.10×10⁻¹⁷ 2 -25 270–370 cyclopentane 4.97 2.73×10⁻¹⁷ 2 -214 270–1200 cyclohexane 6.97 3.26×10⁻¹⁷ 2 -262 290–500 methylcyclohexaneb 9.6
1012×k(298 K) A Temperature alkane (cm3molecule−1s−1) (cm3molecule−1s−1) n B(K) Range (K) n-butylcyclohexaneb 14.7 cycloheptane 12.4 3.99×10⁻¹⁷ 2 -373 290–390 cyclooctaneb 13.3 5.91×10⁻¹⁷ 2 -276 290–390 bicyclo[2.2.1]heptaneb 5.1 bicyclo[2.2.2]octaneb 13.7 bicyclo[3.3.0]octaneb 10.3 cis-bicyclo[4.3.0]nonaneb 16.0 t rans-bicyclo[4.3.0]nonaneb 16.5 cis-bicyclo[4.4.0]decaneb 18.6 t rans-bicyclo[4.4.0]decaneb 19.0 tricyclo[5.2.1.02,6]decaneb 10.6 tricyclo[3.3.1.13,7]decaneb 21.5 t rans-pinaneb 12.4 tricycleneb 2.7 quadricyclaneb 1.7
aData are only available at room temperature and at ∼1100 K, with no rate constants having been measured between room temperature and
∼1100 K.
bRate constant from single study; no recommendation made.
cRate constants have been measured over this temperature range from a single study (see footnote b).
dBecause of significantly different temperature dependencies in the studies conducted, the recommended rate expression leads to a 298 K
rate constant ∼10% higher than room temperature measurements.
k=CT2e−D/T. The use of a value of n=2 for the ≥C2 alkanes is consistent with the literature values from experi-mental studies, which range from 1.05–3.09 with an average of n=2.0. At any given temperature T , an Arrhenius ex-pression can be derived from the three-parameter exex-pression k=CTne−D/T, with A=CenTn and B=D+nT . While an Arrhenius expression may be adequate over short tempera-ture ranges, extrapolation outside of the temperatempera-ture range for which the Arrhenius expression is valid is likely to result in significant errors in the predicted rate constant.
The available rate data, from both absolute and relative rate measurements, for the reactions of OH radicals with alkanes and cycloalkanes are reviewed and evaluated in the following sections. For the reactions of OH radicals with methane, ethane and propane (and for CH3D and CD4), the recommendations are based solely on absolute rate measure-ments. However, for the >C3alkanes and for the cycloalka-nes, rate constants obtained from relative rate studies are an important part of the data-base (and in some cases are the only data available), and the recommendations then use a combination of absolute and relative rate data. As shown in Table 3, for a series of C3–C10 n-alkanes and cyclohex-ane at room temperature the relative rate studies of Atkin-son et al. (1982a, b), Benhke et al. (1987, 1988), Nolting et al. (1988) and DeMore and Bayes (1999) are in generally excellent agreement, and these relative rate studies severely
Table 2. List of abbreviations used in tables of rate data, under
“Technique” column.
Abbreviation Experimental Technique FP Flash photolysis DF Discharge flow PLP Pulsed laser photolysis RR Relative rate
PR Pulse radiolysis LH Laser heating
SH Shock heating (shock tube) RA Resonance absorption RF Resonance fluorescence KS Kinetic spectroscopy
MMS Molecular modulation-spectroscopy LIF Laser induced fluorescence MS Mass spectrometry
EPR Electron paramagnetic resonance LMR Laser magnetic resonance
constrain room temperature rate constant recommendations for the ≥C5n-alkanes once rate constants for propane and n-butane are recommended from absolute (or mainly absolute) studies.
Table 3. Relative rate constants for a series of alkanes at room temperature.
alkane Atkinson et al. Behnke et al. Nolting et al. Behnke et al. DeMore and (1982a, b) (1987) (1988) (1988) Bayes (1999) (299±2 K) (300±3 K) (312 K) (300 K) (298 K) propane 0.473±0.016 0.539 0.467 n-butane 1.00 1.00 1.00 1.00 n-pentane 1.60±0.04 1.62 (1.60)a 1.63±0.04 1.57 n-hexane 2.21±0.04 2.19 2.31±0.24 2.24±0.04 2.19 n-heptane 2.83±0.07 2.78 2.80±0.11 2.88±0.06 n-octane 3.49±0.07 3.37 3.28±0.17 3.46±0.06 n-nonane 4.13±0.13 4.07 3.80±0.19 4.06±0.11 n-decane 4.42±0.22 4.36±0.23 4.88±0.11 cyclohexane 2.91±0.10 2.86 2.93±0.02
a Based on the data cited in the table from the studies of Atkinson et al. (1982b), Behnke et al. (1987, 1988) and DeMore and Bayes (1999).
1000/T (K) 0 1 2 3 4 5 6 log k (cm 3 m olecule -1 s -1 ) -16 -15 -14 -13 -12 -11
Bott and Cohen (1989)
Vaghjiani and Ravishankara (1991) Finlayson-Pitts et al. (1992) Lancar et al. (1992) Dunlop and Tully (1993) Mellouki et al. (1994) Gierczak et al. (1997) Bonard et al. (2002) Recommendation
Methane
Fig. 1. Arrhenius plot of selected rate data for the reaction of OH
radicals with methane.
There are a number of alkanes for which the OH radical reaction rate constants have been measured relative to those for the reactions of OH radicals with H2or CO, often at ele-vated temperatures.
OH+H2→H2O+H
OH+CO → H+CO2
The available rate constants for these two reactions have been reviewed and evaluated to obtain temperature, and in the case of the CO reaction, pressure dependent rate expressions in or-der to place the measured rate constant ratios on an absolute basis. For the reaction of OH radicals with H2, the absolute rate constants measured by Tully and Ravishankara (1980), Ravishankara et al. (1981), Bott and Cohen (1989), Olden-borg et al. (1992) and Talukdar et al. (1996) have been fitted to the three-parameter expression k=AT2e−B/T to obtain k(H2)=9.61×10⁻¹⁸T2e−1457/Tcm3molecule−1s−1 over the temperature range 238–1548 K.
The rate constant for the reaction of OH radicals with CO is temperature and pressure dependent (and with the pressure dependence depending on the specific diluent gas used), with the effect of pressure decreasing as the temperature increases. The kinetics of this reaction have been investigated and eval-uated by Golden et al. (1998), with the recommended rate constant being derived from the experimental data using an RRKM model. In this review and evaluation, a simpler (and somewhat more approximate) rate expression analogous to that used previously (Atkinson, 1989) has been derived from the recommended experimental rate constants tabulated by Golden et al. (1998), of
k(CO)=9.1×10⁻¹⁹T1.77e580/T×
[1+2.4×10⁻²⁰[M](T /298)−1]cm3molecule−1s−1
over the temperature range ∼290–3000 K and for the pres-sures encountered in this review article, where [M] is the concentration of M=air, O2 or N2 in molecule cm−3. Be-cause of the greater uncertainties in the rate constant for this reaction (as a function of temperature, pressure and diluent gas), rate constants obtained from experimental studies using the reaction of OH radicals with CO as the reference reaction are given relatively low weight in the evaluations, or are not used if other rate data are available.
rate constants are subjective and are in the range ±20–30%. However, it is considered unlikely that future new rate data will change many of the room temperature rate constants by more than 10%; this is approximately the change that has oc-curred in recommended rate constants for alkanes since the Atkinson (1986) review, with recommended rate constants for most alkanes decreasing by ∼10% since 1986.
2 Rate data for alkanes and cycloalkanes
2.1 OH+methane
The available rate data are listed in Table 4. The re-cent studies of Bott and Cohen (1989), Vaghjiani and Ravishankara (1991), Finlayson-Pitts et al. (1992), Lan-car et al. (1992), Dunlop and Tully (1993), Mellouki et al. (1994), Gierczak et al. (1997) and Bonard et al. (2002) are in good agreement, as shown by the Ar-rhenius plot in Fig. 1. However, over the temperature range ∼250–420 K the rate constants measured in these studies are significantly lower than most of the earlier absolute measurements (Atkinson, 1994). Gierczak et al. (1997) fit their data and the earlier data of Vaghjiani and Ravishankara (1991) from the same laboratory to a three-parameter expression, and obtained the rate expression k(methane)=1.85×10⁻²⁰T2.82e−987/T cm3molecule−1s−1. This rate expression is plotted as the solid line in the Arrhe-nius plot (Fig. 1), and provides an excellent fit to the data of Bott and Cohen (1989), Vaghjiani and Ravishankara (1991), Finlayson-Pitts et al. (1992), Lancar et al. (1992), Dunlop and Tully (1993), Mellouki et al. (1994), Gierczak et al. (1997) and Bonard et al. (2002), agreeing with the 1234 K rate constant of Bott and Cohen (1989) to within 1% and with the 800 K rate constant of Dunlop and Tully (1993) and the 295–668 K rate constants of Bonard et al. (2002) to within 10%. Accordingly, the rate expression of Gierczak et al. (1997) is recommended, with
k(methane)=1.85×10⁻²⁰T2.82e−987/T cm3molecule−1s−1 over the temperature range 190–1240 K, and with
k(methane)=6.40×10⁻¹⁵cm3molecule−1s−1at 298 K. The overall uncertainty in the rate constant at 298 K is esti-mated to be ±20%.
2.2 OH+methane-d1
The available rate data are listed in Table 5, and Fig. 2 shows an Arrhenius plot of the rate constants of Gordon and Mulac (1975), DeMore (1993a), Gierczak et al. (1997) and Saueressig et al. (2001). The relative rate constants of De-More (1993a) are slightly higher than those of Gierczak et al. (1997), by up to ∼20% at 360 K. The rate constants of
1000/T (K) 2.0 2.5 3.0 3.5 4.0 4.5 log k (cm 3 molecule -1 s -1) -15 -14 -13 Gierczak et al. (1997) Saueressig et al. (2001) Recommendation Methane-d1 (CH3D)
Fig. 2. Arrhenius plot of the rate data for the reaction of OH radicals
with methane-d1(CH3D).
DeMore (1993a), Gierczak et al. (1997) and Saueressig et al. (2001) have been fitted to the three parameter expression k=AT2e−B/T, leading to the recommendation of
k(methane−d1)=
5.19 × 10⁻¹⁸T2e−(1332±54)/T cm3molecule−1s−1
over the temperature range 240–430 K, where the indicated error in B is two least-squares standard deviations, and with k(methane−d1)=5.28×10⁻¹⁵cm3molecule−1s−1 at 298 K. The overall uncertainty in the rate constant at 298 K is es-timated to be ±20%. The recommended rate expression is shown as the solid line in Fig. 2.
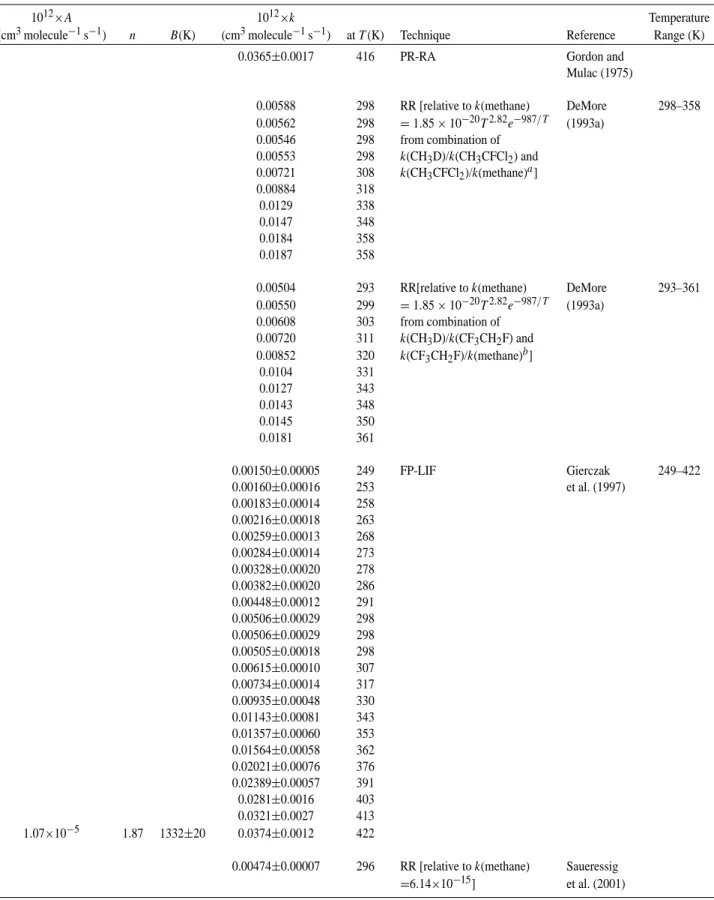
2.3 OH+methane-d2
As shown in Table 6, rate constants are available only from the studies of Gordon and Mulac (1975) and Gierczak et al. (1997), with only one temperature-dependent study (Gier-czak et al., 1997). The rate constant of Gordon and Mu-lac (1975) at 416 K is ∼40% higher than predicted from extrapolation of the Arrhenius expression of Gierczak et al. (1997). In the absence of further studies, the Arrhenius expression of Gierczak et al. (1997) should be used (but only over the temperature range 270–360 K).
2.4 OH+methane-d3
As shown in Table 7, rate constants are available only from the studies of Gordon and Mulac (1975) and Gierczak et
Table 4. Rate constants and temperature-dependent parameters for the reaction of OH radicals with methane.
1012×A 1012×k Temperature
(cm3molecule−1s−1) n B(K) (cm3molecule−1s−1) at T (K) Technique Reference Range (K) 21±10.5 1650–1840 RR [relative to k(CO) Westenberg and 1650–1840
=9.1×10⁻¹⁹T1.77e580/T] Fristrom (1961)
12.5 1445 RR[relative to k(CO) Fenimore and 1220–1800 12.8 1560 =9.1×10⁻¹⁹T1.77e580/T] Jones (1961)
11.1 1580 12.9 1690 16.8 1800
0.181 673 RR[relative to k(CO) Hoare (1962) 673–923 0.256 723 =9.1×10⁻¹⁹T1.77e580/T]
0.54 798 0.77 873 1.03 923
26 ∼1370–1680 RR[relative to k(CO) Fristrom (1963) ∼1370–1680 =9.1×10⁻¹⁹T1.77e580/T]
0.45±0.23 773 RR [relative to Blundell et al. (1965) 773–823 k(CO)=2.49×10⁻¹³]
0.185 673 RR[relative to k(CO) Hoare (1966) 673–923 0.291 723 =9.1×10⁻¹⁹T1.77e580/T]
0.54 798 0.80 873 1.09 923
0.59 798 RR[relative to Hoare and k(CO)=2.58×10⁻¹³] Peacock (1966) 0.87±0.18 773 RR [relative to k(H2) Baldwin
=8.72×10⁻¹³] et al. (1967) 5.0±1.7 1285 Flame-RA/MS Dixon-Lewis
and Williams (1967) 0.0108±0.0025 300 DF-EPR Wilson and
Westenberg (1967) 0.00880±0.00034 301±1 FP-KS Greiner (1967a)
83 2516 0.0179a 298 FP-KS Horne 298–423 and Norrish (1967)
18±4 1750–2000 RR [relative to k(CO) Wilson 1750–2000 =9.1×10⁻¹⁹T1.77e580/T] et al. (1969)
Table 4. Continued.
1012×A 1012×k Temperature
(cm3molecule−1s−1) n B(K) (cm3molecule−1s−1) at T (K) Technique Reference Range (K) 0.96±0.09 773 RR [relative to k(H2) Baldwin =8.72×10⁻¹³] et al. (1970a) 0.00849±0.00072 295 FP-KS Greiner (1970) 295–498 0.00953±0.00029 295 0.0106±0.0003 296 0.0103±0.0006 296 0.00804±0.00020 301 0.00805±0.00042 301 0.00903±0.00088 302 0.0154±0.0006 333 0.0352±0.0007 370 0.0611±0.0024 424 0.121±0.004 492 0.120±0.004 493 0.121±0.003 493 0.113±0.003 497 5.5 1898±52 0.122±0.003 498 0.185+−0.1850.093 548 [relative to Simonaitis k(CO)=1.85×10⁻¹³] et al. (1971) 50 3020 6.7a 1500 Flame-MS Peeters 1100–1900 and Mahnen (1973) 0.00185±0.00010 240 FP-RF Davis 240–373 0.00185±0.00017 240 et al. (1974) 0.00495±0.00025 276 0.00749±0.00010 298 0.0075±0.00075 298 0.0069±0.0008 298 2.36 1711±88 0.0236 373 0.00715±0.00042 293 DF-RF Margitan 293–427 0.0212±0.0004 359 et al. (1974) 0.0306±0.0001 384 0.0422±0.0018 407 3.83 1842±21 0.0521±0.0016 427
0.0261±0.0027 381 PR-RA Gordon and 381–416 0.0548±0.0017 416 Mulac (1975)
0.00651±0.00027 295±2 FP-RA Overend et al. (1975) 0.0095±0.0014 296±2 DF-LMR Howard and
Table 4. Continued.
1012×A 1012×k Temperature
(cm3molecule−1s−1) n B(K) (cm3molecule−1s−1) at T (K) Technique Reference Range (K) 0.0088±0.0007 298 FP-RA Zellner and 298–892
0.0148 330 Steinert (1976) 0.020 358 0.028 381 0.061 444 0.070 453 0.113 498 0.174 525 0.257 564 0.251±0.033 576 0.276±0.033 584 0.335 622 0.551 629 0.822 671 0.830 680 1.12 738 1.21 756 1.51 776 5.76×10⁻⁹ 3.08 1010 2.71 892
0.00638±0.00074 296±2 RR [relative to k(H2) Cox et al.
=6.13×10⁻¹⁵] (1976) 9.0 1300 RR [relative to k(H2) Bradley
=5.30×10⁻¹²] et al. (1976)
3.82 1140 SH/FP-RA Ernst et al. 1140–1505
3.82 1160 (1978) 4.48 1165 3.49 1188 3.49 1192 4.82 1203 4.15 1220 3.82 1245 3.99 1260 4.15 1260 3.49 1265 4.48 1270 4.65 1270 3.82 1275 3.99 1275 3.99 1303 4.32 1313 5.65 1335 5.31 1404 5.15 1410 4.48 1415 5.65 1500 5.31 1505
1012×A 1012×k Temperature (cm3molecule−1s−1) n B(K) (cm3molecule−1s−1) at T (K) Technique Reference Range (K)
0.0070±0.0007 296 FP-RA (of CH3) with Sworski
computer modeling et al. (1980)
0.00750±0.00060 298 FR-RF Tully and 298–1020 0.0473±0.0045 398 Ravishankara (1980) 0.081±0.011 448 0.145±0.012 511 0.167±0.006 529 0.314±0.040 600 0.275±0.044 619 0.578±0.058 696 0.84±0.15 772 1.50±0.15 915 1.32×10⁻⁵ 1.92 1355 2.00±0.20 1020 0.00766±0.00064 300 FP-RF Husain et al. (1981) 1.25±0.45 830±50 LH-LIF Fairchild 830–1400 1.3±0.4 1030±50 et al. (1982) 4.3±1.0 1400±50 0.00557±0.00054 269 DF-RF Jeong and 269–473 0.00789±0.00049 297 Kaufman (1982); 0.0178±0.0012 339 Jeong 0.0347±0.0023 389 et al. (1984) 0.0549±0.0035 419 1.28 × 10⁻¹² 4.23 453±776 0.102±0.007 473 0.0379±0.0032 413 RR [relative to Baulch 413–693 0.0541±0.0064 417 k(CO)=9.1×10⁻¹⁹ et al. (1983) 0.0350±0.0032 422 T1.77e580/T] 0.0636±0.0066 443 0.0773±0.0068 471 0.0963±0.0070 505 0.103±0.018 517 0.0926±0.0178 521 0.112±0.006 546 0.166±0.004 553 0.275±0.016 603 0.366±0.022 663 0.627±0.065 693
al. (1997), with only one temperature-dependent study (Gier-czak et al., 1997). The rate constant of Gordon and Mu-lac (1975) at 416 K is in reasonable agreement with that predicted from extrapolation of the Arrhenius expression of Gierczak et al. (1997). In the absence of further studies, the Arrhenius expression of Gierczak et al. (1997) should be used (but only in the temperature range 270–360 K).
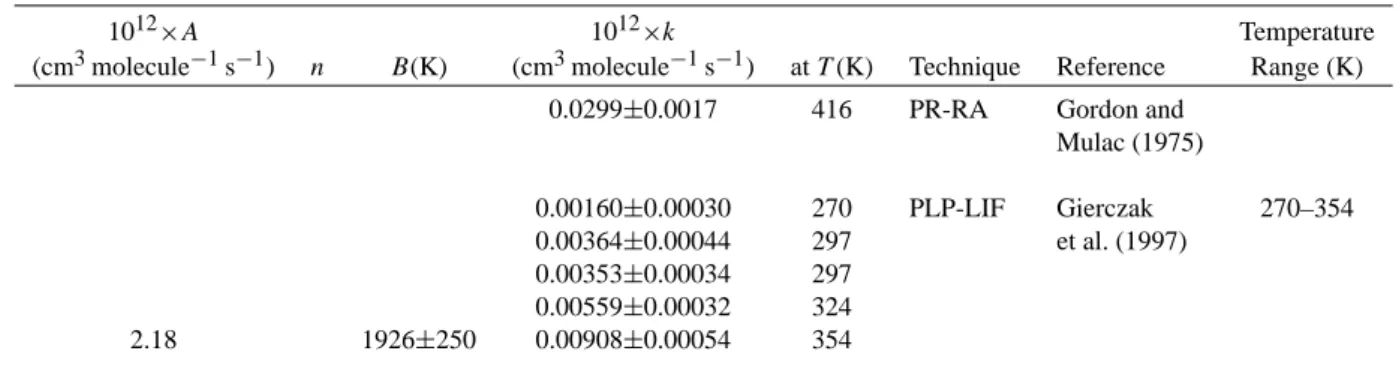
2.5 OH+methane-d4
The available rate data are listed in Table 8. Figure 3 shows an Arrhenius plot of the absolute rate constants measured by Gordon and Mulac (1975), Dunlop and Tully (1993) and Gierczak et al. (1997). The rate constant of Gordon and Mu-lac (1975) at 416 K is a factor of 2 lower than those of Dun-lop and Tully (1993) and Gierczak et al. (1997), which are in
Table 4. Continued.
1012×A 1012×k Temperature
(cm3molecule−1s−1) n B(K) (cm3molecule−1s−1) at T (K) Technique Reference Range (K) 0.00650 298 PR-RA Jonah 298–1229 0.00846 298 et al. (1984) 0.0189 348 0.0351 373 0.106 398 0.0938 415 0.175 424 0.124 450 0.209 483 0.174 483 0.336 543 0.584 571 0.545 613 0.760 667 0.893 709 0.991 712 1.04 769 1.52 858 2.48 873 2.27 974 2.01 974 4.50 1071 3.22 1125 4.19 1125 4.93 1229 0.0085±0.0006 298±3 FP-RF Madronich and 298–1512 0.0228±0.0043 362±10 Felder (1985) 0.0463±0.0034 407±5 0.0629±0.009 410±14 0.154±0.014 510±10 0.177±0.017 525±10 0.202±0.010 546±5 0.439±0.038 626±16 0.478±0.07 698±22 1.48±0.08 900±12 212±0.23 967±35 2.16±0.11 1005±15 2.72±0.15 1103±17 3.34±0.20 1164±17 2.41±0.22 1174±22 3.18±0.17 1176±17 3.89±0.25 1196±17 4.26±0.39 1196±37 3.77±0.32 1238±18 3.68±0.23 1244±17 3.58±0.27 1261±23 3.80±0.37 1261±18
Table 4. Continued.
1012×A 1012×k Temperature
(cm3molecule−1s−1) n B(K) (cm3molecule−1s−1) at T (K) Technique Reference Range (K) 4.74±0.20 1300±18 4.20±0.21 1307±18 4.84±0.50 1314±23 5.32±0.31 1345±18 5.61±0.34 1365±19 6.44±0.53 1396±19 5.98±0.69 1455±20 6.52±1.15 1510±20 2.57×10⁻⁵ 1.83 1396±134 6.74±0.35 1512±20
3 1220 SH-RA Bott and Cohen (1985) 1.25±0.6 830 LH-LIF Smith 830–1412 2.25±1.0 870 et al. (1985) 1.55±0.7 930 2.0±1.0 966 2.1±1.2 975 1.33±0.5 1030 3.6±0.9 1120 1.7±0.7 1150 2.35±0.7 1176 3.3±1.0 1200 2.9±0.35 1240 4.4±0.8 1400 4.2±0.8 1412
4.3±0.9 1234±15 SH-RA Bott and Cohen (1989)
0.00093±0.00003 223 PLP-LIF Vaghjiani and 223–420 0.00102±0.00002 223 Ravishankara (1991) 0.00104±0.00002 223 0.00097±0.00003 223 0.00086±0.00002 223 0.00089±0.00003 223 0.00086±0.00004 223 0.00089±0.00004 223 0.00088±0.00004 223 0.00103±0.00002 223 0.00086±0.00002 223 0.00125±0.00002 233 0.00133±0.00002 233 0.00125±0.00003 233 0.00118±0.00002 233 0.00118±0.00003 233 0.00119±0.00001 233 0.00121±0.00002 233 0.00182±0.00002 250 0.00204±0.00005 250
Table 4. Continued.
1012×A 1012×k Temperature
(cm3molecule−1s−1) n B(K) (cm3molecule−1s−1) at T (K) Technique Reference Range (K) 0.00198±0.00003 250 0.00350±0.00005 273 0.00352±0.00007 273 0.00338±0.00007 273 0.00371±0.00016 273 0.00375±0.00005 273 0.00367±0.00004 273 0.00364±0.00005 273 0.00592±0.00018 295 0.00647±0.00006 297 0.00636±0.00022 297 0.00630±0.00007 298 0.00620±0.00018 298 0.00684±0.00025 303 0.00713±0.00018 303 0.00674±0.00013 303 0.00674±0.00008 303 0.00715±0.00011 303 0.00712±0.00038 303 0.01026±0.00015 325 0.01598±0.00011 350 0.02617±0.00042 380 0.04287±0.00052 420 0.04253±0.00052 420 0.04244±0.00057 420 0.04336±0.00063 420 0.04366±0.00056 420 0.04184±0.00061 420 1.59×10⁻⁸ 2.84 978 0.04304±0.00047 420 2.94 1815±30 0.00409±0.00026 278 DF-RF Finlayson-Pitts 278–378 0.00560±0.00063 298 et al. (1992) 0.00575±0.00098 298 0.0106±0.0017 313 0.00792±0.00007 313 0.0105±0.0028 333 0.0109±0.0006 333 0.0150±0.0025 348 0.0143±0.0036 348 0.0205±0.0019 363 4.0 1944±114 0.0236±0.0008 378 0.0262±0.0027 378 DF-EPR Lancar 378–422 0.0427±0.0018 422 et al. (1992)
1012×A 1012×k Temperature (cm3molecule−1s−1) n B(K) (cm3molecule−1s−1) at T (K) Technique Reference Range (K)
<0.0003 178±2 PLP-LIF Sharkey and 178–298 0.00165±0.0002 216±2 Smith (1993)
0.0076±0.0003 298±2
0.00562±0.00043 293 PLP-LIF Dunlop and 293–800 0.0371±0.0022 409 Tully (1993) 0.0422±0.0023 420 0.101±0.004 498 0.152±0.010 547 0.237±0.014 602 0.367±0.022 654 0.474±0.026 704 0.576±0.032 745 9.45×10⁻⁸ b 2.58b 1082b 0.756±0.042 800 0.0054±0.0002 292 PLP-LIF Saunders et al. (1993) 0.00132±0.00005 233 PLP-LIF Mellouki 233–343 0.00208±0.00030 243 et al. (1994) 0.00215±0.00030 252 0.00370±0.00020 273 0.00642±0.00060 295 0.00634±0.00056 298 0.0105±0.0006 323 2.56 1765±146 0.0168±0.0015 343 0.00036±0.00002 195 FP-LIF Gierczak 195–296 0.00040±0.00002 200 et al. (1997) 0.00049±0.00003 206 0.00063±0.00006 213 0.00075±0.00007 218 0.00082±0.00042 223 0.00602±0.00010 295 0.00585±0.00022 295 0.00590±0.00016 295 0.00615±0.00026 295 1.85×10⁻⁸ c 2.82c 987c 0.00620±0.00016 296 0.00623±0.00020 295 PLP-LIF Bonard 295–668 0.00916±0.00028 319 et al. (2002) 0.0219±0.0007 367 0.0426±0.0018 419 0.0783±0.0021 464 0.133±0.004 519 0.205±0.009 569 0.306±0.010 619 5.65×10⁻⁹ 3.01 959±36 0.422±0.014 668
aCalculated from the cited Arrhenius expression.
bFit of combined data sets of Dunlop and Tully (1993) and Vaghjiani and Ravishankara (1991) over the temperature range 223–800 K. cFit of combined data sets of Gierczak et al. (1997) and Vaghjiani and Ravishankara (1991) over the temperature range 195–420 K.
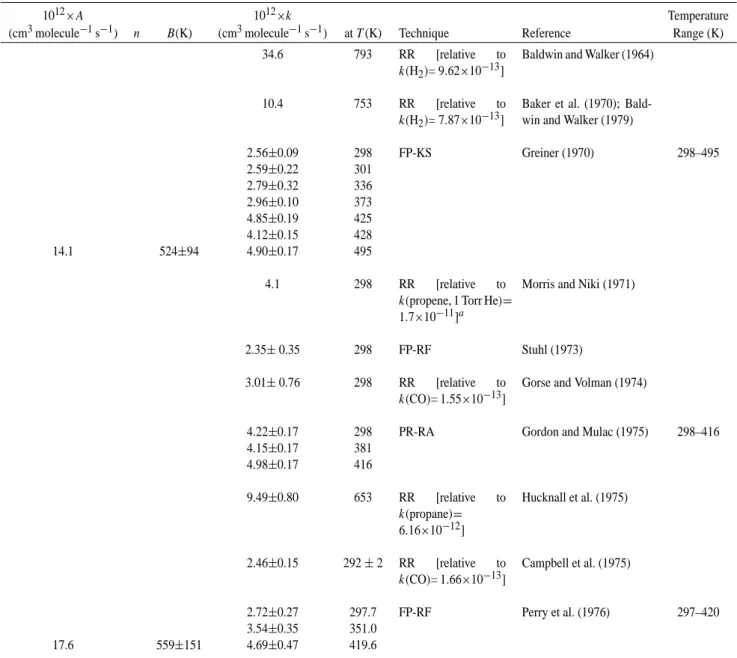
Table 5. Rate constants and temperature-dependent parameters for the reaction of OH radicals with methane-d1.
1012×A 1012×k Temperature
(cm3molecule−1s−1) n B(K) (cm3molecule−1s−1) at T (K) Technique Reference Range (K) 0.0365±0.0017 416 PR-RA Gordon and
Mulac (1975)
0.00588 298 RR [relative to k(methane) DeMore 298–358 0.00562 298 =1.85 × 10⁻²⁰T2.82e−987/T (1993a) 0.00546 298 from combination of 0.00553 298 k(CH3D)/k(CH3CFCl2) and 0.00721 308 k(CH3CFCl2)/k(methane)a] 0.00884 318 0.0129 338 0.0147 348 0.0184 358 0.0187 358
0.00504 293 RR[relative to k(methane) DeMore 293–361 0.00550 299 =1.85 × 10⁻²⁰T2.82e−987/T (1993a) 0.00608 303 from combination of 0.00720 311 k(CH3D)/k(CF3CH2F) and 0.00852 320 k(CF3CH2F)/k(methane)b] 0.0104 331 0.0127 343 0.0143 348 0.0145 350 0.0181 361 0.00150±0.00005 249 FP-LIF Gierczak 249–422 0.00160±0.00016 253 et al. (1997) 0.00183±0.00014 258 0.00216±0.00018 263 0.00259±0.00013 268 0.00284±0.00014 273 0.00328±0.00020 278 0.00382±0.00020 286 0.00448±0.00012 291 0.00506±0.00029 298 0.00506±0.00029 298 0.00505±0.00018 298 0.00615±0.00010 307 0.00734±0.00014 317 0.00935±0.00048 330 0.01143±0.00081 343 0.01357±0.00060 353 0.01564±0.00058 362 0.02021±0.00076 376 0.02389±0.00057 391 0.0281±0.0016 403 0.0321±0.0027 413 1.07×10⁻⁵ 1.87 1332±20 0.0374±0.0012 422
0.00474±0.00007 296 RR [relative to k(methane) Saueressig =6.14×10⁻¹⁵] et al. (2001)
aFrom Huder and DeMore (1993). bFrom DeMore (1993b).
1012×A 1012×k Temperature (cm3molecule−1s−1) n B(K) (cm3molecule−1s−1) at T (K) Technique Reference Range (K)
0.0299±0.0017 416 PR-RA Gordon and Mulac (1975) 0.00160±0.00030 270 PLP-LIF Gierczak 270–354 0.00364±0.00044 297 et al. (1997) 0.00353±0.00034 297 0.00559±0.00032 324 2.18 1926±250 0.00908±0.00054 354
Table 7. Rate constants and temperature-dependent parameters for the reaction of OH radicals with methane-d3.
1012×A 1012×k Temperature
(cm3molecule−1s−1) n B(K) (cm3molecule−1s−1) at T (K) Technique Reference Range (K) 0.0111±0.0005 416 PR-RA Gordon and
and Mulac (1975) 0.00102±0.00004 270 FP/PLP-LIF Gierczak 270–354 0.00171±0.00020 293 et al. (1997) 0.00177±0.00010 295 0.00197±0.00004 297 0.00328±0.00034 323 1.46 1972±80 0.00564±0.00020 354 1000/T (K) 1.0 1.5 2.0 2.5 3.0 3.5 4.0 4.5 log k (cm 3 m olecule -1 s -1 ) -16 -15 -14 -13 -12
Gordon and Mulac (1975) Dunlop and Tully (1993) Gierczak et al. (1997) Recommendation
Methane-d4 (CD4)
Fig. 3. Arrhenius plot of the rate data for the reaction of OH radicals
with methane-d4(CD4).
excellent agreement over the temperature range common to both studies (293–413 K). The rate constants of Dunlop and Tully (1993) and Gierczak et al. (1997) have been fitted to the three parameter expression k=AT2e−B/T, leading to the recommendation of
k(methane−d4)=
5.70 × 10⁻¹⁸T2e−(1882±32)/T cm3molecule−1s−1
over the temperature range 240–800 K, where the indicated error in B is two least-squares standard deviations, and with k(methane−d4)=
9.16 × 10⁻¹⁶cm3molecule−1s−1at 298 K.
The overall uncertainty in the rate constant at 298 K is estimated to be ±20%. As seen from the Arrhenius plot in Fig. 3, the recommendation underpredicts the rate constants at the two lowest temperatures (244 and 250 K) employed by Gierczak et al. (1997) by 20–25%. Use of a T3dependence in the three-parameter expression makes little differ-ence, with k(methane−d4) =4.91×10⁻²¹T3e−(1478±24)/T cm3molecule−1s−1, k(methane-d4) =9.11×10⁻¹⁶cm3 molecule−1s−1at 298 K, and the predicted rate constant at 244 K is 14% lower than the measured value of Gierczak et al. (1997).
Table 8. Rate constants and temperature-dependent parameters for the reaction of OH radicals with methane-d4.
1012×A 1012×k Temperature
(cm3molecule−1s−1) n B(K) (cm3molecule−1s−1) at T (K) Technique Reference Range (K) 0.0050±0.0002 416 PR-RA Gordon and
and Mulac (1975)
0.00083±0.00008 293 PLP-LIF Dunlop and 293–800 0.00215±0.00018 333 Tully (1993) 0.00422±0.00032 365 0.00910±0.00058 409 0.0191±0.0011 459 0.0306±0.0022 498 0.0530±0.0032 547 0.0900±0.0056 602 0.150±0.010 654 0.197±0.012 704 0.302±0.018 753 8.70×10⁻¹⁰ 3.23 1334 0.385±0.024 800 0.00019±0.00002 244 FP-LIF Gierczak 244–413 0.00023±0.00003 250 et al. (1997) 0.00027±0.00002 259 0.00033±0.00002 265 0.00039±0.00002 269 0.00044±0.00002 276 0.00056±0.00006 282 0.00066±0.00004 289 0.00085±0.00002 296 0.00084±0.00004 296 0.00086±0.00005 299 0.00087±0.00002 300 0.00132±0.00005 310 0.00156±0.00018 320 0.00223±0.00005 333 0.00295±0.00008 346 0.00367±0.00012 357 0.00577±0.00022 380 0.00697±0.00018 391 0.0101±0.0001 413 0.00985±0.00040 413 5.65×10⁻⁹ 3.01 1545±15 0.00979±0.00040 413
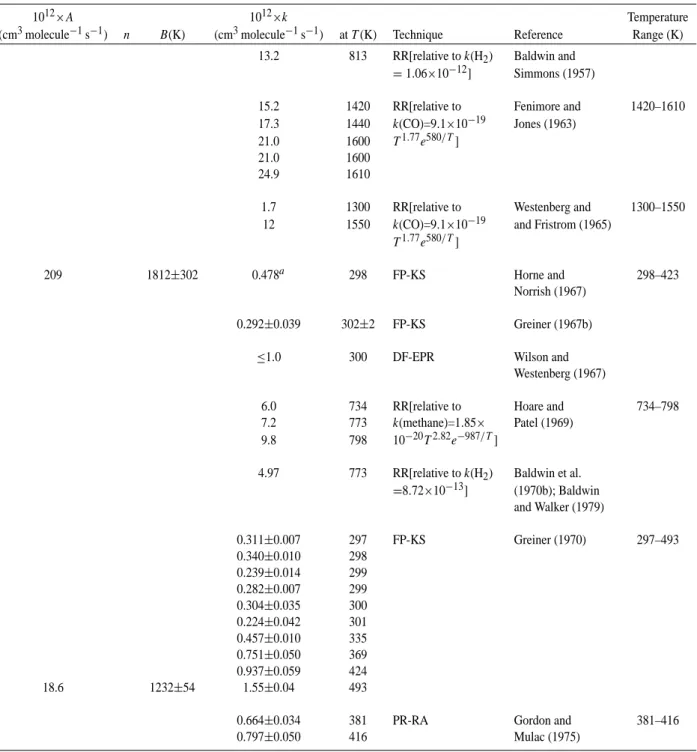
Table 9. Rate constants and temperature-dependent parameters for the reaction of OH radicals with ethane.
1012×A 1012×k Temperature
(cm3molecule−1s−1) n B(K) (cm3molecule−1s−1) at T (K) Technique Reference Range (K) 13.2 813 RR[relative to k(H2) Baldwin and
=1.06×10⁻¹²] Simmons (1957)
15.2 1420 RR[relative to Fenimore and 1420–1610 17.3 1440 k(CO)=9.1×10⁻¹⁹ Jones (1963)
21.0 1600 T1.77e580/T]
21.0 1600 24.9 1610
1.7 1300 RR[relative to Westenberg and 1300–1550 12 1550 k(CO)=9.1×10⁻¹⁹ and Fristrom (1965)
T1.77e580/T]
209 1812±302 0.478a 298 FP-KS Horne and 298–423 Norrish (1967)
0.292±0.039 302±2 FP-KS Greiner (1967b) ≤1.0 300 DF-EPR Wilson and
Westenberg (1967)
6.0 734 RR[relative to Hoare and 734–798 7.2 773 k(methane)=1.85× Patel (1969)
9.8 798 10−20T2.82e−987/T]
4.97 773 RR[relative to k(H2) Baldwin et al.
=8.72×10⁻¹³] (1970b); Baldwin and Walker (1979) 0.311±0.007 297 FP-KS Greiner (1970) 297–493 0.340±0.010 298 0.239±0.014 299 0.282±0.007 299 0.304±0.035 300 0.224±0.042 301 0.457±0.010 335 0.751±0.050 369 0.937±0.059 424 18.6 1232±54 1.55±0.04 493
0.664±0.034 381 PR-RA Gordon and 381–416 0.797±0.050 416 Mulac (1975)
Table 9. Continued.
1012×A 1012×k Temperature
(cm3molecule−1s−1) n B(K) (cm3molecule−1s−1) at T (K) Technique Reference Range (K) 3.40±0.39 653 RR[relative to Hucknall
k(methane)=3.54× et al. (1975) 10−13]
0.264±0.017 295±2 FP-RA Overend et al. (1975) 0.290±0.060 296 DF-LMR Howard and
Evenson (1976b) 25.9 1300 RR[relative to k(H2) Bradley et al. (1976)
=5.30×10⁻¹²] 0.26±0.04 298 DF-RF Leu (1979) 0.231±0.040 295±1 DF-RF Lee and Tang (1982) 0.080 238 FP-RF Margitan and Watson (1982)
0.659±0.048 403 RR[relative to Baulch et al. (1983) 403–683 1.17±0.12 443 k(CO)=9.1×10⁻¹⁹ 1.27±0.09 493 T1.77e580/T] 2.52±0.19 561 2.29±0.26 595 4.73±0.56 683 0.259±0.021 297 FP-RF Tully et al. (1983) 297–800 0.771±0.076 400 1.58±0.10 499 2.61±0.33 609 3.65±0.25 697 1.43 × 10⁻² 1.05 911 5.07±0.34 800 0.196±0.013 248 DF-RF Jeong et al. (1984) 248–472 0.228±0.014 273 0.310±0.020 294 0.306±0.021 298 0.426±0.027 333 0.403±0.027 333 0.538±0.035 375 0.529±0.034 375 0.799±0.054 428 0.770±0.048 429 0.993±0.068 464 3.87×10⁻⁹ 3.09 −171±343 1.03±0.067 472 6.11 886±36
Table 9. Continued.
1012×A 1012×k Temperature
(cm3molecule−1s−1) n B(K) (cm3molecule−1s−1) at T (K) Technique Reference Range (K) 16.1 1173 0.324 300 PR-RA Nielsen et al. (1984) 300–400
0.105±0.004 240 FP-RF Smith et al. (1984) 240–295 0.147±0.006 251
0.205±0.009 273 18.0 1240±110 0.263±0.010 295
0.275 295 DF-RF Devolder et al. (1984) 0.22±0.03 295 PLP-LIF Schmidt et al. (1985) 0.267±0.040 295±2 DF-RF Baulch et al. (1985)
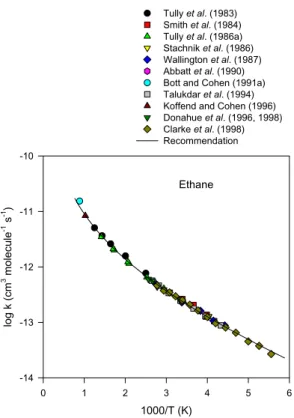
0.239±0.010 292.5 PLP-LIF Tully et al. (1986a) 292–705 0.407±0.017 340 0.651±0.027 396 1.15±0.048 478 1.23± 0.051 484 2.01±0.083 577 2.11±0.088 586 8.51 × 10⁻⁶ 2.06 430 3.48±0.144 705
0.298±0.021 295 PR-RA Nielsen et al. (1986)
0.127±0.008 248 PLP-RA Stachnik et al. (1986) 248–297 0.129±0.009 248
0.251±0.006 297 0.250±0.006 297
0.31±0.06 295.9±1.2 RR relative to Edney et al. (1986) k(propane)=1.08× 10⁻¹² 0.277±0.03 296±2 DF-RF Bourmada et al. (1987) 0.088±0.013 226 FP-RF Wallington 226–363 0.107±0.010 241 et al. (1987) 0.162±0.018 261 0.230±0.026 296 8.4 1050±100 0.497±0.055 363 0.287 294 DF-RF Lafage et al. (1987) 294–413 1.12 413
0.253 294 DF-LIF Lafage et al. (1987) 0.261±0.013 296 PLP-LIF Zabarnick et al. (1988) 0.238±0.016 297±2 DF-LIF Abbatt et al. (1990)
1000/T (K) 0 1 2 3 4 5 6 log k (cm 3 molecule -1 s -1 ) -14 -13 -12 -11 -10 Tully et al. (1983) Smith et al. (1984) Tully et al. (1986a) Stachnik et al. (1986) Wallington et al. (1987) Abbatt et al. (1990) Bott and Cohen (1991a) Talukdar et al. (1994) Koffend and Cohen (1996) Donahue et al. (1996, 1998) Clarke et al. (1998) Recommendation
Ethane
Fig. 4. Arrhenius plot of selected rate data for the reaction of OH
radicals with ethane.
2.6 OH+ethane
The available rate data are listed in Table 9. Over the temperature range ∼200–800 K the absolute rate constants of Overend et al. (1975), Howard and Evenson (1976b), Leu (1979), Lee and Tang (1982), Margitan and Wat-son (1982), Tully et al. (1983, 1986a), Smith et al. (1984), Devolder et al. (1984), Schmidt et al. (1985), Baulch et al. (1985), Stachnik et al. (1986), Bourmada et al. (1987), Wallington et al. (1987), Lafage et al. (1987), Zabarnick et al. (1988), Abbatt et al. (1990), Schiffman et al. (1991), D´ob´e et al. (1991, 1992), Sharkey and Smith (1993), Taluk-dar et al. (1994), Crowley et al. (1996), Donahue et al. (1996, 1998) and Clarke et al. (1998) are in good agreement. Be-cause several of these studies involved measurement of the rate constant for the reaction of OH radicals with ethane at one temperature (generally room temperature) as a check on the experimental technique used (Leu, 1979; Lee and Tang, 1982; Margitan and Watson, 1982; Devolder et al., 1984; Bourmada et al., 1987; Lafage et al., 1987; Zabarnick et al., 1988; D´ob´e et al., 1991, 1992), the rate constants from the more extensive absolute studies of Tully et al. (1983, 1986a), Smith et al. (1984), Stachnik et al. (1986), Wallington et al. (1987), Abbatt et al. (1990), Talukdar et al. (1994), Don-ahue et al. (1996, 1998) and Clarke et al. (1998), together with the elevated temperature rate constants of Bott and Co-hen (1991a) and Koffend and CoCo-hen (1996), are shown in the Arrhenius plot in Fig. 4. The agreement is seen to be
gener-ally excellent, and a least-squares analysis of the rate data of Smith et al. (1984), Tully et al. (1986a) (which is taken to supersede the earlier study of Tully et al., 1983), Stachnik et al. (1986), Wallington et al. (1987), Abbatt et al. (1990), Bott and Cohen (1991a), Talukdar et al. (1994), Koffend and Cohen (1996), Donahue et al. (1996, 1998) and Clarke et al. (1998), using the expression k=AT2e−B/T, leads to the recommendation of
k(ethane)=
1.49×10⁻¹⁷T2e−(499±14)/T cm3molecule−1s−1
over the temperature range 180–1230 K, where the indicated error in B is two least-squares standard deviations, and k(ethane)=
2.48 × 10⁻¹³cm3molecule−1s−1at 298 K.
The overall uncertainty in the rate constant at 298 K is es-timated to be ±20%. The recommended rate expression is shown as the solid line in the Arrhenius plot in Fig. 4. The rate constants measured by Crowley et al. (1996) at 247, 294 and 303 K to check for systematic errors in a newly con-structed apparatus are in good agreement with the recom-mended rate expression, being within 4% of the recommen-dation at 294 and 303 K and within 12% of the recommenda-tion at 247 K.
The elevated temperature rate constants derived from the relative rate studies of Baldwin et al. (1970b) (as re-evaluated by Baldwin and Walker, 1979) and Hucknall et al. (1975) are in reasonable agreement with the recommendation, to within 7% and 15%, respectively, thereby suggesting that the rate data from these two relative rate studies can be used with some confidence in the evaluations of rate data for other alkanes (see also the discussion of the rate constant for the propane reaction).
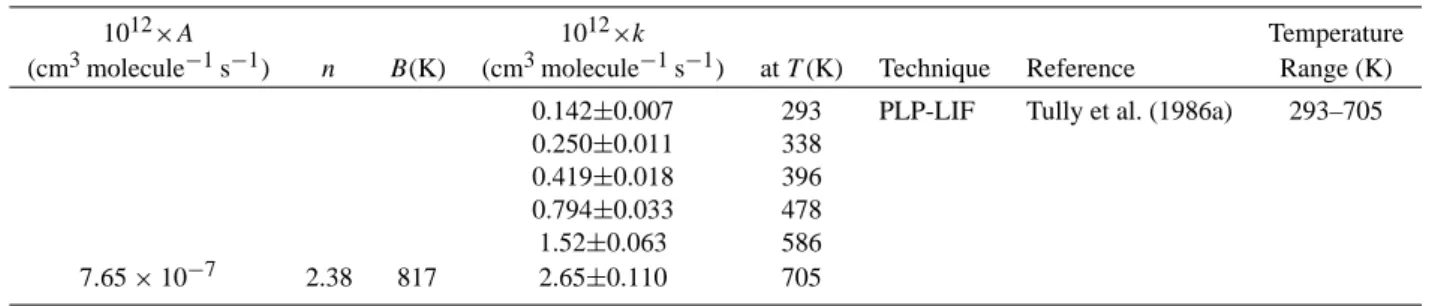
2.7 OH+ethane-d3and ethane-d6
The available rate data are listed in Tables 10 (ethane-d3) and 11 (ethane-d6). The only study of these reactions to date is that of Tully et al. (1986a). The data of Tully et al. (1986a) for ethane, ethane-d3and ethane-d6show that the CH3and CD3groups can be treated independent of whether the neighboring group is a CH3 or CD3 group. Thus, to a good approximation the rate constant for CH3CD3 is given by 0.5[k(ethane)+k(ethane-d6)], with a deuterium isotope ef-fect of
kH/ kD=k(ethane)/ k(ethane−d6)=(1.01±0.06)e(456±27)/T over the temperature range 293–705 K, and with kH/ kD=4.61±0.56 at 293 K (Tully et al., 1986a).
2.8 OH+propane
The available rate data are listed in Table 12. The ab-solute rate constants measured over the temperature range
Table 9. Continued.
1012×A 1012×k Temperature
(cm3molecule−1s−1) n B(K) (cm3molecule−1s−1) at T (K) Technique Reference Range (K) 0.243±0.012 ∼298b PLP-IR Schiffman et al. (1991)
0.274±0.040 298 PLP-RF D´ob´e et al. (1991, 1992) 15.4±2.4 1225±16 SH-RA Bott and Cohen (1991a)
0.013±0.002 138 PLP-LIF Sharkey and 138–298 0.025±0.003 178 Smith (1993) 0.0785±0.004 216 0.295±0.014 298 0.276±0.007 298 RR[relative to Finlayson-Pitts 298–373 0.270±0.012 298 k(propane)=1.65× et al. (1993) 0.362±0.014 323 10−17T2e−87/T] 0.468±0.013 348 0.579±0.010 373 0.0882±0.0024 231 PLP-LIF Talukdar 231–377 0.1269±0.0069 252 et al. (1994) 0.1303±0.0015 253 0.1778±0.0043 273 0.2461±0.0032 299 0.3380±0.0037 327 0.4589±0.0050 355 1.53 × 10⁻⁵ 2 512±7 0.5641±0.0082 377 10.3 1108±40
8.37 974±16 SH-RA Koffend and Cohen (1996)
0.108±0.002 247 PLP-RF Crowley et al. (1996) 247–303 0.228±0.004 294
0.267±0.003 303
0.255±0.03 300 DF-LIF Donahue et al. (1996)
0.259±0.008 300 DF-LIF Donahue et al. (1998) 298–407 0.355±0.011 325
0.390±0.012 340 0.438±0.023 360 0.561±0.017 375 0.604±0.018 390
Table 9. Continued
1012×A 1012×k Temperature
(cm3molecule−1s−1) n B(K) (cm3molecule−1s−1) at T (K) Technique Reference Range (K) 0.0269±0.0027 180 DF-LIF Clarke et al. (1998) 180–360 0.0377±0.0004 190 0.0454±0.0025 200 0.0651±0.0007 213 0.0808±0.0012 225 0.0967±0.0018 238 0.1251±0.0014 250 0.1640±0.0018 265 0.2081±0.0016 280 0.2515±0.0021 295 0.2953±0.0050 310 0.3464±0.0037 325 0.3744±0.0038 340 0.4637±0.0164 360
aCalculated from the cited Arrhenius expression. bRoom temperature; assumed to be ∼298 K.
Table 10. Rate constants and temperature-dependent parameters for the reaction of OH radicals with ethane-d3.
1012×A 1012×k Temperature
(cm3molecule−1s−1) n B(K) (cm3molecule−1s−1) at T (K) Technique Reference Range (K) 0.142±0.007 293 PLP-LIF Tully et al. (1986a) 293–705 0.250±0.011 338
0.419±0.018 396 0.794±0.033 478 1.52±0.063 586 7.65 × 10⁻⁷ 2.38 817 2.65±0.110 705
190–800 K by Tully et al. (1983), Droege and Tully (1986a) (which is viewed as superseding the earlier study of Tully et al., 1983), Nielsen et al. (1988), Abbatt et al. (1990), Mac Leod et al. (1990), Schiffman et al. (1991), Talukdar et al. (1994), Mellouki et al. (1994), Donahue et al. (1998), Clarke et al. (1998), Carl and Crowley (2001) and Kozlov et al. (2003) are in generally good agreement. The data from the more extensive studies of Droege and Tully (1986a), Abbatt et al. (1990), Mac Leod et al. (1990), Talukdar et al. (1994), Mellouki et al. (1994), Donahue et al. (1998), Clarke et al. (1998) and Kozlov et al. (2003) and the higher temperature data of Bott and Cohen (1984) and Smith et al. (1985) are shown in the Arrhenius plot in Fig. 5. A least-squares analysis of the data of Bott and Cohen (1984), Smith et al. (1985), Droege and Tully (1986a), Abbatt et al. (1990), Mac Leod et al. (1990), Talukdar et al. (1994), Mellouki et al. (1994), Donahue et al. (1998) and Clarke et al. (1998), using the expression k=AT2e−B/T, leads to the recommen-dation of
k(propane)=
1.65×10⁻¹⁷T2e−(87±18)/T cm3molecule−1s−1
over the temperature range 190–1220 K, where the indicated error in the value of B is two least-squares standard devia-tions, and
k(propane)=
1.09×10⁻¹²cm3molecule−1s−1at 298 K.
The overall uncertainty in the rate constant at 298 K is esti-mated to be ±20%. The recommended rate constant expres-sion is shown in the Arrhenius plot as the solid line (Fig. 5). The rate constants measured recently by Kozlov et al. (2003) agree with the recommendation to within 5% over the entire temperature range studied (210–480 K).
The rate constants derived from the relative rate studies of Baker et al. (1970) (as re-evaluated by Baldwin and Walker, 1979), Hucknall et al. (1975), Atkinson et al. (1982b), Ed-ney et al. (1986), Behnke et al. (1987), Finlayson-Pitts et al. (1993) and DeMore and Bayes (1999) are in generally ex-cellent agreement with the recommendation, to within 7%, 5%, 2%, 3%, 15%, 4% and 8%, respectively. The rate con-stants derived from the relative rate measurements of De-More and Bayes (1999) trend from being 2% higher than the recommendation at 428 K to being 7% lower than the
1012×A 1012×k Temperature (cm3molecule−1s−1) n B(K) (cm3molecule−1s−1) at T (K) Technique Reference Range (K)
0.0523±0.0060 293 PLP-LIF Tully et al. (1986a) 293–705 0.105±0.007 339.5 0.199±0.010 396 0.435±0.020 478 0.965±0.041 586 2.43×10⁻⁷ 2.56 1317 1.83±0.077 705 1000/T (K) 0 1 2 3 4 5 6 log k (cm 3 m olecule -1 s -1) -12.5 -12.0 -11.5 -11.0 -10.5
Bott and Cohen (1984) Smith et al. (1985) Droege and Tully (1986a) Abbatt et al. (1990) Mac Leod et al. (1990) Talukdar et al. (1994) Mellouki et al. (1994) Donahue et al. (1998) Clarke et al. (1998) Kozlov et al. (2003) Recommendation Propane
Fig. 5. Arrhenius plot of selected rate data for the reaction of OH
radicals with propane.
recommendation at 227 K. This good agreement of the rela-tive rate data of Baldwin and Walker (1979) (a re-evaluation of the earlier study of Baker et al., 1970), Hucknall et al. (1975), Atkinson et al. (1982b), Edney et al. (1986), Behnke et al. (1987) and DeMore and Bayes (1999) with ab-solute rate constant data means that these relative rate studies can be used with some confidence in the evaluations of rate data for ≥C4 alkanes for which fewer absolute rate studies have been carried out.
An Arrhenius plot of the absolute and relative rate data of Talukdar et al. (1994), Mellouki et al. (1994), Clarke et al. (1998), DeMore and Bayes (1999) and Kozlov et al. (2003) for temperatures <300 K is shown in Fig. 6. The agreement is excellent, with the largest disagreement with
1000/T (K) 3 4 5 6 log k (cm 3 m olecule -1 s -1 ) -12.5 -12.4 -12.3 -12.2 -12.1 -12.0 -11.9 Talukdar et al. (1994) Mellouki et al. (1994) Clarke et al. (1998) DeMore and Bayes (1999) Kozlov et al. (2003) Recommendation
Propane
Fig. 6. Arrhenius plot of selected rate data for the reaction of OH
radicals with propane at temperatures < 300 K.
the recommended expression (shown by the solid line) being 7% and with, for reference, the lowest temperature measure-ment by Clarke et al. (1998) at 190 K being 4% higher than the recommendation (and well within the stated 7% measure-ment uncertainty cited by Clarke et al., 1998).
2.9 OH+propane-d2, propane-d3, propane-d5, propane-d6 and propane-d8
The available rate data are listed in Tables 13 (propane-d2), 14 (propane-d3), 15 (propane-d5), 16 (propane-d6) and 17 (propane-d8). To date, the only study of these reac-tions is that of Droege and Tully (1986a). The data ob-tained for propane, propane-d2, propane-d3, propane-d5, propane-d6 and propane-d8 show that the CH3, CH2, CD3 and CD2groups can be treated as having rate constants which
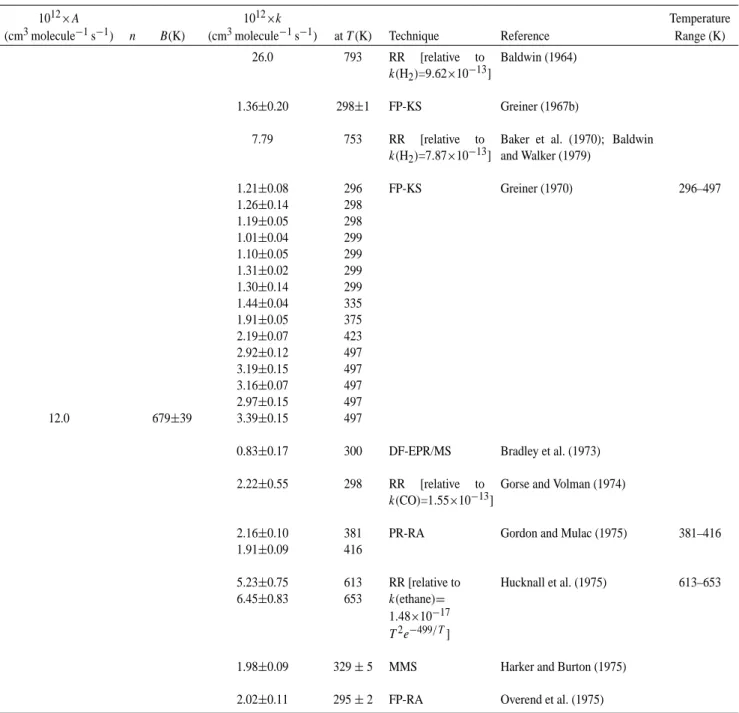
Table 12. Rate constants and temperature-dependent parameters for the reaction of OH radicals with propane.
1012×A 1012×k Temperature
(cm3molecule−1s−1) n B(K) (cm3molecule−1s−1) at T (K) Technique Reference Range (K) 26.0 793 RR [relative to k(H2)=9.62×10⁻¹³] Baldwin (1964) 1.36±0.20 298±1 FP-KS Greiner (1967b) 7.79 753 RR [relative to k(H2)=7.87×10⁻¹³]
Baker et al. (1970); Baldwin and Walker (1979) 1.21±0.08 296 FP-KS Greiner (1970) 296–497 1.26±0.14 298 1.19±0.05 298 1.01±0.04 299 1.10±0.05 299 1.31±0.02 299 1.30±0.14 299 1.44±0.04 335 1.91±0.05 375 2.19±0.07 423 2.92±0.12 497 3.19±0.15 497 3.16±0.07 497 2.97±0.15 497 12.0 679±39 3.39±0.15 497
0.83±0.17 300 DF-EPR/MS Bradley et al. (1973) 2.22±0.55 298 RR [relative to
k(CO)=1.55×10⁻¹³]
Gorse and Volman (1974)
2.16±0.10 381 PR-RA Gordon and Mulac (1975) 381–416 1.91±0.09 416
5.23±0.75 613 RR [relative to Hucknall et al. (1975) 613–653 6.45±0.83 653 k(ethane)=
1.48×10⁻¹⁷
T2e−499/T]
1.98±0.09 329 ± 5 MMS Harker and Burton (1975) 2.02±0.11 295 ± 2 FP-RA Overend et al. (1975)
Table 12. Continued.
1012×A 1012×k Temperature
(cm3molecule−1s−1) n B(K) (cm3molecule−1s−1) at T (K) Technique Reference Range (K) 1.39±0.20 300±1 RR [relative to k(n-butane)= 2.38×10⁻¹²] Darnall et al. (1978) 2.0 300 RR [relative to k(ethene)= 8.44×10⁻¹²]a Cox et al. (1980) 1.12±0.04 299±1 RR [relative to k(n-butane)= 2.37×10⁻¹²] Atkinson et al. (1982b)
1.86±0.15 428 RR [relative to Baulch et al. (1983) 428–696 2.74±0.24 489 k(CO)=9.1× 2.82±0.10 538 10−19T1.77e580/T] 4.10±0.22 589 4.95±0.55 641 7.58±0.72 696 1.05±0.04 297 FP-RF Tully et al. (1983) 297–690 1.48±0.06 326 2.51±0.20 378 3.37±0.23 469 4.78±0.34 554 1.59×10⁻³ 1.40 428 8.78±0.97 690
26.2±6.6 1220±15 SH-RA Bott and Cohen (1984) 1.0±0.2 295 PLP-LIF Schmidt et al. (1985) 1.20±0.19 295±2 DF-RA Baulch et al. (1985)
21.9±6.0 1074 LH-LIF Smith et al. (1985)
1.10±0.04 293 PLP-LIF Droege and Tully (1986a) 293–854 1.52±0.06 342 1.61±0.07 351.5 2.14±0.09 401 2.49±0.10 428 3.24±0.13 491 3.36±0.14 501.5
Table 12. Continued.
1012×A 1012×k Temperature
(cm3molecule−1s−1) n B(K) (cm3molecule−1s−1) at T (K) Technique Reference Range (K) 3.34±0.14 505 4.84±0.20 602 4.84±0.20 603 7.28±0.30 732 1.04×10⁻⁴ 1.72 145 9.31 ± 0.38 854 1.05±0.14 296.0±1.1 RR [relative to k(n-butane)= 2.33×10⁻¹²] Edney et al. (1986) 1.28 300±3 RR [relative to k(n-butane)= 2.38×10⁻¹²] Behnke et al. (1987)
1.27±0.11 295±2 PR-RA Nielsen et al. (1988) 1.21±0.10 297±2 DF-LIF Abbatt et al. (1990) 1.22±0.08 298 PLP-RF Mac Leod et al. (1990) 1.02±0.05 298b PLP-IR Schiffman et al. (1991) 1.40±0.30 298 PLP-RF D´ob´e et al. (1991) 0.996±0.043 298±2 RR [relative to
k(2-methylpropane)= 2.12×10⁻¹²]
Nielsen et al. (1991a)
1.07±0.06 298 RR[relative to Finlayson-Pitts et al. (1993) 1.07±0.05 298 k(n-butane)=
2.36×10⁻¹²]
1.11±0.04 298 RR[relative to Finlayson-Pitts et al. (1993) 1.05±0.06 298 k(2-methylpropane) =2.12×10⁻¹²] 0.942±0.095 298±2 RR [relative to k(ethane)= 2.48×10⁻¹³] DeMore (1993c)
0.623±0.016 233 PLP-LIF Talukdar et al. (1994) 233–376 0.741±0.019 252
Table 12. Continued.
1012×A 1012×k Temperature
(cm3molecule−1s−1) n B(K) (cm3molecule−1s−1) at T (K) Technique Reference Range (K) 0.862±0.023 272 1.123±0.040 299 1.342±0.064 325 1.574±0.052 351 1.58×10⁻⁵ 2 74±25 1.816±0.067 376 10.1 657±46
0.61±0.04 233 PLP-LIF Mellouki et al. (1994) 233–363 0.75±0.04 253 0.92±0.04 273 1.05±0.04 295 1.25±0.04 318 1.51±0.02 343 9.81 650±30 1.65±0.07 363
1.09±0.03 300 DF-LIF Donahue et al. (1998) 299–394 1.37±0.04 325
1.46±0.04 340 1.60±0.09 360 1.85±0.06 375 1.83±0.10 390
0.3626±0.0247 190 DF-LIF Clarke et al. (1998) 190–360 0.4136±0.0127 200 0.4864±0.0095 213 0.5602±0.0063 225 0.6475±0.0053 238 0.7532±0.0051 250 0.8691±0.0147 265 1.129±0.0159 295 1.276±0.0182 310 1.356±0.0140 325 1.480±0.0136 340 1.640±0.0229 360
0.540 227 RR [relative to DeMore and Bayes (1999) 227–428 0.611 237 k(ethane)= 0.671 246 1.49×10⁻¹⁷ 0.808 265 T2e−499/T] 0.878 273 0.961 283 0.999 287 1.09 298
Table 12. Continued.
1012×A 1012×k Temperature
(cm3molecule−1s−1) n B(K) (cm3molecule−1s−1) at T (K) Technique Reference Range (K) 1.35 323
1.52 343 1.62 349 1.96 383 2.52 428
1.15±0.1 298 PLP-RF Carl and Crowley (2001) 1.17±0.1 298 0.46±0.02 210 FP-RF Kozlov et al. (2003) 210–480 0.539±0.007 220 0.579±0.009 230 0.732±0.012 250 0.884±0.016 272 1.13 ±0.02 298 1.43±0.03 330 1.86±0.05 370 2.43±0.04 420 5.81×10⁻⁵ 1.83 167 3.34±0.07 480 aFrom Atkinson (1997).
bRoom temperature; assumed to be ∼298 K.
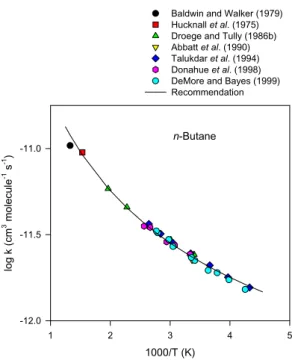
1000/T (K) 1 2 3 4 5 log k (cm 3 m olecule -1 s -1) -12.0 -11.5 -11.0
Baldwin and Walker (1979) Hucknall et al. (1975) Droege and Tully (1986b) Abbatt et al. (1990) Talukdar et al. (1994) Donahue et al. (1998) DeMore and Bayes (1999) Recommendation
n-Butane
Fig. 7. Arrhenius plot of selected rate data for the reaction of OH
radicals with n-butane.
are independent of the isotopic nature of the neighboring group(s) (Droege and Tully, 1986a). Using the kH/ kD ratio
for CH3/CD3groups obtained from the rate data for ethane, ethane-d3 and ethane-d6 (Tully et al., 1986a; see reactions above), Droege and Tully (1986a) derived rate constants for H-atom abstraction from the primary C–H bonds of the two CH3groups (2kprimary) and from the secondary C–H bonds in the CH2group (ksecondary), of
2kprimary=1.75×10⁻¹⁴T0.97e−798/T cm3molecule−1s−1
2kprimary=3.0×10⁻¹³cm3molecule−1s−1 at 298 K
and
ksecondary=7.76 × 10⁻¹⁷T1.61e18/Tcm3molecule−1s−1
ksecondary=7.9×10⁻¹³cm3molecule−1s−1at 298 K. Droege and Tully (1986a) also derived the deuterium iso-tope effect for H-/D-atom abstraction from secondary CH2 or CD2groups, of
kH/ kD(CH2/CD2groups)=(1.13±0.19)e(262±78)/T over the temperature range 295–854 K, with kH/ kD(CH2/CD2groups)=2.62±0.49 at 295 K.
1012×A 1012×k Temperature (cm3molecule−1s−1) n B(K) (cm3molecule−1s−1) at T (K) Technique Reference Range (K)
0.610±0.028 295 PLP-LIF Droege and Tully (1986a) 295–854 0.802±0.034 328.5 1.20±0.05 376.5 1.72±0.07 437.2 2.47±0.10 503.5 3.79±0.16 603 5.92±0.24 732 2.02×10⁻⁴ 1.63 383 7.86±0.32 854
Table 14. Rate constants and temperature-dependent parameters for the reaction of OH radicals with propane-d3[CH3CH2CD3].
1012×A 1012×k Temperature
(cm3molecule−1s−1) n B(K) (cm3molecule−1s−1) at T (K) Technique Reference Range (K) 0.984±0.050 295 PLP-LIF Droege and Tully (1986a) 295–854
1.28±0.06 328.5 1.62±0.07 376.5 2.17±0.09 437.2 2.88±0.12 503.5 4.19±0.18 603 6.20±0.26 728 2.26×10⁻⁵ 1.90 40 8.06±0.34 854 1000/T (K) 0 1 2 3 4 5 log k (cm 3 m olecule -1 s -1) -12.0 -11.5 -11.0 -10.5
Baldwin and Walker (1979) Hucknall et al. (1975) Atkinson et al. (1984) Tully et al. (1986b) Bott and Cohen (1989) Talukdar et al. (1994) Donahue et al. (1998) Recommendation
2-Methylpropane
Fig. 8. Arrhenius plot of selected rate data for the reaction of OH
radicals with 2-methylpropane.
2.10 OH+n-butane
The available rate data are listed in Table 18. The abso-lute rate constant measurements carried out over the temper-ature range 231–509 K by Schmidt et al. (1985), Droege and Tully (1986b), Abbatt et al. (1990), Schiffman et al. (1991), Talukdar et al. (1994), Donahue et al. (1998) and Chuong and Stevens (2002) are in good agreement, with earlier absolute rate measurements of Greiner (1970), Perry et al. (1976) and Paraskevopoulos and Nip (1980) at room temperature being ∼10–15% higher than these more recent studies. Figure 7 shows an Arrhenius plot of the absolute rate constants of Droege and Tully (1986b), Abbatt et al. (1990), Talukdar et al. (1994) and Donahue et al. (1998) together with the rela-tive rate data of Baker et al. (1970) (as re-evaluated by Bald-win and Walker, 1979), Hucknall et al. (1975) and DeMore and Bayes (1999). A least-squares fit of these data (Hucknall et al., 1975; Baldwin and Walker, 1979; Droege and Tully, 1986b; Abbatt et al., 1990; Talukdar et al., 1994; Donahue et al., 1998; DeMore and Bayes, 1999), using the expression k=AT2e−B/T, results in the recommendation of
k(n−butane)=
Table 15. Rate constants and temperature-dependent parameters for the reaction of OH radicals with propane-d5[CH3CD2CD3].
1012×A 1012×k Temperature
(cm3molecule−1s−1) n B(K) (cm3molecule−1s−1) at T (K) Technique Reference Range (K) 0.478±0.021 295 PLP-LIF Droege and Tully (1986a) 295–840 0.621±0.026 328.5 0.950±0.040 376.5 1.38±0.06 437.2 1.96±0.08 503.5 3.13±0.13 603 4.93±0.20 728 2.59×10⁻⁵ 1.91 303 6.60±0.27 840
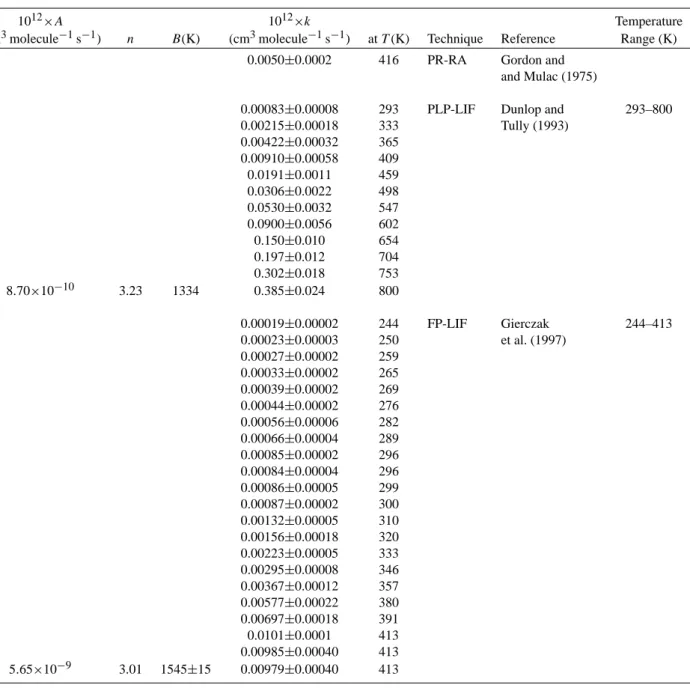
Table 16. Rate constants and temperature-dependent parameters for the reaction of OH radicals with propane-d6[CD3CH2CD3].
1012×A 1012×k Temperature
(cm3molecule−1s−1) n B(K) (cm3molecule−1s−1) at T (K) Technique Reference Range (K) 0.826±0.040 295 PLP-LIF Droege and Tully (1986a) 295–840 0.999±0.045 328.5 1.37±0.06 376.5 1.79±0.08 437.2 2.46±0.10 503.5 3.55±0.15 603 5.31±0.22 732 1.03×10⁻⁵ 2.00 23 6.78±0.28 840
over the temperature range 230–760 K, where the indicated error in the value of B is two least-squares standard devia-tions, and
k(n−butane)=
2.36×10⁻¹²cm3molecule−1s−1at 298 K.
The overall uncertainty in the rate constant is estimated to be ±20% at 298 K. The recommended rate constant expression is shown as the solid line in the Arrhenius plot (Fig. 7).
While the rate constants derived from relative rate studies of Atkinson et al. (1981) and Atkinson and Aschmann (1984) agree with the recommendation within the experimental un-certainties, these rate constants (Atkinson et al., 1981; Atkin-son and Aschmann, 1984) for the n-butane reaction were measured relative to that for reaction of the OH radical with propene, with the rate constant ratio of ∼10 being outside of the range (∼0.2–5) of highest accuracy.
2.11 OH+n-butane-d10
The available rate data are listed in Table 19. The room tem-perature rate constant of Paraskevopoulos and Nip (1980) is 20–25% lower than those of Droege and Tully (1986b), which is the only temperature-dependent study to date. Com-bining their rate constants for n-butane and n-butane-d10
with the deuterium isotope ratio kH/ kD obtained for the
ethane reaction (Tully et al., 1986a), and using the fraction of the overall OH radical reaction proceeding by H-atom ab-straction from the secondary CH2 groups in n-butane esti-mated by Atkinson (1986), Droege and Tully (1986b) de-rived rate constants for H-atom abstraction from the primary C–H bonds of the two CH3groups (2kprimary) and from the secondary C–H bonds in the two CH2groups (2ksecondary), of
2kprimary=6.86×10⁻¹⁷T1.73e−379/T cm3molecule−1s−1
2kprimary=3.7×10⁻¹³cm3molecule−1s−1 at 298 K
and
2ksecondary=1.20×10⁻¹⁶T1.64e124/Tcm3molecule−1s−1
2ksecondary=2.08×10⁻¹²cm3molecule−1s−1at 298 K.
Droege and Tully (1986b) also derived the deuterium isotope effect for H-/D-atom abstraction from secondary CH2or CD2 groups, of
kH/ kD(CH2/CD2groups)=(1.31 ± 0.12)e(196±33)/T over the temperature range 294–509 K, with
1012×A 1012×k Temperature (cm3molecule−1s−1) n B(K) (cm3molecule−1s−1) at T (K) Technique Reference Range (K)
0.408±0.045 295 PLP-LIF Droege and Tully (1986a) 295–854 0.527±0.043 328.5 0.746±0.047 376.5 1.09±0.06 437.2 1.50±0.07 503.5 2.55±0.11 603 4.25±0.18 728 2.36×10⁻⁷ 2.53 15 5.88±0.25 854
This deuterium isotope ratio of kH/ kD(CH2/CD2 groups) obtained from the n-butane and n-butane-d10 reactions is essentially identical to the ratio of 2.62±0.49 at 295 K ob-tained from the propane, propane-d2, propane-d3, propane-d5, propane-d6and propane-d8reactions (Droege and Tully, 1986a).
2.12 OH+2-methylpropane
The available rate data are listed in Table 20. The abso-lute rate constants measured over the temperature range 213– 864 K by Tully et al. (1986b), Schiffman et al. (1991), Taluk-dar et al. (1994) and Donahue et al. (1998) are in good agree-ment. Figure 8 shows an Arrhenius plot of the absolute rate constants of Tully et al. (1986b), Bott and Cohen (1989), Talukdar et al. (1994) and Donahue et al. (1998) (no precise temperature was specified in the Schiffman et al., 1991 study) together with the relative rate data of Baker et al. (1970) (as re-evaluted by Baldwin and Walker, 1979), Hucknall et al. (1975) and Atkinson et al. (1984). The agreement is good and a least-squares analysis of these data (Hucknall et al., 1975; Baldwin and Walker, 1979; Atkinson et al., 1984; Tully et al., 1986b; Bott and Cohen, 1989; Taluk-dar et al., 1994; Donahue et al., 1998), using the expression k=AT2e−B/T, leads to the recommendation of
k(2−methylpropane)=
1.17×10⁻¹⁷T2e(213±24)/T cm3molecule−1s−1
over the temperature range 210–1150 K, where the indicated error in the value of B is two least-squares standard devia-tions, and
k(2−methylpropane)=
2.12×10⁻¹²cm3molecule−1s−1at 298 K.
The overall uncertainty in the rate constant is estimated to be ±20% at 298 K. The recommended rate constant ex-pression is also shown as the solid line in the Arrhenius plot (Fig. 8).
2.13 OH+2-methylpropane-d1, 2-methylpropane-d9and 2-methylpropane-d10
The available rate data are listed in Tables 21 (2-methylpropane-d1), 22 (2-methylpropane-d9) and 23 (2-methylpropane-d10). To date, the only study of these re-actions is that of Tully et al. (1986b). Combining their rate constants for 2-methylpropane, 2-methylpropane-d1, 2-methylpropane-d9 and 2-methylpropane-d10 with the deu-terium isotope ratio kH/ kD(CH3/CD3groups) obtained from the 2,2-dimethylpropane (neopentane) reaction (Tully et al., 1985, 1986a), Tully et al. (1986b) derived rate constants for H-atom abstraction from the primary C–H bonds of the three CH3groups (3kprimary) and from the tertiary C–H bond in the CH group (ktertiary), of 3kprimary=3.81×10⁻¹⁶T1.53e−391/T cm3molecule−1s−1 3kprimary=6.3×10⁻¹³cm3molecule−1s−1at 298 K and ktertiary=9.52×10⁻¹⁴T0.51e−32/Tcm3molecule−1s−1 ktertiary=1.56×10⁻¹²cm3molecule−1s−1at 298 K.
Tully et al. (1986b) also derived the deuterium isotope ef-fect for H-/D-atom abstraction from the tertiary CH or CD group, of kH/ kD(CH/CD group)=1.91 at 294 K.
2.14 OH+n-pentane
The available rate data are listed in Table 24. The absolute rate studies of Abbatt et al. (1990), Talukdar et al. (1994) and Donahue et al. (1998) are in good agreement at room tem-perature, and those of Talukdar et al. (1994) and Donahue et al. (1998) agree well over the temperature range common to both studies (300–370 K). However, rate constants derived from the relative rate studies of Atkinson et al. (1982b), Behnke et al. (1987, 1988), Harris and Kerr (1988), Don-aghy et al. (1993) and DeMore and Bayes (1999) are con-sistently ∼10% lower that the absolute rate constants. Fig-ure 9 shows an Arrhenius plot of the absolute rate constants
Table 18. Rate constants and temperature-dependent parameters for the reaction of OH radicals with n-butane.
1012×A 1012×k Temperature
(cm3molecule−1s−1) n B(K) (cm3molecule−1s−1) at T (K) Technique Reference Range (K) 34.6 793 RR [relative to
k(H2)= 9.62×10⁻¹³]
Baldwin and Walker (1964)
10.4 753 RR [relative to k(H2)= 7.87×10⁻¹³]
Baker et al. (1970); Bald-win and Walker (1979)
2.56±0.09 298 FP-KS Greiner (1970) 298–495 2.59±0.22 301 2.79±0.32 336 2.96±0.10 373 4.85±0.19 425 4.12±0.15 428 14.1 524±94 4.90±0.17 495 4.1 298 RR [relative to k(propene, 1 Torr He)= 1.7×10⁻¹¹]a
Morris and Niki (1971)
2.35± 0.35 298 FP-RF Stuhl (1973) 3.01± 0.76 298 RR [relative to
k(CO)= 1.55×10⁻¹³]
Gorse and Volman (1974)
4.22±0.17 298 PR-RA Gordon and Mulac (1975) 298–416 4.15±0.17 381 4.98±0.17 416 9.49±0.80 653 RR [relative to k(propane)= 6.16×10⁻¹²] Hucknall et al. (1975) 2.46±0.15 292 ± 2 RR [relative to k(CO)= 1.66×10⁻¹³] Campbell et al. (1975) 2.72±0.27 297.7 FP-RF Perry et al. (1976) 297–420 3.54±0.35 351.0 17.6 559±151 4.69±0.47 419.6
Table 18. Continued.
1012×A 1012×k Temperature
(cm3molecule−1s−1) n B(K) (cm3molecule−1s−1) at T (K) Technique Reference Range (K) 2.67±0.22 297±2 FP-RA Paraskevopoulos and Nip
(1980) 2.52±0.25 299±2 RR [relative to k(propene)= 2.62×10⁻¹¹]b Atkinson et al. (1981) 2.71±0.33 295±1 RR [relative to k(propene)= 2.68×10⁻¹¹]b
Atkinson and Aschmann (1984)
2.3±0.3 295 PLP-LIF Schmidt et al. (1985)
2.42±0.10 294 PLP-LIF Droege and Tully (1986b) 294–509 2.95±0.12 332 3.53±0.15 377 4.56±0.19 439 2.34×10⁻⁵ 1.95 −134 5.84±0.25 509 2.70±0.34 300 RR [relative to k(ethene)= 8.44×10⁻¹²]b Barnes et al. (1986) 2.36±0.04 300 RR [relative to k(n-octane)= 8.15×10⁻¹²] Behnke et al. (1988)
2.25±0.10 297 ± 2 DF-LIF Abbatt et al. (1990) 2.32±0.08 ∼298c PLP-IR Schiffman et al. (1991)
1.560±0.015 231 PLP-LIF Talukdar et al. (1994) 231–378 1.788±0.018 252 2.097±0.024 273 2.459±0.018 299 2.828±0.060 328 3.196±0.032 352 2.04×10⁻⁵ 2 −85±8 3.647±0.022 378 11.8 470±40 (231–299 K)
Table 18. Continued.
1012×A 1012×k Temperature
(cm3molecule−1s−1) n B(K) (cm3molecule−1s−1) at T (K) Technique Reference Range (K) 2.43±0.07 300 DF-LIF Donahue et al. (1998) 299–386 2.74±0.08 325
2.87±0.09 340 3.48±0.10 375 3.54±0.11 390
1.52 235 RR [relative to DeMore and Bayes (1999) 235–361 1.73 251 k(propane)= 1.90 264 1.65×10⁻¹⁷ 1.96 275 T2e−87/T] 2.24 293 2.33 298 2.70 328 2.96 336 3.24 358 3.32 361
2.6±0.5 300 DF-LIF Chuong and Stevens (2002) 2.6±0.2 300
aMeasured under the same conditions by Morris et al. (1971). bFrom Atkinson (1997).
cRoom temperature; assumed to be ∼298 K.
Table 19. Rate constants and temperature-dependent parameters for the reaction of OH radicals with n-butane-d10.
1012×A 1012×k Temperature
(cm3molecule−1s−1) n B(K) (cm3molecule−1s−1) at T (K) Technique Reference Range (K) 0.697±0.0069 297±2 FP-RA Paraskevopoulov and Nip (1980)
0.893±0.037 294 PLP-LIF Droege and Tully (1986b) 294–599 1.13±0.05 332
1.49±0.06 377 2.07±0.09 439 2.87±0.12 509 2.92×10⁻⁶ 2.20 −33 3.98±0.17 599
of Abbatt et al. (1990), Talukdar et al. (1994) and Donahue et al. (1998) together with the relative rate data of Bald-win and Walker (1979), Atkinson et al. (1982b), Harris and Kerr (1988) and DeMore and Bayes (1999). An apprecia-ble amount of scatter in the data is apparent, both between and within the various studies. A least-squares analysis of the rate constants from these studies (Baldwin and Walker, 1979; Atkinson et al., 1982b; Harris and Kerr, 1988; Abbatt et al., 1990; Talukdar et al., 1994; Donahue et al., 1998; De-More and Bayes, 1999), using the expression k=AT2e−B/T, leads to the recommendation of
k(n−pentane)=2.52×10⁻¹⁷T2e(158±40)/Tcm3molecule−1s−1 over the temperature range 220–760 K, where the indicated error in the value of B is two least-squares standard devia-tions, and
k(n−pentane)=3.80×10⁻¹²cm3molecule−1s−1at 298 K. The overall uncertainty in the rate constant at 298 K is esti-mated to be ±25%. The recommended rate constant expres-sion is shown as the solid line in the Arrhenius plot (Fig. 9). In the temperature range 224–390 K, the absolute rate con-stants are generally slightly higher than the recommendation,
Table 20. Rate constants and temperature-dependent parameters for the reaction of OH radicals with 2-methylpropane.
1012×A 1012×k Temperature
(cm3molecule−1s−1) n B(K) (cm3molecule−1s−1) at T (K) Technique Reference Range (K) 19.2 793 RR [relative to
k(H2)= 9.62×10⁻¹³]
Baldwin and Walker (1964)
2.13±0.12 297±1 FP-KS Greiner (1967b) 9.92 753 RR [relative to
k(H2)= 7.87×10⁻¹³]
Baker et al. (1970); Bald-win and Walker (1979)
2.14±0.12 297 FP-KS Greiner (1970) 297–498 2.23±0.05 297 2.67±0.17 298 2.56±0.05 304 2.69±0.15 305 3.01±0.07 338 2.91±0.07 371 3.04±0.14 374 3.57±0.15 425 8.7 387±63 4.25±0.22 498 3.64±0.91 298 RR [relative to k(CO)= 1.55×10⁻¹³]
Gorse and Volman (1972/73); Gorse and Volman (1974) 7.88±0.44 653 RR [relative to k(propane)= 6.16×10⁻¹²] Hucknall et al. (1975) 2.2 303 RR [relative to k(cis-2-butene)= 5.49×10⁻¹¹]a Wu et al. (1976) 2.20±0.05 300±1 RR [relative to k(n-butane)= 2.38×10⁻¹²] Darnall et al. (1978) 2.70±0.22 267 PLP-RF Trevor et al. (1982) 267–324 3.6 298 3.62±0.40 324 2.07±0.05 297±2 RR [relative to k(n-butane)= 2.34×10⁻¹²] Atkinson et al. (1984)
Table 20. Continued.
1012×A 1012×k Temperature
(cm3molecule−1s−1) n B(K) (cm3molecule−1s−1) at T (K) Technique Reference Range (K) 1.83±0.34 296 PLP-LMR B¨ohland et al. (1984)
1.9±0.3 295 PLP-LIF Schmidt et al. (1985)
2.19±0.11 293 PLP-LIF Tully et al. (1986b) 293–864 2.59±0.13 342 3.21 ±0.16 403 3.49±0.17 424 4.03±0.20 470 4.58±0.23 509.5 5.49±0.27 574 7.40±0.37 705 4.31×10⁻⁵ 1.80 −175 10.13±0.51 864 2.18±0.31 297.8±0.4 RR [relative to k(n-butane)= 2.35×10⁻¹²] Edney et al. (1986)
20.9±4.2 1146±15 SH-RA Bott and Cohen (1989) 2.11±0.09 ∼298b PLP-IR Schiffman et al. (1991)
1.55±0.18 213 PLP-LIF Talukdar et al. (1994) 213–372 1.58±0.09 224 1.69±0.06 234 1.67±0.06 243 1.745±0.06 253 1.82±0.11 272 2.13±0.10 296 2.19±0.04 297 1.96±0.09 298 2.29±0.07 323 2.40±0.10 343 2.54±0.03 357 9.32×10⁻⁶ 2 −274±16 2.73±0.06 372 5.72 293±40 (213–298 K)
1012×A 1012×k Temperature (cm3molecule−1s−1) n B(K) (cm3molecule−1s−1) at T (K) Technique Reference Range (K)
2.09±0.06 300 DF-LIF Donahue et al. (1998) 298–388 2.38±0.07 325
2.47±0.09 340 2.62±0.08 375 2.72±0.14 390
aFrom Atkinson (1997).
bRoom temperature; assumed to be ∼298 K.
Table 21. Rate constants and temperature-dependent parameters for the reaction of OH radicals with 2-methylpropane-d1[(CH3)3CD].
1012×A 1012×k Temperature
(cm3molecule−1s−1) n B(K) (cm3molecule−1s−1) at T (K) Technique Reference Range (K) 1.36±0.07 293.5 PLP-LIF Tully et al. (1986b) 293–864 1.81±0.09 344 2.44±0.12 403 3.35±0.17 473 4.84±0.24 574 7.12±0.36 705 1.20×10⁻⁴ 1.69 85 9.90±0.49 864 1000/T (K) 1 2 3 4 5 log k (cm 3 m olecule -1 s -1) -11.6 -11.4 -11.2 -11.0 -10.8 -10.6
Baldwin and Walker (1979) Atkinson et al. (1982b) Harris and Kerr (1988) Abbatt et al. (1990) Talukdar et al. (1994) Donahue et al. (1998) DeMore and Bayes (1999) Recommendation
n-Pentane
Fig. 9. Arrhenius plot of selected rate data for the reaction of OH
radicals with n-pentane.
1000/T (K) 1 2 3 4 log k (cm 3 m olecule -1 s -1) -12.2 -12.0 -11.8 -11.6 -11.4 -11.2 -11.0 -10.8 Greiner (1970)
Baldwin and Walker (1979) Paraskevopoulos and Nip (1980) Atkinson et al. (1982a) Tully et al. (1986a) Nielsen et al. (1991b) Recommendation
2,2-Dimethylpropane
Fig. 10. Arrhenius plot of selected rate data for the reaction of OH
![Table 16. Rate constants and temperature-dependent parameters for the reaction of OH radicals with propane-d 6 [CD 3 CH 2 CD 3 ].](https://thumb-eu.123doks.com/thumbv2/123doknet/14774896.593182/31.892.72.831.418.601/table-constants-temperature-dependent-parameters-reaction-radicals-propane.webp)