arXiv:0805.4153v1 [nucl-ex] 27 May 2008
Thermal dileptons at SPS energies
S Damjanovic (for the NA60 Collaboration)
CERN, 1211 Geneva 23, Switzerland E-mail: [email protected]
Abstract. Clear signs of excess dileptons above the known sources were found at the
SPS since long. However, a real clarification of these observations was only recently achieved by NA60, measuring dimuons with unprecedented precision in 158A GeV In-In collisions. The excess mass spectrum in the region M <1 GeV is consistent
with a dominant contribution from π+π− → ρ → µ+µ− annihilation. The associated
ρ spectral function shows a strong broadening, but essentially no shift in mass. In the region M >1 GeV, the excess is found to be prompt, not due to enhanced charm
production. The inverse slope parameter Teffassociated with the transverse momentum
spectra rises with mass up to the ρ, followed by a sudden decline above. While the initial rise, coupled to a hierarchy in hadron freeze-out, points to radial flow of a hadronic decay source, the decline above signals a transition to a low-flow source, presumably of partonic origin. The mass spectra show at low transverse momenta the steep rise towards low masses characteristic for Planck-like radiation. The polarization
of the excess referred to the Collins Soper frame is found to be isotropic. All
observations are consistent with the interpretation of the excess as thermal radiation.
Dileptons are particularly attractive to study the hot and dense QCD matter formed in high-energy nuclear collisions. In contrast to hadrons, they directly probe the entire space-time evolution of the expanding system, escaping freely without final-state interactions. At low masses M<1 GeV (LMR), thermal dilepton production is mediated by the broad vector meson ρ (770) in the hadronic phase. Due to its strong coupling to the ππ channel and the short life time of only 1.3 fm/c, “in-medium” modifications of its mass and width close to the QCD phase boundary have since long been considered as the prime signature for chiral symmetry restoration [1, 2, 3]. At intermediate masses M>1 GeV (IMR), it has been controversial up to today whether thermal dileptons are dominantly produced in the earlier partonic or in the hadronic phase, based here on hadronic processes other than ππ annihilation. Originally, thermal emission from the early phase was considered as a prime probe of deconfinement [4, 5].
Experimentally, it took more than a decade to master the challenges of very rare signals and enormous combinatorial backgrounds. The first clear signs of an excess of dileptons above the known decay sources at SPS energies were obtained by CERES [6] for M<1 GeV, NA38/NA50 [7] for M>1 GeV and by HELIOS-3 [8] for both mass regions (see [9] for a short recent review including the preceding pp era and the theoretical milestones). The final status reached by CERES [10] and NA50 [7] is illustrated in Fig. 1. The sole existence of an excess gave a strong boost to theory, with hundreds
0 0.2 0.4 0.6 0.8 1 1.2 1.4 1.6 -8 10 -7 10 -6 10 -5 10 -4 10 -1) 2 >(100 MeV/c ch >/<N ee /dm ee <dN ) 2 (GeV/c ee m CERES/NA45 Pb-Au 158 A GeV
7 % ≈ tot σ / trig σ >200 MeV/c t p >35 mrad ee Θ <2.65 η 2.1< Rapp/Wambach Brown/Rho cocktail
Figure 1. Excess dileptons seen in previous SPS experiments by CERES [10] (LMR,
left) and NA50 [7] (IMR, right). For the former, there is now some sensitivity (around 0.9 GeV) to specific theoretical predictions.
of publications. In the LMR region, ππ annihilation with regeneration and strong in-medium modifications of the intermediate ρ during the fireball expansion emerged as the dominant source. However, the data quality in terms of statistics and mass resolution remained largely insufficient for a precise assessment for the in-medium spectral properties of the ρ. In the IMR region, thermal sources or enhanced charm production could account for the excess equally well, but that ambiguity could not be resolved, nor could the nature of the thermal sources be clarified.
A big step forward in technology, leading to completely new standards of the data quality in this field, has recently been achieved by NA60, a third-generation experiment built specifically to follow up the open issues addressed above [11]. Initial results on mass and transverse momentum spectra of the excess dimuons have already been published [12, 13]. This paper shortly reviews these results, but also reports on further aspects associated with the centrality dependence, polarization, acceptance-corrected mass spectra and absolute normalization.
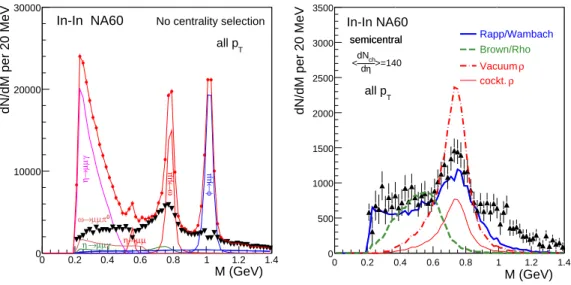
Fig. 2 (left) shows the centrality-integrated net dimuon mass spectrum for 158A GeV In-In collisions in the LMR region. The narrow vector mesons ω and φ are completely resolved; the mass resolution at the ω is 20 MeV. The peripheral data can be completely described by the electromagnetic decays of neutral mesons [12, 14]. This is not true for the more central data as plotted in Fig. 2, due to the existence of a strong excess of pairs. The high data quality of NA60 allows to isolate this excess with a priori
unknown characteristicswithout any fits: the cocktail of the decay sources is subtracted
from the total data using local criteria, which are solely based on the mass distribution itself. The ρ is not subtracted. The excess resulting from this difference formation is illustrated in the same figure (see [12, 13, 14] for details and error discussion).
The common features of the excess mass spectra can be recognized in Fig. 2 (right). A peaked structure is always seen, residing on a broad continuum with a yield strongly
0 0.2 0.4 0.6 0.8 1 1.2 1.4 0 10000 20000 30000 No centrality selection In-In NA60 M (GeV) dN/dM per 20 MeV T all p γµ µ →η µµ →ω µµ→φ 0 π µ µ → ω µ µ → η γ µ µ → ’ η 0 0.2 0.4 0.6 0.8 1 1.2 1.4 0 500 1000 1500 2000 2500 3000 3500 In-In NA60 semicentral T all p semicentral dN/dM per 20 MeV M (GeV) Rapp/Wambach Brown/Rho ρ Vacuum ρ cockt. >=140 η d ch dN <
Figure 2. Background-subtracted mass spectrum before (dots) and after subtraction
of the known decay sources (triangles). Right: Excess dimuons compared to theoretical predictions, keeping the original normalization in absolute terms [15].
increasing with centrality (see below), but remaining essentially centered around the
nominal ρ pole [14]. Without any acceptance correction and pT selection, the data can
directly be interpreted as the space-time averaged spectral function of the ρ, due to a
fortuitous cancellation of the mass and pT dependence of the acceptance filtering and
the phase space factors associated with thermal dilepton emission [14]. The two main theoretical scenarios for the in-medium spectral properties of the ρ, broadening [2] and dropping mass [3], are shown for comparison. Both have been evaluated for the same fireball evolution [15], and the original normalization is kept (in contrast to previous versions of the figure [12, 14]). Clearly, the broadening scenario gets close, while the dropping mass scenario in the version which described the CERES data reasonably well [2, 3, 6] fails for the much more precise NA60 data. A strong reduction of in-medium VMD as proposed by the vector manifestation of chiral symmetry [16] would make hadron spectral functions in hot and dense matter altogether unobservable, but central aspects of this scenario are totally unclear, and quantitative predictions which could be confronted with data have not become available up to today.
A detailed view of the shape of the excess mass spectra is obtained by using a side window method [14] to determine separately the yields of the peak and the underlying continuum. The left panel of Fig. 3 shows the centrality dependence of these variables: peak, underlying continuum and total yield in the mass interval 0.4<M<1.0 GeV, all normalized to the cocktail ρ. The continuum and the total show a very strong increase, starting already in the peripheral region. In the right panel of Fig. 3, the same data of the 2π region is plotted on a double logarithmic scale, but here the excess in a mass window above M> 1GeV is also contained. This increases even steeper than the total low-mass yield, as is clearly borne out by the rising ratio of the two. The rise is about
50 100 150 200 250 0 1 2 3 4 5 6 /dy ch dN Yield ratios ρ continuum/ ρ / 0.4<M<1.0 excess ρ peak/ =1.0 ω / ρ 10 2 10 -1 10 1 10 /dy ch dN Yield ratios 0.4<M<1.0 /excess 1<M<1.4 excess ρ / 1<M<1.4 excess
Figure 3. Left: Excess yield ratios for peak, continuum and total vs. centrality for
the mass window 0.4<M <1 GeV. Right: same as left on a double log scale, including here also the total in the mass window 1.0<M <1.4 GeV.
linear implying, in view of the normalization to the cocktail ρ, that the absolute yield
would be quadratic in Nch.
The central NA60 results in the IMR region [17] are shown in Fig. 4. The use of the Si-vertex tracker allows to measure the offset between the muon tracks and the main interaction vertex and thereby to disentangle prompt and offset dimuons from D decays. The left panel of Fig. 4 shows the offset distribution to be perfectly consistent with no charm enhancement, expressed by a fraction of 1.0 ± 0.1 of the canonical level. The observed excess is really prompt, with an enhancement over Drell-Yan by a factor
0 1 2 3 4 5 1 10 2 10 3 10 Data 0.09 ± Prompt: 2.43 0.10 ± Charm : 1.10 /NDF: 0.8 2 χ Fit , Weighted offset ∆ NA60 In-In aMD_a_PM_Pt000_4000_Mlt_0_220 ∆ dN/d 1.2 1.4 1.6 1.8 2 2.2 2.4 3 10 4 10 5 10 2 ± 22 ± 199 193 ± 17 ± 1 171 ± 24 ± 2 (MeV) eff T Drell-Yan Open charm Excess 6500a6500aMD_6500a_PM_Pt000_250_Mlt_0_220 Mass (GeV) dN/dM, acc. corr. NA60 In-In
Figure 4. Left: Fit of the weighted offset distribution in the IMR region with the
contributions from charm and prompt decays. Right: Acceptance-corrected mass spectra of Drell-Yan, open charm and the excess (triangles).
of 2.4. The excess can now be isolated in the same way as was done in the LMR region, subtracting the measured known sources, here DY and open charm, from the total data. The right panel of Fig. 4 shows the decomposition of the total into DY, open charm
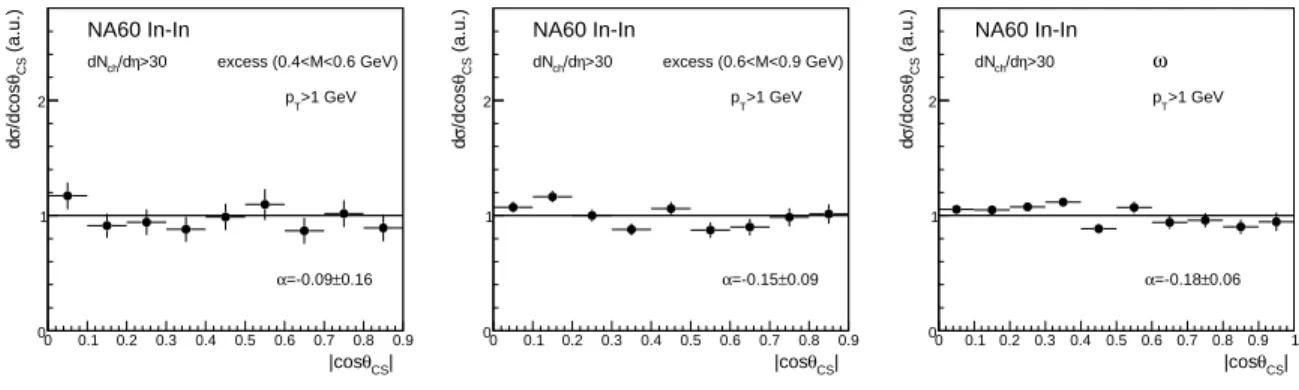
AbsCS_allnch_04mass06_ptgr1 Entries 10 Mean 0.4416 RMS 0.2606 0 0.1 0.2 0.3 0.4 0.5 0.6 0.7 0.8 0.9 0 1 2 AbsCS_allnch_04mass06_ptgr1 Entries 10 Mean 0.4416 RMS 0.2606 0.16 ± =-0.09 α | CS θ |cos excess (0.4<M<0.6 GeV) >30 η /d ch dN >1 GeV T p (a.u.) CS θ /dcos σ d NA60 In-In AbsCS_allnch_06mass09_ptgr1 Entries 10 Mean 0.439 RMS 0.2631 0 0.1 0.2 0.3 0.4 0.5 0.6 0.7 0.8 0.9 0 1 2 AbsCS_allnch_06mass09_ptgr1 Entries 10 Mean 0.439 RMS 0.2631 0.09 ± =-0.15 α | CS θ |cos excess (0.6<M<0.9 GeV) >30 η /d ch dN >1 GeV T p (a.u.) CS θ /dcos σ d NA60 In-In AbsCS_allnch_Omega_ptgr1 Entries 10 Mean 0.4854 RMS 0.2864 0 0.1 0.2 0.3 0.4 0.5 0.6 0.7 0.8 0.9 1 0 1 2 AbsCS_allnch_Omega_ptgr1 Entries 10 Mean 0.4854 RMS 0.2864 0.06 ± =-0.18 α | CS θ |cos ω >30 η /d ch dN >1 GeV T p (a.u.) CS θ /dcos σ d NA60 In-In
Figure 5. Polar angular distributions for the excess and the ω in the Collins Soper
frame. The data are fit with the expression dσ/dcosθC S= 1 + αcos2θC S.
and the prompt excess. The mass spectrum of the excess is quite similar to the shape of open charm and much steeper than DY; this explains of course why NA50 could describe the excess as enhanced open charm. The transverse momentum spectra are
also much steeper than DY. The fit temperatures of the mT spectra associated with 3
mass windows are indicated on the bottom of the figure.
The remainder of this paper is concerned with excess data fully corrected for acceptance and pair efficiencies [13, 18]. In principle, the correction requires a
4-dimensional grid in the space of M-pT-y-cosθCS (where θCS is the polar angle of the
muons in the Collins Soper frame). To avoid large statistical errors in low-acceptance
bins, it is performed instead in 2-dimensional M-pT space, using the measured y and cosθ
distributions as an input. The latter are, in turn, obtained with acceptance corrections
determined in an iterative way from MC simulations matched to the data in M and pT.
The y-distribution is found to have the same rapidity width as dNch/dη, σy ∼ 1.5 [18].
The cosθCS distributions for two mass windows of the excess and the ω are shown in
Fig. 5. Within errors, they are found to be uniform, implying the polarization of the excess dimuons to be zero, in contrast to DY and consistent with the expectations for thermal radiation from a randomized system.
The two major variables characterizing dileptons are M and pT, and the existence
of two rather than one variable as in case of real photons leads to much richer
information. Beyond (minor) contributions from the spectral function, pT encodes the
key properties of the expanding fireball, temperature and transverse (radial) flow. In contrast to hadrons, however, which receive the full asymptotic flow at the moment of decoupling, dileptons are continuously emitted during the evolution, sensing the
space-time development of temperature and flow. This makes the dilepton pT spectra sensitive
to the emission region, providing a powerful diagnostic tool [5, 19]. Fig. 6 (left) displays
the centrality-integrated invariant mT spectra, where mT = (p2T + M2)1/2, for four mass
windows; the φ is included for comparison. The ordinate is normalized to dNch/dη in
absolute terms, using the same procedure as described in detail for the φ [20] and relating
0 0.2 0.4 0.6 0.8 1 1.2 1.4 1.6 1.8 -8 10 -7 10 -6 10 -5 10 -4 10 -3 10 ) -2 ) (GeV η /d ch )/(dN T dm η /d µµ (dNT 1/m 0.2<M<0.4 GeV 0.4<M<0.6 GeV 0.6<M<0.9 GeV φ 1.0<M<1.4 GeV >30 η /d ch dN 3) × ( 6) × ( -M (GeV) T m NA60 In-In 0 0.5 1 1.5 2 2.5 -9 10 -8 10 -7 10 -6 10 -5 10 -M (GeV) T m >30 η /d ch dN NA60 In-In ) -2 ) (GeV η /d ch )/(dN T dm η /d µµ (dNT 1/m 0.6<M<0.9 GeV full region peak ρ continuum 2 MeV ± =253 eff T 6 MeV ± =295 eff T 4 MeV ± =225 eff T
Figure 6. Acceptance-corrected transverse mass spectra of the excess dimuons for 4
mass windows and the φ [13] (left), and a decomposition into peak and continuum for the ρ-like window (right, see text). The normalization in absolute terms is independent of rapidity over the region measured.For error discussion see [13].
from a peculiar rise at low mT (<0.2 GeV) for the excess spectra (not the φ) which
only disappears for very peripheral collisions [9, 13], all spectra are pure exponentials, but with a mass-dependent slope. Fig. 6 (right) shows a more detailed view into the ρ-like mass window, using the same side-window method as described in connection
with Fig. 3 to determine the pT spectra separately for the ρ peak and the underlying
continuum. All spectra are purely exponential up to the cut-off at pT=3 GeV, without
any signs of an upward bend characteristic for the onset of hard processes. Their slopes are, however, quite different (see below).
The inverse slope parameters Teff extracted from exponential fits to the mT spectra
are plotted in Fig. 7 (left) vs. dimuon mass [13], unifying the data from the LMR and IMR regions. The hadron data for η, ω and φ obtained as a by-product of the cocktail subtraction are also included, as is the single value for the ρ-peak from Fig. 6 (right). Interpreting the latter as the freeze-out ρ without in-medium effects, all four hadron
values together with preliminary π− data from NA60 can be subjected to a simple
blast-wave analysis. The results, plotted in a plane of freeze-out temperature Tf0 and
average expansion velocity hβTi, are shown in Fig. 7 (right). Dilepton and hadron data
together suggest the following consistent interpretation. Maximal flow is reached by the ρ, due to its maximal coupling to pions, while all other hadrons freeze out earlier. The
Teff values of the dilepton excess rise nearly linearly with mass up to the ρ-pole position,
but stay always well below the ρ line, exactly what would be expected for radial flow of
an in-medium hadron-like source (here π+π−→ρ) decaying continuously into dileptons.
0 0.5 1 1.5 2 2.5 100 150 200 250 300 350 (MeV) eff T M (GeV) ) φ , ω , ρ , η hadrons ( dimuons LMR LMR, w/o DY IMR, w/o DY In-In >30 η /d ch dN 0 0.1 0.2 0.3 0.4 0.5 0.6 80 100 120 140 160 180 ρ ω η φ π > β < (MeV) fo T In-In Hadron data <1.8 GeV T Fit range:0.4<p =130 (theory) fo T /dy>30 ch dN blue shift blast wave : π
Figure 7. Left: Inverse slope parameter Teff vs. dimuon mass for the combined
LMR/IMR regions of the excess in comparison to hadrons [13]. Open charm is
subtracted throughout. For error discussion see [13]. Right: Blast wave results based on the Teff values for π−, η, ρ, ω and φ (see text).
50 MeV. Extrapolating the lower-mass trend to beyond the ρ, such a fast transition to a seeming low-flow situation is extremely hard to reconcile with emission sources which continue to be of dominantly hadronic origin in this region. A more natural explanation would then be a transition to a dominantly early partonic source with processes like
q ¯q → µ+µ− for which flow has not yet built up [19]. While still controversial [21], this
may well represent the first direct evidence for thermal radiation of partonic origin, overcoming parton-hadron duality for the yield description in the mass domain.
The acceptance- and efficiency-corrected data can also be projected on the mass
axis. Fig. 8 shows a set of mass spectra for some selected slices in pT to illustrate
the evolution from low to high pT. Recent theoretical results from the three major
groups working in the field are included for comparison [19, 21, 22]. At very low pT,
a strong rise towards low masses is seen in the data, reflecting the Boltzmann factor, i.e. the Plank-like radiation associated with a very broad, nearly flat spectral function. Only the Hees/Rapp scenario [21] is able to describe this part quantitatively, due to their particularly large contribution from baryonic interactions to the low-mass tail of
the ρ spectral function. At higher pT, the influence of radial flow increasingly changes
the spectral shapes, and at very high pT, all spectra appear ρ-like. Here, only the
Renk/Ruppert results [19] seem to contain sufficient flow to describe the data.
This paper contains the most comprehensive data set on excess dileptons above the known sources which has so far become available through NA60. All observations can consistently be interpreted in terms of thermal radiation from the fireball in the whole mass region up to the J/ψ. The superior data quality and the resulting clarity of the physics messages has yet to be matched by any other dilepton experiment in the field.
0 0.2 0.4 0.6 0.8 1 1.2 1.4 -9 10 -8 10 -7 10 -6 10 Entries -683 Mean 0.4807 RMS 0.189 RR_mass_pt02 Entries 765021 Mean 0.5664 RMS 0.2044 ZD_mass_pt02 Entries 994258 Mean 0.56 RMS 0.207 <0.2 GeV T p M (GeV) -1 ) (20 MeV) η /d ch dM)/(dN η /d µµ 2 (dN RH RR ZD data NA60 In-In No centrality selection 0 0.2 0.4 0.6 0.8 1 1.2 1.4 -9 10 -8 10 -7 10 -6 10 Entries 105 Mean 0.52 RMS 0.2246 <0.6 GeV T 0.4<p M (GeV) -1 ) (20 MeV) η /d ch dM)/(dN η /d µµ 2 (dN RH RR ZD data NA60 In-In No centrality selection 0 0.2 0.4 0.6 0.8 1 1.2 1.4 -9 10 -8 10 -7 10 -6 10 1.6<pT<1.8 GeV M (GeV) -1 ) (20 MeV) η /d ch dM)/(dN η /d µµ 2 (dN RH RR ZD data NA60 In-In No centrality selection 0 0.2 0.4 0.6 0.8 1 1.2 1.4 -9 10 -8 10 -7 10 -6 10 Mass_AccCorr_AllNch_02pt04 Entries -983 Mean 0.431 RMS 0.2064 <0.4 GeV T 0.2<p M (GeV) -1 ) (20 MeV) η /d ch dM)/(dN η /d µµ 2 (dN RH RR ZD data NA60 In-In No centrality selection 0 0.2 0.4 0.6 0.8 1 1.2 1.4 -9 10 -8 10 -7 10 -6 10 Mass_AccCorr_AllNch_06pt08 Entries -1285 Mean 0.5801 RMS 0.2327 <0.8 GeV T 0.6<p M (GeV) -1 ) (20 MeV) η /d ch dM)/(dN η /d µµ 2 (dN RH RR ZD data NA60 In-In No centrality selection 0 0.2 0.4 0.6 0.8 1 1.2 1.4 -9 10 -8 10 -7 10 -6 10 1.8<pT<2.0 GeV M (GeV) -1 ) (20 MeV) η /d ch dM)/(dN η /d µµ 2 (dN RH RR ZD data NA60 In-In No centrality selection
Figure 8. Acceptance-corrected mass spectra of the excess dimuons in selected slices
of pT. Absolute normalization as in Fig. 6.
References
[1] Pisarski R D, 1982 Phys. Lett. 110B 155
[2] Rapp R and Wambach J, 2000 Adv. Nucl. Phys. 25 1 [3] Brown G E and Rho M , 2002 Phys. Rept. 363 85 [4] McLerran L D and Toimela T, 1985 Phys. Rev. D 31 545
[5] Kajantie K, Kataja M, McLerran L D and Ruuskanen P V, 1986 Phys. Rev. D 34 811 [6] G. Agakichiev et al (CERES Collaboration), 2005 Eur. Phys. J. C41 475 and earlier ref. [7] Abreu M C et al (NA38/NA50 Collaboration), 2002 Nucl. Phys. A 698 539 and earlier ref. [8] Angelis A L S et al (HELIOS-3 Collaboration), 2000 Eur. Phys. J. C 13 433 and earlier ref. [9] Specht H J, 2008 Nucl. Phys. A 805 338, arXiv:0710.5433 [nucl-ex]
[10] Adamova D et al (CERES Collaboration), 2006 arXiv:nucl-ex/0611022. [11] Usai G et al (NA60 Collaboration), 2005 Eur. Phys. J. C43 415
[12] Arnaldi R et al (NA60 Collaboration), 2008 Phys. Rev. Lett. 100 022302 [13] Arnaldi R et al (NA60 Collaboration), 2008 Phys. Rev. Lett. 96 162302 [14] Damjanovic S et al (NA60 Collaboration), 2007 Eur. Phys. J. C 49 235 [15] Rapp R, 2003, private communication
[16] Harada M and Sasaki C, 2007 Int. J. Mod. Phys. E 16 2143, arXiv:hep-ph/0702205 [17] Shahoyan R et al (NA60 Collaboration), 2006 J. Phys. G 34 S1029
[18] Damjanovic S et al (NA60 Collaboration), 2007 Nucl. Phys. A 783 327
[19] Ruppert J, Gale C, Renk T, Lichard P and Kapusta J I, 2008 Phys. Rev. Lett. 100 162301; Renk T and Ruppert J, 2008 Phys. Rev. C 77 024907
[20] Floris M et al (NA60 Collaboration), these proceedings
[21] van Hees H and Rapp R, 2006 Phys. Rev. Lett. 97 102301 (2006); van Hees H and Rapp R, arXiv:0711.3444 [hep-ph] and earlier ref.; van Hees H, these proceedings
![Figure 1. Excess dileptons seen in previous SPS experiments by CERES [10] (LMR, left) and NA50 [7] (IMR, right)](https://thumb-eu.123doks.com/thumbv2/123doknet/14018489.457153/2.918.183.707.139.393/figure-excess-dileptons-seen-previous-experiments-ceres-right.webp)

![Figure 6. Acceptance-corrected transverse mass spectra of the excess dimuons for 4 mass windows and the φ [13] (left), and a decomposition into peak and continuum for the ρ-like window (right, see text)](https://thumb-eu.123doks.com/thumbv2/123doknet/14018489.457153/6.918.156.721.149.445/figure-acceptance-corrected-transverse-spectra-dimuons-decomposition-continuum.webp)
![Figure 7. Left: Inverse slope parameter T eff vs. dimuon mass for the combined LMR/IMR regions of the excess in comparison to hadrons [13]](https://thumb-eu.123doks.com/thumbv2/123doknet/14018489.457153/7.918.159.729.141.411/figure-inverse-parameter-dimuon-combined-regions-comparison-hadrons.webp)

