HAL Id: hal-00318427
https://hal.archives-ouvertes.fr/hal-00318427
Submitted on 2 Jan 2008
HAL is a multi-disciplinary open access
archive for the deposit and dissemination of
sci-entific research documents, whether they are
pub-lished or not. The documents may come from
teaching and research institutions in France or
abroad, or from public or private research centers.
L’archive ouverte pluridisciplinaire HAL, est
destinée au dépôt et à la diffusion de documents
scientifiques de niveau recherche, publiés ou non,
émanant des établissements d’enseignement et de
recherche français ou étrangers, des laboratoires
publics ou privés.
Energetic particles observed by ISEE-1 and ISEE-2 in a
cusp diamagnetic cavity on 29 September 1978
B. M. Walsh, T. A. Fritz, N. M. Lender, Jie Chen, K. E. Whitaker
To cite this version:
B. M. Walsh, T. A. Fritz, N. M. Lender, Jie Chen, K. E. Whitaker. Energetic particles observed
by ISEE-1 and ISEE-2 in a cusp diamagnetic cavity on 29 September 1978. Annales Geophysicae,
European Geosciences Union, 2008, 25 (12), pp.2633-2640. �hal-00318427�
www.ann-geophys.net/25/2633/2007/ © European Geosciences Union 2007
Annales
Geophysicae
Energetic particles observed by ISEE-1 and ISEE-2 in a cusp
diamagnetic cavity on 29 September 1978
B. M. Walsh1, T. A. Fritz1, N. M. Lender1, J. Chen1, and K. E. Whitaker1* 1Center for Space Physics, Boston University, Boston, Massachusetts, USA
*now at: Department of Astronomy, Yale University, New Haven, Connecticut, USA
Received: 27 July 2007 – Revised: 22 November 2007 – Accepted: 23 November 2007 – Published: 2 January 2008
Abstract. Observations by the ISEE-1 and ISEE-2
space-craft on 29 September 1978 show large CEP (Cusp Ener-getic Particle) fluxes while passing through the dayside mag-netospheric cusp in near coincident orbits. The event was observed around 11:00 MLT between roughly 12:30 and 13:00 UT by ISEE-1 and 12:00 and 13:00 UT by ISEE-2. During these periods, both electron and ion fluxes increased by more than two orders of magnitude, with the electron flux showing a strong peak at a pitch angle of 90◦. The solar wind
was ∼710 km s−1and the Dst was ∼-200 nT, suggesting the
occurrence of a strong geomagnetic storm. The ISEE-1 and ISEE-2 observations, however, show no time-energy disper-sion of the CEPs, leading us to believe that these particles could not be the result of substorm processes in the magne-totail. The local magnetic field was depressed and extremely turbulent. Changes in the magnitude of the magnetic field anticorrelate closely to variations of the electron flux. The observations in electron flux peaking at 90◦and the close
an-ticorrelation between the local magnetic field strength and electron flux are unique and provide evidence of a potential local source for these energetic particles.
Keywords. Magnetospheric physics (Energetic particles,
precipitating; Magnetopause, cusp and boundary layers; Magnetospheric configuration and dynamics)
1 Introduction
Observations from a number of spacecraft have shown the presence of energetic particles in the magnetospheric cusp (Shelly et al., 1976; Kremser et al., 1995; Chen et al., 1997; Pfaff et al., 1998; Savin et al., 2002); however, their source remains a matter of scientific discussion and debate. The po-lar cusp region, where these particles are observed, is iden-Correspondence to: B. M. Walsh
tified by a minimum local magnetic field (Ferrell and Van Allen, 1990) and an increased magnetosheath plasma (Frank, 1971).
Cusp Energetic Particle (CEP) events are characterized by a decreased and turbulent local magnetic field, as well as in-creased energetic particle flux (Chen et al., 1997, 1998; Fritz et al., 1999). During these events, electrons show large flux enhancements for 100 eV particles and more subtle flux en-hancements up to 200 keV. Ions show a similar increase in flux. Just as with electrons, lower ion energies show larger flux enhancements than higher energies (e.g. Whitaker et al., 2006). Niehof et al. (2005) have used POLAR observa-tions to study the plasma composition and pressure around these CEP events associated with a Cusp Diamagnetic Cav-ity (CDC). Within the CDC there is a strong anticorrelation between magnetic field strength and plasma pressure.
The International Sun-Earth Explorer-1 (ISEE-1) and ISEE-2 were launched 22 October 1977. The two traveled close together while following the same highly eccentric or-bit (1×23RE), with a period of ∼57 h and an inclination of
28.76◦(Ogilvie et al., 1977). The spacecraft were meant to
be complimentary to each other, both taking similar measure-ments for the Medium Energy Particle Experiment (MEPE). Although both spacecraft measure angular, energy and inten-sity distributions of particles, they use different instruments, with the experiments on ISEE-1 and ISEE-2 being known as WIM and KED, respectively (Williams et al., 1978).
Due to the low inclination of the orbit, it was thought that these spacecraft would never pass through the magne-tospheric cusp. In addition to the event studied in this pa-per, there have been two other reports on the occurrance of such an ISEE pass through the cusp occurring (Phillips et al., 1993; Whitaker et al., 2006, 2007).
The clock angle is defined as the angle whose tangent is the y-component divided by the z-component of the mag-netic field. Since the clock angle remains unchanged through the bow shock (Jackson, 1975), the IMF clock angle and the
2634 B. M. Walsh et al.: 29 September 1978 CEP EVENT
Fig. 1. The orbital projections of ISEE-1 and ISEE-2 around the
event are shown in GSM. The first star indicates when each space-craft starts to observe the CEPs, and the second star indicates when the spacecraft no longer observes the CEPs.
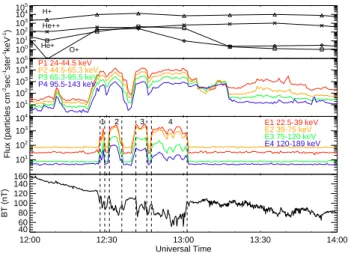
100 101 102 103 104 105 H+ He++ O+ He+ 101 102 103 104 105 P1 24-44.5 keV P2 44.5-65.3 keV P3 65.3-95.5 keV P4 95.5-143 keV 101 102 103 104 Flux (particles cm -2sec -1ster -1keV -1) E1 22.5-39 keV E2 39-75 keV E3 75-120 keV E4 120-189 keV 1 2 3 4 12:00 12:30 13:00 13:30 14:00 Universal Time 40 60 80 100 120 140 160 BT (nT)
Fig. 2. ISEE-1 Plasma Experiment data (40 eV–17.36 keV), where
triangles, X’s, open squares, and diamonds correspond to H+, He++, He+, and O+ ions respectively (top or first panel). The time resolution for the plasma data is 18 minutes. The second and third panels contain the proton and electron fluxes respectively, in-tegrated over all PA for four energy channels measured by ISEE-1. The proton and electron flux are presented with a time resolution of 36 s. Panel four shows the total local magnetic field strength. The local magnetic field strength is displayed with 4 second resolution. The four zones of increased flux are marked with vertical dotted lines and labeled sequentially in panels three and four.
local clock angle should be well correlated within the mag-netosheath. This correlation is used as a probe to determine whether ISEE-1 and ISEE-2 have crossed the magnetopause into the magnetosheath.
2 Observations
On 29 September 1978, ISEE-1 passed through the high-altitude magnetospheric cusp between roughly 12:30 and 13:00 UT. The spacecraft crossed through X=5.78−6.73
RE, Y =−(1.57−1.54) RE, Z=4.90−5.19 RE in GSM in an
outbound pass during this event. ISEE-2 traveled roughly 20 min in front of ISEE-1 over essentially the same path. The paths of both spacecraft are shown in Fig. 1. ISEE-2 observed the event at 12:00–13:00 UT while passing through
X=5.42−7.21 RE, Y =−(1.55−1.48) RE, Z=4.81−5.35 RE
in GSM.
2.1 ISEE-1 MEPE experiment
The ISEE-1 spacecraft observed flux enhancements of two orders of magnitude for both the electrons and ions (primar-ily protons) with the MEPE instrument. The second and third panels from the top of Fig. 2, respectively, show proton and electron flux enhancements. Electrons in the lowest energy band (22.5–39 keV) increase from about 30 to 2500 parti-cles cm−2 s−1 ster−1 keV−1. Similar enhancements were
observed for each of the other energy channels, however, the magnitude of the flux enhancements decreases with increas-ing energy. There was no clear time-energy dispersion seen through the energy channels.
The zones labeled 1–4 in Fig. 2 have been defined by inte-grating the electron flux over all energy channels and finding the mean value during a quiet period outside the event. When the total energy flux is three sigma above the mean total flux, a zone of increased flux is defined. The zones 1–4 are defined at 12:28–12:30 UT, 12:32–12:36 UT, 12:42–12:46 UT, and 12:48–13:02 UT respectively. These zones of enhanced flux anticorrelate very closely to the drop in the local magnetic field strength (third and fourth panels from top of Fig. 2). This anticorrelation is consistent with what was reported by Niehof et al. (2005). The protons observed during this event show some variation with the local magnetic field strength, but do not display such a clear anticorrelation as that seen in the electrons.
Within the CDC, ions of both ionospheric and solar wind origin are present. ISEE-1 Plasma Composition Experiment data for this event, provided by O. W. Lennartsson, show the presence of ionospheric (O+ and He+) and solar wind (H+ and He++) ions, energized up to 17 keV, the maximum en-ergy band for the experiment. Outside the CDC, ISEE-1 ob-serves very low ionospheric ion flux, while solar wind ion flux remains steady both outside and within the CDC (top panel of Fig. 2).
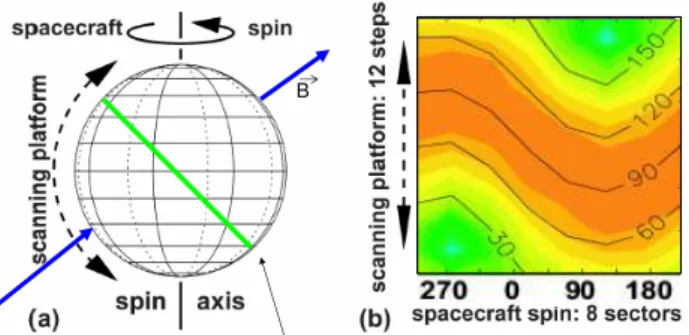
The ISEE-1 MEPE instrument provides an opportunity to observe pitch angle (PA) distributions of the electron flux with high angular resolution. Figure 3 shows the rotation of the spacecraft and the scanning of the instrument’s “look direction” to cover all 4π steradians of a solid angle. Three-dimensional electron flux for the first energy channel (22.5–
39.0 keV) is shown with pitch angles superimposed for the full event in Figs. 4–7. Each panel represents measurements over 36 s and 12 spins of the spacecraft. The vertical axis of the panels in Figs. 4–7 is the scan direction, where 0◦is
anti-parallel to the spacecraft spin axis, viewing the south ecliptic pole, and 180◦is parallel to the spin axis viewing the north
ecliptic pole. The scale on the horizontal axis has the sun-ward direction at 0◦
(GSE X) and 90◦
(GSE Y ). Instances where the electron flux stopped abruptly during a 36-s scan can be seen by the increased flux ending along a horizontal strip. The authors believe that the abrupt change in flux is a result of a boundary crossing rather than an azimuthal asym-metry of the parent PA distribution.
At 12:28 UT, as ISEE-1 entered the CDC, the flux in-creased primarily for electrons with a PA of 90◦ (Fig. 4).
Although the primary flux increase was around 90◦, the
en-hancement extended out close to 30◦in each direction from
a PA of 60◦ to 120◦. This flux enhancement near a PA of
90◦ continued to dominate as ISEE-1 traveled through the
CDC. One strong deviation from this trend occurred near the end of the event at 13:00:44–13:01:57 UT, in the three bot-tom left panels of Fig. 7. During this period, the population of trapped electrons with a peak flux of 90◦remained, but
an additional electron population streaming from below the spacecraft was observed. The PA of this second flowing pop-ulation ranged from 180◦to close to 90◦, implying a source
of these electrons below (earthward) the satellite.
The proton distribution exhibited both the trapped and upward-flowing populations during the entire event (Fig. 8), and not just at the very end, as for the electrons. The pro-ton flux of the 90◦ population for the first energy channel
(22.5–39.0 keV) peaks close to 104cm−2s−1ster−1keV−1,
which was similar to, but slightly above, the flux of the pro-ton population below the spacecraft at a PA of 165◦. Figure 8
shows enhanced proton and electron flux for the lowest en-ergy channel, as well as the highest channel that displays sig-nificant flux. The energy channels between those displayed in Fig. 8 show similar enhanced flux and PA distributions. Proton observations of a similar event on 30 October 1978 agree with this result, showing an increased flux with PA of 180◦to 90◦for close to 2 h (Whitaker et al., 2006, 2007).
2.2 ISEE-2 MEPE experiment
The ISEE-2 flux observations confirm the trends observed by ISEE-1. As ISEE-2 entered the region of decreased local magnetic field strength at 12:01 UT, both the electron and proton flux increased significantly. Electrons with energies 28–38 keV increase from about 80 to 1000 particles cm−2
s−1 ster−1 keV−1. The anticorrelation between the
elec-tron flux and the magnetic field strength was again apparent. Using the same method described previously in Sect. 2.1, five zones were defined for the ISEE-2 observations (Fig. 9). Zones 1-5 are defined at 12:01–12:18 UT, 12:23–12:32 UT, 12:34–12:42 UT, 12:46–12:51 UT, and 12:54–12:57 UT,
re-Locus of α = 90° pitch angles
B
Fig. 3. This figure shows how to interpret Figs. 4-7. The entire unit
sphere (left) is scanned through every 36 s and the fluxes are linearly translated onto the orthogonal Cartesian coordinate sphere (right). The blue arrow (left) indicates the direction of the magnetic field vector and the green line (left) is the location of 90◦PA particles (from Whitaker et al., 2007).
spectively. Between each of these zones, the local magnetic field in the bottom panel of Fig. 9 increased to close to the non-event level.
The PA distributions observed by ISEE-2 were similar to those of ISEE-1. The electron flux showed a strong peak at 90◦throughout the event, with little flux observed from 15◦
or above the spacecraft (panels three and four, Fig. 10). The proton flux also showed a strong peak at 90◦and little flux
streaming from a PA of 15◦. The orientation of ISEE-2
dur-ing this event is such that there is poor sampldur-ing at high PA. Although there are only a few data points available, the ob-servations of particles at a PA of 165◦(streaming from below
the spacecraft) show a strong increase in proton flux (panels one and two, Fig. 10) up to 142–210 keV. This is consistent with the observations of ISEE-1.
2.3 Solar wind
The ISEE-3 spacecraft was located near the sunward libation point at X=212.42 RE, Y =−100.72 RE, Z=11.92 REin GSE
during the event. It provided upstream information about the IMF and solar wind for this event. The solar wind was fast and turbulent, ranging between 820 km s−1and 780 km s−1.
The density of the solar wind was low, however, and the dy-namic pressure ranges from 1–3 nPa during the event, be-tween 12:00–13:00 UT. The IMF was decreasing from 24 nT to 16 nT. The IMF components showed a variable and nega-tive Bx(antisunward), with a magnitude from 0 nT to −4 nT;
duskward By decreased from 18 nT to 14 nT and southward
Bz increasing from −15 nT to −5 nT, as shown in Fig. 11.
These conditions are propagated with a time delay (∼27 min) to the ISEE-1 and ISEE-2 locations, close to 200 RE
down-stream. Additional upstream data from IMP-8 confirm the results from ISEE-3 during this event. IMP-8 was located at
2636 B. M. Walsh et al.: 29 September 1978 CEP EVENT
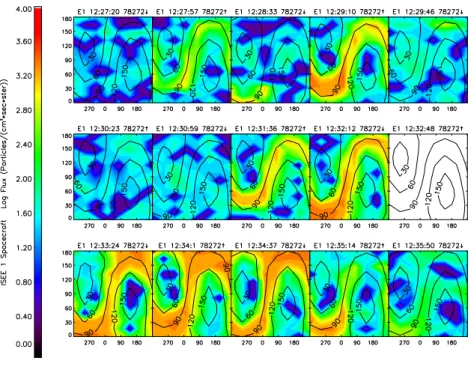
Fig. 4. ISEE-1 MEPE 3-D pitch angle distributions of electron flux (22.5–39.0 keV) as the spacecraft enters the CDC. The figure spans the
time period 12:27:20–12:35:50 UT. As the spacecraft enters the CDC, the flux shows a clear peak at a PA of 90◦. Zone 1, as defined in Sect. 2.1, is shown in the third and fourth panels from the left on the top row. Zone 2 begins in the middle panel on the second row and continues into Fig. 5.
Fig. 5. Electron flux presented similar to Fig. 4, but for the time period 12:36:27–12:44:57 UT. Zone 2 started on the previous figure and
ends in the first panel on the top row. Panels 2–8 (12:37:03–12:40:42 UT) show little flux and correspond to the region of increased magnetic field strength between zones 2 and 3, also seen in Fig. 3. The increased flux in the last panel on the second row is the start of zone 3 which continues into Fig. 6.
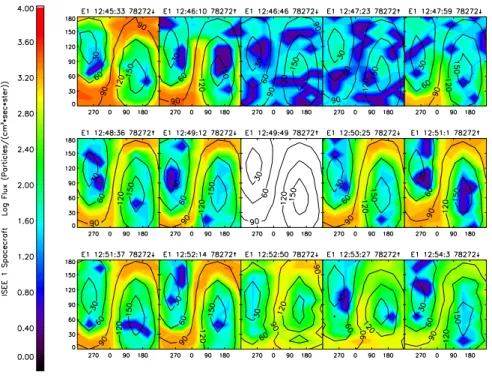
Fig. 6. Electron flux presented similar to Fig. 4, but for the time period 12:45:33–12:54:03 UT. Zone 3, which began on the previous figure
ends during the second panel on the top row. Panels 3–5 (12:46:46–12:47:59 UT) then correspond to the region of increased magnetic field strength between zones 3 and 4. Zone 4 starts in the last panel of the first row and then continues into Fig. 7.
Fig. 7. Electron flux presented similar to Fig. 4, but for the time period 12:54:40–13:03:10 UT. The three panels on the left side of the bottom
row show a region where electrons are flowing from beneath the spacecraft just before it leaves the CDC. The third panel in this row is the end of zone 4.
2638 B. M. Walsh et al.: 29 September 1978 CEP EVENT 101 102 103 104 105 100 101 102 103 101 102 103 104 1 101 102 103 12:00 12:30 13:00 13:30 14:00 Universal Time 60 80 100 120 140 BT (nT) PA 165 PA 90 PA 15 P1 P6 E1 E4 Flux (particles cm -2sec -1ster -1keV -1)
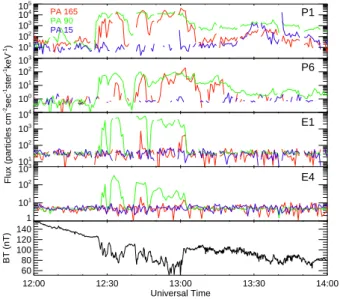
Fig. 8. The top four panels are proton and electron flux broken
into PA (15◦, 90◦, 165◦), as measured by ISEE-1. The top two are proton flux at the lowest energy channel (P1, 22.5–39.0 keV) and then the highest channel that shows a substantial increase in flux (P6, 210.0–333.0 keV). The third and fourth panels from the top are electron flux in the lowest energy channel (E1, 22.5–39.0 keV) and the highest channel to show a substantial flux increase (E4, 120– 189 keV). The pitch angles are shown ±15◦. The bottom panel is the strength of the local magnetic field measured by ISEE-1.
101 102 103 104 105 100 101 102 103 E1 28-38 keV E2 38-48 keV E3 48-62 keV E4 62-80 keV P1 28-38 keV P2 38-80 keV P3 80-134 keV P4 134-174 keV 1 2 3 4 5 Flux (particles cm -2sec -1ster -1keV -1) 11:30 12:00 12:30 13:00 13:30 Universal Time 60 80 100 120 140 160 BT (nT)
Fig. 9. The top and middle panels contain the proton and electron
flux, respectively, for four energy channels summed over all PA, as measured by ISEE-2. The five zones of increased electron flux are marked with vertical dotted lines and labeled. The bottom panel shows the total local magnetic field strength.
X=0.95−4.75 RE, Y =27.81−26.91 RE, Z=−(15.23−18.25)
RE. It also showed the Bx, By and Bz components of the
IMF to be negative, positive and negative, respectively, with similar magnitudes as measured by ISEE-3 (Fig. 11).
The clock angle measured from ISEE-3 is used to probe the location of ISEE-1 and ISEE-2 with respect to the mag-netopause. The clock angle is conserved through the bow shock, therefore the IMF clock angle should correlate with the local clock angle within the magnetosheath. Figure 12 shows the clock angles of ISEE-1, ISEE-2, and ISEE-3 de-layed 27 min. First ISEE-2, then ISEE-1 can be seen on an outbound pass crossing the magnetopause into the magne-tosheath, as their clock angles become correlated with that of ISEE-3. The crossing points identified from the clock angle probing technique are consistent with the magnetopause lo-cations found through the Shue et al. (1997) magnetopause model (bottom panel of Fig. 12).
3 Discussion
During the period surrounding the observed event, between 10:00 and 15:00 UT, the Dst index was between −186 and
−205 nT, showing a major magnetic storm; the average AE index was 342 nT with a peak of 606 nT at 12:00 UT, which may indicate the presence of substorms. The occurrence of a substorm is consistent with the proposed idea that CEPs result from substorm processes in the magnetotail (Delcourt et al., 1999; Blake et al., 1999; Antonova et al., 2000). The CEPs observed by ISEE-1 and ISEE-2 in this event, however, show no time-energy dispersion, as would be expected from energetic particles injected into the nightside magnetosphere and subsequently drifting to the dayside. The absence of a time-energy dispersion in Fig. 2 or Fig. 9 indicates that these particles can not be the result of the substorm processes.
The CEPs from both ISEE-1 and ISEE-2 show a strong anticorrelation of the electron flux with the local magnetic field strength shown by the zones of enhanced flux in Fig. 2 and Fig. 9. This anticorrelation is unexpected through the conservation of the first adiabatic invariant and indicates the presence of a local source. The absence of a time-energy dis-persion is also consistent with a local source for the CEPs. The CEP flux enhancements are observed to occur over a large energy range, requiring the source to be capable of cre-ating CEPs up to 0.3 MeV protons and 0.2 MeV electrons.
Figures 4–7 show that the electron flux enhancements are primarily at 90◦as ISEE-1 traveled through this region. From
13:01–13:02 UT the flux deviates from this trend and was observed at an increased level from a PA of 180◦to almost
60◦. The velocity of these electrons is a large fraction of
c, the speed of light. With a PA close to 180◦, these
parti-cles will leave the magnetosphere in a fraction of a second. In spite of this, they are observed to maintain this distribu-tion for more than 100 s, implying an active source of these particles below the ISEE satellites. The strong presence of electron flux streaming from below ISEE-1 is also seen with protons during this event, as well as the 30 October 1978 event (Whitaker et al., 2006), and is consistent with a local source at this location.
103 104 105 100 101 102 103 104 105 101 102 103 101 102 103 11:30 12:00 12:30 13:00 13:30 Universal Time 60 80 100 120 140 160 BT (nT) P1 P5 E1 E4 PA 165 PA 90 PA 15 Flux (particles cm -2sec -1ster -1keV -1)
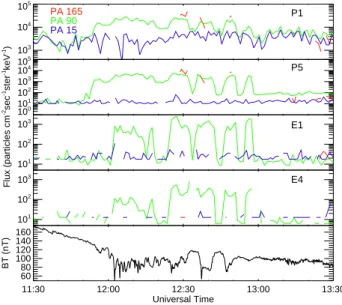
Fig. 10. The top four panels are proton and electron flux broken
into PA (15◦, 90◦, 165◦), as measured by ISEE-2. The top two panels are proton flux at the lowest energy channel (P1, 28–38 keV) and the highest energy channel to show significant flux increase (P5, 174–225 keV). The third and fourth panels from the top are electron flux in the lowest energy channel (E1, 28–38 keV) and the highest channel to show a substantial flux increase (E4, 62–80 keV). The bottom panel is the local magnetic field strength measured by ISEE-2. 790 800 810 820 Speed (km s -1) 1 2 3 4 5
Dynamic Pressure (nPa)
-30 -20 -10 Bz (nT) 15 20 25 30 By (nT) -15 -10-5 0 Bx (nT) 11:00 12:00 13:00 14:00 Universal Time 15 25 35 45 BT (nT) ISEE-3 (Time-Delayed) IMP-8
Fig. 11. IMF and solar wind observations from ISEE-3 and
IMP-8 on 29 September 197IMP-8 in GSE. The observations from ISEE-3 and IMP-8 have a time resolution of 2 and 1 min, respectively. The data from ISEE-3 are delayed 27 min, to account for the distance between the spacecraft. IMP-8 does not have solar wind speed data for this period, while the data points for ISEE-3 are due to data gaps (first and second panel from the top).
80 100 120 140 160
Clock Angle (deg)
ISEE-1 Clock Angle ISEE-2 Clock Angle
ISEE-3 Clock Angle (Time-Delayed)
11:00 12:00 13:00 14:00 15:00 Universal Time -2 0 2 4 6 Distance to Magnetopause (R E ) ISEE-1 ISEE-2
Fig. 12. The top panel contains the clock angle measured by
ISEE-1, ISEE-2, and ISEE-3 with a 27-min delay. The clock angles for ISEE-1 and ISEE-2 are presented with 4-s resolution, while that of ISEE-3 has a resolution of 2 min. The bottom panel contains the distance between each spacecraft and the magnetopause using the Shue et al. (1997) model. When the distance to the magnetopause (shown on the y-axis of the bottom panel) becomes negative, the spacecraft has passed into the magnetosheath.
4 Conclusions
On 29 September 1978, while traveling through the high-altitude dayside magnetospheric cusp, both ISEE-1 and ISEE-2 observed a region of depressed and turbulent mag-netic field intensity anticorrelating with CEP fluxes. The observed electron flux was enhanced by over two orders of magnitude primarily at a PA of 90◦. The strong
anticorrela-tion and primary electron flux at PA of 90◦are unique
obser-vations presented in this paper. The event occurred for over an hour of time while the spacecraft passed through X=6.3
RE, Y =−1.5 RE, Z=5.0 RE in GSM. Although Dst
obser-vations indicate strong geomagnetic activity, no time-energy dispersion for the CEPs was observed, implying that they could not be a result of substorm processes in the magneto-tail. The strong CEP-magnetic field anticorrelation observed by both spacecraft and the electron flux streaming from be-low ISEE-1 indicate a probable local source.
Acknowledgements. We gratefully acknowledge use of the ISEE-1
and -2 magnetic field data (C. Russell: PI) and data provided by O. W. Lennartsson from the Plasma Composition Experiment. This research was supported in part by NASA grants NNG05GD23G and NNG05GE90G.
Topical Editor I. A. Daglis thanks P. Daly and another anony-mous referee for their help in evaluating this paper.
2640 B. M. Walsh et al.: 29 September 1978 CEP EVENT
References
Antonova, A. E., Gubar, Yu. I., and Kropotlin, A. P.: Energetic Par-ticle Population in the High-Latitude Geomagnetosphere, Phys. Chem. Earth (C), 25(1–2), 47–50, 2000.
Blake, J. B.: Comment on Cusp: A new Acceleration Region of the Magnetosphere’ by Jiasheng Chen et al., Czech, J. Phys., 49(4a), 675–677, 1999.
Chen, J., Fritz, T. A., Sheldon, R. B., Spence, H. E., and Spjeldvik, W. N.: A new, temporarily confined population in the polar cap during the August 27, 1996 geomagnetic field distortion period, Geophys. Res. Lett., 24, 1447–1450, 1997.
Chen, J., Fritz, T. A., Sheldon, R. B., Spence, H. E., Spjeldvik, W. N., Fennell, J. F., Livi, S., Russell, C. T., Pickett, J. S., and Gurnett, D. A.: Cusp energetic particle events: Implications for a major acceleration region of the magnetosphere, J. Geophys. Res., 103(A1), 69–78, 1998.
Delcourt, D. C. and Sauvaud, J.-A.: Populating of the cusp and boundary layers by energetic (hundreds of keV) equatorial parti-cles, J. Geophys. Res., 104(A10), 22 635–22 648, 1999. Ferrell, W. M. and Van Allen, J. A.: Observations of the Earth’s
Polar Cleft at L arge Radial Distances With the Hawkeye 1 Mag-netometer, J. Geophys. Res., 95, 20 945–20 958, 1990.
Frank, L. A.: Plasma in the earth’s polar magnetosphere, J. Geo-phys. Res., 76, 5202–5219, 1971.
Fritz, T. A., Chen, J., Sheldon, R. B., Spence, H. E., Fennell, J. F., Livim S., Russell, C. T., and Pickett, J. S.: Cusp Energetic Particle Events Measured by POLAR Spacecraft, Phys. Chem. Earth (C), 24, 135–140, 1999.
Jackson, J. D.: Classical Electrodynamics, John Wiley and Sons Inc., New York, 1975.
Kremser, G., Woch, J., Mursula, K., Tanskanen, P., Wilken, B., and Lundin, R.: Origin of energetic ions in the polar cusp inferred from ion composition measurements by the Viking satellite, Ann. Geophys., 13, 595–607, 1995,
http://www.ann-geophys.net/13/595/1995/.
Niehof, J. T., Fritz, T. A., Friedal, R. H., and Chen, J.: Structure of Cusp Diamagnetic Cavities, Eos Trans. AGU, 86(18), Jt. Assem. Suppl., JA414, 2005.
Ogilvie, K. W., von Rosenvinge T., and Durney, A. C.: International Sun-Earth Explorer: a three-spacecraft program, Science, 198, 131–138, 1977.
Pfaff, R., Clemmons, J., Carlson, C., Ergun, R., McFadden, J., Mozer, F., Temerin, M., Klumpar, D., Peterson, W., Shelly, E., Moebius, E., Kistler, L., Strangeway, R., Eliphic, and R., Cat-tell, C.: Initial FAST observations of acceleration processes in the cusp, Geophys. Res. Lett., 25, 2037–2040, 1998.
Phillips, J. L., Bame, S. J., Elphic, R. C., Gosling, J. T., and Thom-sen, M. F.: Well-Resolved Observations by ISEE 2 of Ion Disper-sion in the Magnetospheric Cusp, J. Geophys. Res., 98, 13 429– 13 440, 1993.
Savin, S., Buchner, J., Consolini, G., Nikutowski, B., Zelenyi, L., Amata, E., Auster, H. U., Blecki, J., Dubinin, E., Fornacon, K. H., Kawano, H., Klimov, S., Marcucci, F., Nemecek, Z., Peder-son, A., Rauch, J. L., Romanov, S., Safrankova, J., Sauvaud, J. A., Skalsky, A., Song, P., and Yermalaev, Yu.: On the properties of the turbulent boundary layer over polar cusps, Nonlin. Pro-cesses Geophys., 9, 443–451, 2002,
http://www.nonlin-processes-geophys.net/9/443/2002/.
Shelly, E. G., Sharp, R. D., and Johnson, R. G.: Satellite observa-tions of an ionospheric acceleration mechanism, Geophys. Res. Lett., 3, 654–656, 1976.
Shue, J. H., Chao, J. K., Fu, H. C., Russell, C. T., Song, P., Khurana, K. K., and Singer H. J.: A new functional form to study the solar wind control of the magnetopause size and shape, J. Geophys. Res., 102(A5), 9497–9511, 1997.
Whitaker, K. E., Chen, J., and Fritz, T. A.: CEP popula-tion observed by ISEE 1, Geophys. Res. Lett., 33, L23105, doi:10.1029/2006GL027731, 2006.
Whitaker K. E., Fritz, T. A., Chen, J., and Klida, M.: Energetic particles sounding of the cusp with ISEE-1, Ann. Geophys., 25, 1175–1182, 2007,
http://www.ann-geophys.net/25/1175/2007/.
Williams, D. J., Keppler, E., Fritz, T. A., Wilken, B., and Wibberenz G.: The ISEE 1 and 2 Medium Energy Particles Experiment, IEEE trans. Geosc. Electron., 16, 270–280, 1978.