HAL Id: hal-00798059
https://hal.archives-ouvertes.fr/hal-00798059
Submitted on 24 Aug 2020
HAL is a multi-disciplinary open access
archive for the deposit and dissemination of
sci-entific research documents, whether they are
pub-lished or not. The documents may come from
teaching and research institutions in France or
abroad, or from public or private research centers.
L’archive ouverte pluridisciplinaire HAL, est
destinée au dépôt et à la diffusion de documents
scientifiques de niveau recherche, publiés ou non,
émanant des établissements d’enseignement et de
recherche français ou étrangers, des laboratoires
publics ou privés.
preferential fissure flow in a slow-moving landslide
D.M. Krzeminska, T.A Bogaard, Jean-Philippe Malet, L.P.H. van Beek
To cite this version:
D.M. Krzeminska, T.A Bogaard, Jean-Philippe Malet, L.P.H. van Beek. A model of hydrological and
mechanical feedbacks of preferential fissure flow in a slow-moving landslide. Hydrology and Earth
System Sciences, European Geosciences Union, 2013, 17, pp.947-959. �10.5194/hess-17-947-2013�.
�hal-00798059�
Hydrol. Earth Syst. Sci., 17, 947–959, 2013 www.hydrol-earth-syst-sci.net/17/947/2013/ doi:10.5194/hess-17-947-2013
© Author(s) 2013. CC Attribution 3.0 License.
EGU Journal Logos (RGB)
Advances in
Geosciences
Open Access
Natural Hazards
and Earth System
Sciences
Open AccessAnnales
Geophysicae
Open AccessNonlinear Processes
in Geophysics
Open AccessAtmospheric
Chemistry
and Physics
Open AccessAtmospheric
Chemistry
and Physics
Open Access DiscussionsAtmospheric
Measurement
Techniques
Open AccessAtmospheric
Measurement
Techniques
Open Access DiscussionsBiogeosciences
Open Access Open Access
Biogeosciences
Discussions
Climate
of the Past
Open Access Open Access
Climate
of the Past
Discussions
Earth System
Dynamics
Open Access Open Access
Earth System
Dynamics
DiscussionsGeoscientific
Instrumentation
Methods and
Data Systems
Open Access
Geoscientific
Instrumentation
Methods and
Data Systems
Open Access DiscussionsGeoscientific
Model Development
Open Access Open Access
Geoscientific
Model Development
DiscussionsHydrology and
Earth System
Sciences
Open AccessHydrology and
Earth System
Sciences
Open Access DiscussionsOcean Science
Open Access Open Access
Ocean Science
Discussions
Solid Earth
Open Access Open Access
Solid Earth
Discussions
The Cryosphere
Open Access Open Access
The Cryosphere
Discussions
Natural Hazards
and Earth System
Sciences
Open Access
Discussions
A model of hydrological and mechanical feedbacks of preferential
fissure flow in a slow-moving landslide
D. M. Krzeminska1, T. A. Bogaard1, J.-P. Malet2, and L. P. H. van Beek3
1Department of Water Management, Delft University of Technology, P.O. Box 5048, 2600 GA Delft, the Netherlands 2Institut de Physique du Globe de Strasbourg, UMR7516, CNRS, Universit´e de Strasbourg, Ecole et Observatoire des
Sciences de la Terre, 5 rue Descartes, 67084 Strasbourg, France
3Department of Physical Geography, Utrecht University, UCEL, P.O. Box 80115, 3508 TC, Utrecht, the Netherlands
Correspondence to: D. M. Krzeminska ([email protected])
Received: 10 September 2012 – Published in Hydrol. Earth Syst. Sci. Discuss.: 1 October 2012 Revised: 25 January 2013 – Accepted: 11 February 2013 – Published: 5 March 2013
Abstract. The importance of hydrological processes for landslide activity is generally accepted. However, the rela-tionship between precipitation, hydrological responses and movement is not straightforward. Groundwater recharge is mostly controlled by the hydrological material properties and the structure (e.g., layering, preferential flow paths such as fissures) of the unsaturated zone. In slow-moving landslides, differential displacements caused by the bedrock structure complicate the hydrological regime due to continuous open-ing and closopen-ing of the fissures, creatopen-ing temporary prefer-ential flow paths systems for infiltration and groundwater drainage. The consecutive opening and closing of fissure aperture control the formation of a critical pore water pres-sure by creating dynamic preferential flow paths for infiltra-tion and groundwater drainage. This interacinfiltra-tion may explain the seasonal nature of the slow-moving landslide activity, in-cluding the often observed shifts and delays in hydrological responses when compared to timing, intensity and duration of precipitation.
The main objective of this study is to model the in-fluence of fissures on the hydrological dynamics of slow-moving landslide and the dynamic feedbacks between fis-sures, hydrology and slope stability. For this we adapt the spatially distributed hydrological and slope stability model (STARWARS) to account for geotechnical and hydrologi-cal feedbacks, linking between hydrologihydrologi-cal response of the landside and the dynamics of the fissure network and applied the model to the hydrologically controlled Super-Sauze land-slide (South French Alps).
1 Introduction
The importance of understanding the hydrological system within a landslide is commonly accepted; however, includ-ing hydrological processes and their variability in landslide modelling is quite difficult and, therefore, often limited (Bo-gaard, 2001; Lindenmaier, 2007). The main difficulties stem from spatial and temporal heterogeneity of bedrock geom-etry, material layering, hydrological material properties and dominant hydrological processes across the landslide (Malet et al., 2005; Krzeminska et al., 2013). This is particularly true when dealing with slow-moving clayey landslides, where the continuous movement of the sliding material results in fis-sure formation with successive opening and closing of fisfis-sure apertures.
Fissures are a special case of macropores with apertures that vary from a few millimetres up to tens of centimetres. For the purpose of this study, we use the term “fissures” to de-scribe geo-mechanically induced cracks that form and prop-agate as a result of tensile opening, sliding and tearing (in-duced by soil mass movements). It is important to stress that these fissures are filled or partly filled with reworked material and, therefore, they should be seen as volumes of increased porosity and increased hydraulic permeability, not as open “cracks” (Krzeminska et al., 2012). The vertical cracks re-sulting from drying – wetting cycles are not considered. Fur-thermore, we use the term “preferential flow” to refer to rapid water flow bypassing the bulk of the matrix (Beven and Ger-man, 1982) occurring through the areas of enhanced water fluxes due to the presence of fissures.
Presence of fissures creates so called “dual permeability” systems that consider the porous medium as two interacting and overlapping, but distinct continuum with water flow oc-curring in both continua (Gwo et al., 1995; Greco et al., 2002; ˇSim˚unek et al., 2003; Gerke, 2006; Jarvis, 2007). Fissures influence the time and intensity of groundwater recharge changing the storage capacity of a soil and affect the infiltra-tion processes of rainfall or snowmelt (Bogaard, 2001; Van Asch et al., 2001; Bievre et al., 2011). Depending on fissure geometry and connectivity between them (Beven and Ger-mann, 1982; McDonnell, 1990; Cameira et al., 2000; Nobles et al., 2004), they may have adverse and beneficial effect on landslide activity (Van Beek and Van Asch, 1999; Fannin et al., 2000; Uchida et al., 2001). An extended fissure network may increase the rate of natural soil drainage and limits the building up of pore water pressure. On the contrary, a dead-end fissure network contributes to maintain high pore wa-ter pressures in the surrounding soils, once their storage ca-pacity is exceeded. Moreover, fissures may increase the rate of vertical infiltration and, in consequence, increase the rate of groundwater recharge (McDonnell, 1990; Uchida et al., 2001; Krzeminska et al., 2012, 2013).
The complexity of preferential flow processes, and their high spatial and temporal variability, makes it very difficult to measure the processes in the field and to upscale the in-formation to the catchment scale (Van Asch et al., 2007; Van Schaik, 2010). In hillslope hydrological models prefer-ential flow is commonly incorporated as enhanced vertical infiltration, rapid slope-parallel flow on the bedrock surface or modification of the saturated permeability function (Bo-gaard, 2002; Beckers and Alila, 2004; Kosugi et al., 2004; Mulungu et al., 2005; Zehe and Bl¨oschl, 2004; Zhang et al., 2006) without accounting for spatial and temporal variation of the preferential flow paths characteristics. Weiler and Mc-Donnell (2007) stressed that incorporation of the spatially dynamic nature of preferential flow systems for conceptual-isation and parameterconceptual-isation of the effect of lateral preferen-tial flow on hillslope hydrology is one of the greatest chal-lenge.
In 1999, Van Beek and Van Asch proposed a spatially dis-tributed physically based model coupling hydrological and stability dynamics, developed in the PCRaster environmen-tal modelling software package. The use of meta-language of PCRaster GIS package provides an expedient way to include and change spatially distributed hydrological and geotechnical parameters. In the subsequent development of the STARWARSmodel (Van Beek, 2002), fissure flow was in-troduced in a simpler manner, allowing a fraction of the sur-face detention, equal the volume of free pore space (i.e., fis-sures), to bypass the unsaturated matrix and directly recharge the groundwater. In 2005, Malet et al. applied the STAR
-WARS model to the Super-Sauze landslide using the sim-ple bypass flow scheme representing only shallow bypass-ing flow without fissure – matrix interaction. Krzeminska et al. (2012) included more detailed representation of fissure
flow in STARWARSmodel. Following a dual-permeability
ap-proach (Gerke, 2006; ˇSim˚unek et al., 2003; Jarvis, 2007) they assumed the presence of two overlapping and interacting do-mains, the matrix and fissures blocks, having their own char-acteristic and properties (i.e., porosity, hydraulic conductiv-ity) and allowing water flow in both domains.
In this paper, we apply the above model (Krzeminska et al., 2012) to the hydrologically controlled slow-moving Super-Sauze landslide and explicitly take into account the mutual dependence between fissures (their geometry and ef-fectiveness for transmitting the water downslope), hydrology and level of landslide activity. The main objective of this study is to model the influence of fissures on the hydrolog-ical dynamics of slow-moving landslides and to formulate a framework to incorporate feedback between fissure flow and stability state into landslide modelling.
2 The STARWARSmodel – dynamic characteristics of fissure network
2.1 General model description
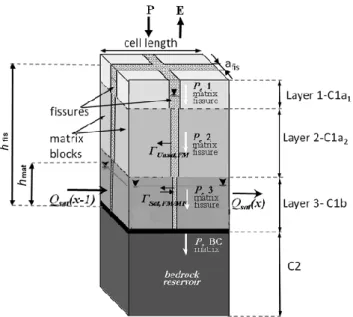
The STARWARS(Van Beek, 2002) model is a spatially dis-tributed physically based model coupling hydrological and stability dynamics. The model consists of a core model de-scribing the dynamics of saturated and unsaturated flow in the soil and of sub-models that describe related hydrological processes such as interception, transpiration, and snow accu-mulation and snow melt. The core model represents the soil column, typically consisting of three layers, overlying semi-impervious bedrock.
The fissures network is prescribed by the fractional area covered by fissure (Ffis), and mean fissure aperture (afis)or
total number of fissures per cell (Nfis). Fissures are
consid-ered to be filled with reworked material (no open spaces) and they retain their own water level and soil moisture content (Fig. 1; Krzeminska et al., 2012).
Surface fluxes (infiltration and evaporation) are partitioned between matrix and fissure fraction, proportionally to the fraction area. Following the original process description of the STARWARS model, the vertical unsaturated flow (per-colation, Pe) in matrix and fissures domain is gravitational and vertical only, and is controlled by the unsaturated hy-draulic conductivity using the relationship of Millington and Quirk (1959) and Farrel and Larson (1972). When the perco-lation towards the lithic contact exceeds the deep drainage, a groundwater table forms and starts to rise from the bottom of the lowest layer upward. The groundwater level is assumed to be vertically contiguous (for both matrix and fissures frac-tion). Lateral exchange 0 [m3h−1] within the cell is possi-ble only between the saturated zones of matrix and fissure fractions (0Sat,FM/MF)and the unsaturated zones of the
fis-sure fraction and the saturated zone of the matrix fraction (0Unsat, FM)when water level in the fissure fraction exceeds
D. M. Krzeminska et al.: A model of hydrological and mechanical feedbacks 949 that in the matrix fraction. Lateral flow (Qsat)between cells
is described by a bulk flow across the saturated zone that arises from the gradient in the total piezometric head and overall transmissivity (Fig. 1). This flux is resolved in the x-and y-direction x-and is partitioned over the matrix x-and fissure domain on the basis of the connectivity of the fissure. The fissure connectivity (Cfis)represents the chance for fissures
to be connected laterally across adjacent soil columns: it can vary from 0–100 % where 0 % means that there is no connec-tion between the fissures and 100 % means full connectivity. For a complete description of the model the reader is referred to Van Beek (2002) and Krzeminska et al. (2012).
2.2 Hydrological feedback
Hydrological feedback is the mutual dependence between landslide hydrological responses and effectiveness of the fis-sure network to transport water which increases with soil wetness (Tsuboyama et al., 1994; Noguchi et al., 1999; Sidle et al., 2000). Following the concept presented by Krzeminska et al. (2012), the model accounts for dynamic hydrological feedback between fissure connectivity and the degree of sat-uration of the soil column (Eq. 1).
Cfis,i= (1)
(C
fis,max−Cfis,min
θE,Sat−θE,fc ·(θE,i−θE,fc) + Cfis,min for θE,i≥θE,fc
Cfis,min for θE,i< θE,fc
where Cfis,iand θE,iare fissure connectivity [–] and effective
saturation of the matrix [–] at time step i, Cfis,minand Cfis,max
are the minimal and maximal fissures connectivity, set to 0.1 and 0.9, respectively; θE,fc=θE,pF=2.0is effective saturation
at the field capacity [–] and θE,sat=1 (full saturation).
2.3 Mechanical feedback
Mechanical feedback is the mutual dependence between fis-sure geometry and differential displacement observed within landslide. The density and, thus, the volume of the fissures, is an important characteristic determining the influence of fissures on landslide hydrology (Beven and Germann, 1982; McDonnell, 1990; Cameira et al., 2000; Nobles et al., 2004). As already stated, the vertical cracks resulting from dry-ing – wettdry-ing cycles are not considered in this paper and the term “fissures” refers to geo-mechanically induced cracks only. Location and morphology of those fissures correspond to mechanical processes within the landslide. There are three basic modes of fissure propagation: tensile opening, sliding and tearing (Anderson, 2005; Schulson and Duval, 2009). However, it is mainly tensile fracturing that dominates the fissure formation at the free surface of the Super-Sauze land-slide (Travelletti and Malet, 2012; Stumpf et al., 2013). The long-term field monitoring and airborne ortho-photo or UAV-based ortho-mosaic analysis (Malet et al., 2002; Malet, 2003; Niethammer et al., 2012) allow for the identifying of the
Fig. 1. Schematisation of the hydrological model of the Super-Sauze landslide.
typical surface fissure patterns and their distribution across the landslide. It can be observed that the spatial distribution of fissure patterns is not changing significantly in time spite continuous landslide activity. This indicates strong de-pendence between the geometry of the stable bedrock, me-chanical properties of the sliding material and fissures occur-rence (Fig. 4; Niethammer et al., 2012; Walter et al., 2012; Stumpf et al., 2013). Consequently, observed surface fissures are good indicators of local deformation level, that could be extended over the whole soil profile with relatively brittle top soil behaviour (0–1 m) and more ductile behaviour in deeper layers (Stumpf et al., 2013).
Moreover, a significant increase of fissure density can be observed in spring or beginning of summer, which correlates with observed landslide acceleration periods (Malet, 2003). Further development of surface fissure patterns depends on the level of landslide activity (e.g., displacement rates) and meteorological conditions (e.g., precipitation). After the ac-celeration period, fissures may be filled with some surface deposit and/or (partly) closed due to compaction. During the deceleration period, prolonged dry periods may result in in-creased brittleness of the upper soil layer and consequently increase in fissure density (Stumpf et al., 2013).
These observations show that temporal changes in fissure volume and density are the result of complex and interact-ing processes. Here, we present a first attempt to account for dynamically changing fissure volume by correlating fis-sure density (and, thus, fisfis-sure volume) with factor of safety, which is a deterministic measure of slope stability. Factor of safety (fs)is the ratio between maximum shearing resistance
of failure and shear stress and is calculated here with the assumptions of the infinite slope model (Skempton, 1964), which is reasonable for landslides 25 times longer than they
are deep (Milledge et al., 2012). The interaction between cells is neglected and the shear surface is assumed to be equal to the depth of the particular soil column. These assumptions are very efficient for a GIS because calculated stability de-pends on the attributes of each individual soil column only (Van Asch et al., 1996; Van Beek and Van Asch, 2004). As such, fsserves here as a proxy for the excess shear stress that
cannot be accommodated by a particular soil column and, thus, can lead to soil extension (e.g., appearance and/or ex-tension of shear and ex-tension fissures) or compression (e.g., closing of existing fissures and/or appearance of compres-sion fissures and bulges).
We empirically conceptualised the general relationship be-tween factor of safety and fissure volume. When the soil col-umn is relatively stable (fs 1) there are no, or very limited,
fissures present within this soil column. When the stability of the soil column approaches equilibrium limit (fs= 1), more
fissures appear and the volume of fissures increases with de-creasing fs. In practice, this means that fs calculated for a
particular cell (soil column) controls the volumes of the do-mains within this cell (matrix/fissures). This simplified rela-tionship between fissure density (Ffis) and factor of safety
(fs) is described with Eq. (2).
Ffis,i= (2)
Ffis,max for fs,i< fs,min
(fs,max−fs,i)
(fs,max−fs,min)·(Ffis,max−Ffis,min) + Ffis,min for fs,min≤fs,i≤fs,max
Ffis,min for fs,i> fs,max
The Ffis,minand Ffis,maxare the upper and lower limit of
fis-sure density. The fs,minand fs,maxdefine the range of factor
of safety that corresponds to the range of changes in fissure density.
3 Modelling of the Super-Sauze landslide 3.1 Description of the Super-Sauze landslide
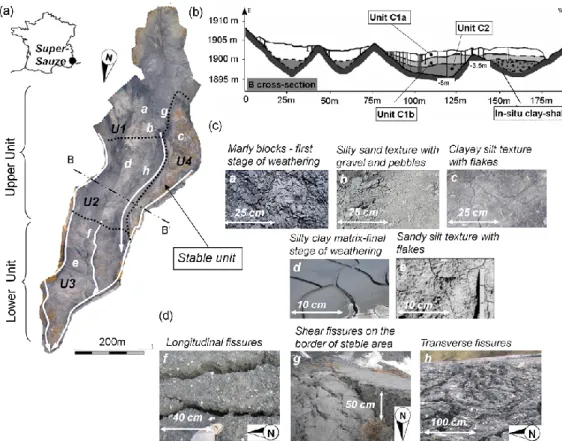
The Super-Sauze landslide (Fig. 2a) is a persistently ac-tive landslide. It covers 0.17 km2 of surface and its volume is estimated at approximately 560 000 m3 (Travelletti and Malet, 2012). The average slope of the landslide is 25◦. The landslide consists of strongly heterogeneous clayey material (Fig. 2c), reworked blocks and panels of marls at various stages of weathering, clast of all sizes and silty-clay matrix with calcite and moraine blocks (Malet et al., 2003). The preferential water and material pathways are delimited by buried parallel crests and gullies.
From a hydrological and geotechnical point of view, the landslide consists of two superimposed vertical units over-laying the bedrock (Fig. 2b; Malet, 2003; Travalletti and Malet, 2012). A surficial unit (C1) is very active and very wet viscous mud formation of 5 to 9 m thickness, saturated hy-draulic conductivity (ksat)ranging from 10−4to 10−8m s−1
and plasticity index (Ip) between 10 and 23. The deeper
unit (C2) is a stiff compact, impervious and stable formation (thickness = 5–12 m, ksat=10−11–10−8m s−1). The surficial
unit (C1) is divided in two secondary units, C1a and C1b, de-pending on the shape of the paleotopography and hydrologi-cal properties, e.g., decreasing the ksatand porosity (n) with
depth due to compaction. The soil surface is highly irregular and affected by cracking due to mechanical tension (fissures from around 0.5 m to more than 1.0 m deep; Fig. 2d). The heterogeneity of the material and local surface mass move-ment processes (e.g., small surface mudflow accumulation lobes, local runoff wash deposits) explain important varia-tions of porosity (from 0.33 to 0.49) and vertical hydraulic conductivity (from 10−8 to 1.8 × 10⁻⁵m s−1)over the area (Malet, 2003; Malet et al., 2005).
The landslide kinematics is controlled by hydrology (Malet et al., 2002). The mass movement occurs as a con-sequence of the rise of groundwater table and, hence, the de-velopment of positive pore pressure (Fig. 3b–c). The ground-water originates mostly from rainfall and snow melt infiltra-tion both in the soil matrix and in the fissure system. The activity of the landslide is seasonal and its velocities vary from 0.02–0.05 m day−1up to 3.00 m day−1during accelera-tion peaks observed in spring season (Fig. 3a–b; Malet et al., 2003; Travelletti et al., 2012).
Based on hydro-geomorphological (Figs. 2b–d and 3c) and kinematical characteristics (Fig. 3a–b), the landslide can be divided into three main units (Fig. 2a; Malet et al., 2005). The “upper unit” characterised by very rapid piezometric re-sponse and large groundwater level variations at the event scale (up to 0.5 m) and relatively medium variation at the yearly time scale (0.5 to 1.0 m). The interconnected network of fissures filled or partly filled with loosely packed material is present in this area and provides the paths for fast pref-erential infiltration. Based on Krzeminska et al. (2013), this unit can be divided in two sub-units (U1 and U2; Fig. 2a) depending on dominant hydrological processes. The “lower unit” (U3) has modest event scale groundwater level fluctu-ations (0.05 to 0.30 m), but relatively high seasonal variation (0.1–2.5 m). Infiltration processes take place mainly through the matrix since crack systems have limited vertical and hor-izontal extend. Finally, the “stable unit” (U4) of the landslide characterised by very limited groundwater level fluctuations (centimetres) on both yearly and event time scale.
3.2 Model representation of the Super-Sauze landslide The geometry, parameterisation and hydrological concepts of the Super-Sauze landslide are a further extension of the work presented by Malet et al. (2005).
The overall geometry of the Super-Sauze landslide has been defined based on 3-D geometrical model of the land-slide (Travelletti and Malet, 2012) with the spatial resolution at the pixel of 5 × 5 m. Spatial representation of the land-slide composes of four units corresponding to the hydro-geomorphological units (Fig. 2a). Vertically, landslide body
D. M. Krzeminska et al.: A model of hydrological and mechanical feedbacks 951
Fig. 2. (a) The Super-Sauze landslide with indicated hydro-geomorphological units (after Malet et al., 2005), the main streams/drainage paths within landslide (white arrows) and location of B-B0cross section; (b) geotechnical structure observed in B-B0; (c) soil surface characteristics observed over the landslide area; (d) example of fissures formations observed over the landslide area. Pictures taken during filed campaigns in May and July 2008.
is represented by the layers corresponding to C1a and C1b units (Fig. 2b). The maximal depth of C1a is 3 m and of C1b is 9 m. Following the idea of Malet et al. (2005), we defined additional near surface layer (C1a1)with an assumed maxi-mum depth of 1 m. This layer is the most influenced by fis-sures.
3.3 Fissure fraction characteristics
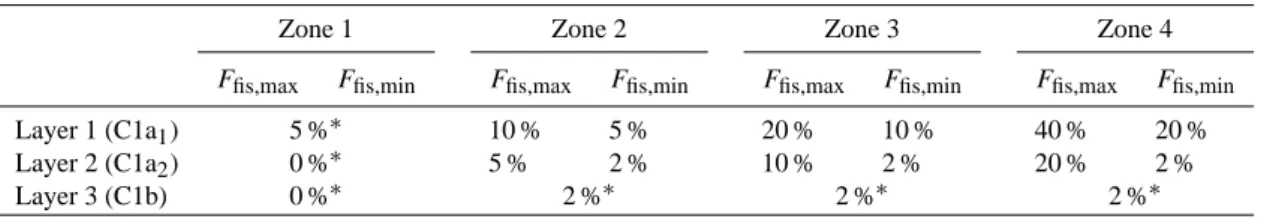
The maximum fissure fraction (Ffis,max)of the near surface unit (C1a1)has been derived from the analysis of the aerial photographs of the landslide from the period of 2007–2008 (Niethammer et al., 2012) and generalised in four zones across the landslide (Fig. 4). Zone 1 (F1) represents areas with no, or very limited, fissures observed at the soil surface. However, there is field evidence for the presence of prefer-ential flow paths in these areas (Krzeminska et al., 2013). Therefore, Ffis,max in F1 is set to be 5 % and Ffis,min is set
to be equal to Ffis,max (no mechanical feedback is
consid-ered). The Ffis,maxand Ffis,minfor deeper layers were set
arbi-trary taking into account that generally the volume of fissures decreases with depth (due to compaction and rheology) and that they should be continuous throughout the vertical profile
(model requirement; Krzeminska et al., 2012). All Ffis,max
and Ffis,minvalues are listed in Table 1.
3.4 Meteorological data
The meteorological data (rain intensity, air temperature, in-coming short wave radiation and relative humidity), observed at 0.8 km distance from the landslide, were used to perform model runs. A snowmelt routine based on the degree-day ap-proach was applied. A temperature threshold (Ts)was used
to discriminate rainfall from snow fall and a critical temper-ature (Tm), above which snowmelt occur, was used to govern the melt equation. A vegetation cover is not considered in the model as the landslide has no or very limited vegetation.
3.5 Model calibration and validation
The model was calibrated against observed snow coverage and groundwater level fluctuation over the period of one cal-endar year (January–December 2007). The initial distributed water level, soil moisture and snow thickness conditions were produced by running the model for one year (2007), for multiple times until a dynamic steady-state was achieved. The time step resolution of the model is 1 h.
Fig. 3. (a) Horizontal surface displacement observed between May 2007 and October 2008 based on ortho-photo analysis (Niethammer et al., 2012) and long-term average movement velocity map (1996–2007) as reported by Malet et al. (2003); note the location of the piezometers, measurements points of displacement and the hydro-geomorphological units; (b) cumulated displacement measured at three points: pt1, pt2 and pt3 (Travelletti et al., 2012); (c) groundwater level fluctuation observed at three piezometers (BV16, CV3, EV2) between May 2008 and November 2008.
Table 1. Maximum and minimum fissure fraction as defined per zone and per layer.
Zone 1 Zone 2 Zone 3 Zone 4
Ffis,max Ffis,min Ffis,max Ffis,min Ffis,max Ffis,min Ffis,max Ffis,min
Layer 1 (C1a1) 5 %∗ 10 % 5 % 20 % 10 % 40 % 20 %
Layer 2 (C1a2) 0 %∗ 5 % 2 % 10 % 2 % 20 % 2 %
Layer 3 (C1b) 0 %∗ 2 %∗ 2 %∗ 2 %∗
∗F
fis,max=Ffis,min– no mechanical feedback considered.
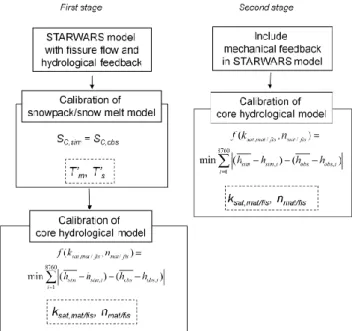
A two stage calibration procedure has been applied (Fig. 5). In the first stage, the model including only the hy-drological feedback (Krzeminska et al., 2012) was calibrated in order to get estimates of fs,minand fs,maxneeded for
in-troducing mechanical feedback (see Eq. 2). This included the calibration of the “snow pack/snow melt” model and the core hydrological model. The “snow pack/snow melt” model was calibrated against binary “snow-no snow information”. The effective parameters that produce the snow cover (SC,sim) du-ration comparable to the observed one (SC,obs)are: Ts0=1◦C and Tm0 =6◦C. The liquid water holding capacity of snow pack was set to be constant over time and equal 0.10 and a
day-degree factor equal to 2.5 mm day−1 ◦C−1. It is impor-tant to note that the relatively high effective values for Ts0 and Tm0 are the effect of compensating for local variations in meteorological factors (lapse in temperature, shading and ra-diation) and diurnal changes in temperature when modelling with a 1 h simulation time step. The same duration of snow cover would be obtained using Ts0=1◦C and Tm0 =1◦C with 24 h simulation time step.
Next, the core hydrological model was calibrated. The ini-tial hydrological parameters of matrix and fissure fractions were based on field – measured parameters as reported by Malet et al. (2005) and they were assumed to be equal for
D. M. Krzeminska et al.: A model of hydrological and mechanical feedbacks 953
Table 1: Maximum and minimum fissure fraction as defined per zone and per layer
Zone 1 Zone 2 Zone 3 Zone 4 Ffis,max Ffis,min Ffis,max Ffis,min Ffis,max Ffis,min Ffis,max Ffis,min
Layer 1 (C1a1) 5%* 10% 5% 20% 10% 40% 20%
Layer 2 (C1a2) 0%* 5% 2% 10% 2% 20% 2%
Layer 3 (C1b) 0%* 2%* 2%* 2%*
*Ffis,max = Ffis,min – no mechanical feedback considered
Figure 4. (a) The DEM of Super-Sauze landslide area from 1956, before the initial failure of the slope with marked current boundary of the landslide (b) The aerial photography (July 2008) with fissures are marked with black lines; (c) the implemented fissures zones with defined maximal (Ffis,max) and minimal (Ffis,min) observed fissure fraction in the surface layer.
3.4 Meteorological data
The meteorological data (rain intensity, air temperature, incoming short wave radiation and relative humidity), observed at 0.8 km distance from the landslide, were used to perform model runs. A snowmelt routine based on the degree-day approach was applied. A temperature threshold (Ts) was used to discriminate rainfall from snow fall and a
critical temperature (Tm), above which snowmelt occur, was used to govern the melt
equation. A vegetation cover is not considered in the model as the landslide has no or very limited vegetation.
Fig. 4. (a) The DEM of Super-Sauze landslide area from 1956, be-fore the initial failure of the slope with marked current boundary of the landslide. (b) The aerial photography (July 2008) with fissures are marked with black lines; (c) the implemented fissures zones with defined maximal (Ffis,max)and minimal (Ffis,min)observed fissure
fraction in the surface layer.
the whole landslide. The distinction between parameters for matrix and fissure fraction was made by assuming minimum and maximum measured values being representative for ma-trix and fissure characteristics, respectively (Table 3). For ex-ample, if the range of measured porosity in the field is 0.36 to 0.49 (Malet et al., 2005) then the minimum (0.36) is as-sumed to represent matrix porosity and maximum (0.49) sure porosity. Additionally, the hydraulic conductivity of fis-sure fraction is assumed to be 10 times higher than the one of matrix fraction.
The model was calibrated by changing saturated conduc-tivity (ksat,mat/fis)and porosity (nmat/fis)only. These four pa-rameters were chosen since they show the highest variability when measured in the field and the hydrological model is most sensitive to their variations (see Van Beek, 2002; Malet et al., 2005; Krzeminska et al., 2012). Observed piezometric water levels (see Fig. 2a for the location of the piezometers) were assumed to be the representative for particular units within the landslide (Table 2). The parameters were differ-entiated per landslide unit (within the range of ±50 % for
nmat/fisand ±100 % for ksat,mat/fis)and adjusted to come to the
smallest differences between modelled (hsim)and observed
(hobs)groundwater level fluctuations per landslide unit (U1–
U4).
The stability sub-model was not calibrated, but the soil strength parameters, cohesion (c) and the angle of friction (ϕ), were set for the entire landslide in order for the fac-tor of safety per cell (fs)to oscillate around unity for the most active areas of the Super-Sauze landslide (Fig. 2a). Fig-ure 6a shows the results from the simulation performed with
c0=8 kPa and ϕ0=25◦. This parameter’s set is in agreement with the values presented by Malet (2003) for C1b sub-layer where, according to our conceptualisation, the slip surface is located.
Fig. 5. The calibration procedure.
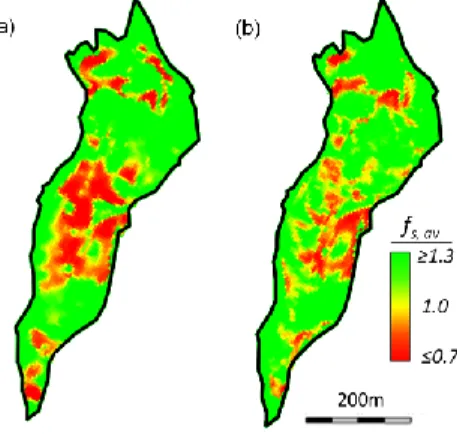
The upper and lower factor of safety, fs,minand fs,maxwere
set to 0.7 and 1.3, respectively, as the simulated values of the annual average factor of safety (fs,av)falls in this range for
more than 75 % of landslide area (Fig. 6a).
The second stage of the calibration procedure was based on the simulations performed with both hydrological and me-chanical feedbacks. The saturated conductivity (ksat,mat/fis)
and porosity (nmat/fis)were again adjusted. Table 3 gives the final calibration results.
At the end, the model including both hydrological and me-chanical feedbacks was validated for the year 2008.
4 Simulation results and discussion
Figure 7 presents observed and simulated groundwater level fluctuations over years 2007 (calibration period) and 2008 (validation period). The simulated groundwater level fluctu-ations representative for particular hydro-geomorphological units were collated with observed piezometric groundwa-ter levels fluctuation (Table 2, Fig. 3). The general range of the groundwater level fluctuation and the timing of the major peaks are well represented by the model. The root-mean-square error (RMSE) between observed and simulated groundwater level variations representative for four units (see Table 3) for the calibration period varies between 0.18 and 0.40 m for the calibration period, and between 0.20–0.44 m for validation period. The differences between observed and modelled groundwater fluctuations mainly stem from the col-lating of point measurements with area averaged simulated results. During the winter periods and short after the snow melt the difference are also related to inaccuracy of the “snow pack/snow melt” sub-model.
Fig. 6. The annually average factor of safety (fs,av)simulated for
one year calibration period (2007) with the model (a) accounting for hydrological feedback only (first stage of calibration) and (b) accounting for both hydrological and mechanical feedbacks (second stage of calibration).
The maximum fissure fraction observed during simulation occurs in July 2007 and the minimum fissure fraction occurs in period of October–November 2007 (Fig. 8). The maxi-mum variation in fissure fraction (1Ffis)is 13 % and it occurs
in the area with the highest fissure fraction (F4) and relatively high landslide activity (Fig. 3a). This behaviour of the fissure fraction is in agreement with what is expected from the field monitoring (Fig. 3b–c): rising groundwater level is associ-ated with growing displacement rate and results in a more extended fissure network.
The model performance regarding the simulation of spa-tial differences in potenspa-tial landslide movement was tested by collating the simulated values of factor of safety with ob-served displacement rate reported by Travelletti et al. (2012) for the year 2008 (Fig. 3b). The modelled distribution of the factor of safety (Fig. 6b) represents the observed Super-Sauze landslide activity (Fig. 3a) quite well: the middle up-per part of the landslide is “the most active one” (fs is the
lowest) while the lower part of the landslide is relatively stable (fs above 1.0 for most of the time during the
simu-lation period) and the western part is the most stable area. However, in the validation period (May–September 2008), there is a 20 days time-lag between modelled decreases in
fs and observed displacement rate. This time lag is also visible between simulated and observed groundwater level variation during the validation period (Fig. 7) and it results from the “snow pack/snow melt” calibration. The simulated time lag can be significantly reduced by changing the effec-tive critical temperature for snow melt for the validation pe-riod (Tm0 =5◦C). With this adjustment the simulated spatio – temporal patterns of the factor of safety follow the observed displacement rates very well (Fig. 9). It is interesting to note the differences between the distribution of the annual aver-age factor of safety (fs,av)simulated with the model
account-ing for hydrological feedback only and the model accountaccount-ing
Table 2. Landslide unit and corresponding measuring points (see also Figs. 2a and 3a).
Unit Piezometer Point of displacement (Fig. 2a) (Fig. 3a) measure (Fig. 3a)
U1 AV1 –
U2 BV16 & CV3 pt1, pt2
U3 EV1 pt3
U4 BV5 –
for both hydrological and mechanical feedbacks (Fig. 6a and b). Introduction of dynamically changing fissure volume (in practice changing the porosities and hydraulic conductivity) influences the distribution of water within landslide body (Krzeminska et al., 2012; see also Fig. 10) and, consequently, influences the calculation of the local factor of safety.
In order to study the influence of the implemented dy-namic characteristics of the fissure network, Ffis(fs) and Cfis(θE), three scenarios were analysed:
– scenario-1 – both hydrological Cfis(θE)and mechanical feedbacks are included, Ffis(fs)
– scenario-2 – only hydrological feedback (Cfis(θE)is
in-cluded; Ffisis assumed to be constant (Ffis=Ffis,av)and Ffis,av is estimated based on fissure fraction simulated with scenario-1, averaged over the fissure areas (F1–F4, Fig. 4c) and over one year simulation period;
– scenario-3 – fissure network is not considered, only ma-trix fraction is present.
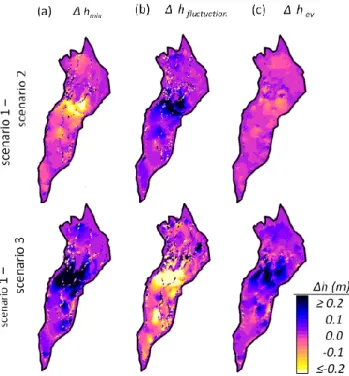
Figure 10 shows the difference in groundwater behaviour modelled with three scenarios. The highest differences tween the scenarios in simulated groundwater level be-haviour can be seen in the middle part of the landslide (U2; Fig. 2a). There are no, or very limited differences observed in groundwater level behaviour within stable unit (U4; Fig. 2a). In general, the minimum simulated groundwater level (hmin; Fig. 10a) is the lowest for scenario-3 (no fissure
network included) and the highest for scenario-2 (fissure network with hydrological feedback only). The analogous trend is observed when comparing the annual range of sim-ulated groundwater level fluctuations (hfluctuation; Fig. 10b):
scenario-3 presents the highest variations of simulated groundwater level and in case of scenarios-2 the simulated groundwater level fluctuations are the lowest. The overall modelled groundwater level, averaged over a one year sim-ulation period (hav), is the highest for scenario-2 and the
lowest for scenario-3 (Fig. 10c). The differences between the scenarios are in agreement with the results presented by Krzeminska et al. (2012) for the “simple” landslide repre-sentation: introduction of fissure network and accounting for the dynamically changing fissure connectivity resulted in an increase in total average water stored within the landslide.
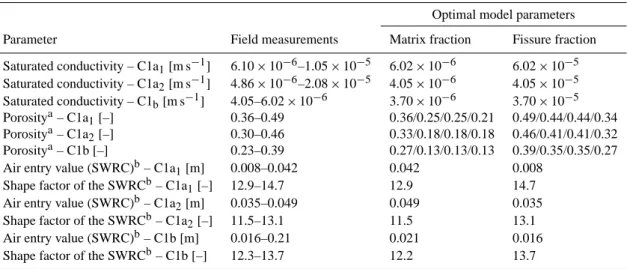
D. M. Krzeminska et al.: A model of hydrological and mechanical feedbacks 955 Table 3. The range of field measured parameters (Malet et al., 2005) and the set of parameters after model calibration.
Optimal model parameters
Parameter Field measurements Matrix fraction Fissure fraction
Saturated conductivity – C1a1[m s−1] 6.10 × 10⁻⁶–1.05 × 10⁻⁵ 6.02 × 10⁻⁶ 6.02 × 10⁻⁵
Saturated conductivity – C1a2[m s−1] 4.86 × 10⁻⁶–2.08 × 10⁻⁵ 4.05 × 10⁻⁶ 4.05 × 10⁻⁵
Saturated conductivity – C1b[m s−1] 4.05–6.02 × 10⁻⁶ 3.70 × 10⁻⁶ 3.70 × 10⁻⁵
Porositya– C1a1[–] 0.36–0.49 0.36/0.25/0.25/0.21 0.49/0.44/0.44/0.34
Porositya– C1a2[–] 0.30–0.46 0.33/0.18/0.18/0.18 0.46/0.41/0.41/0.32
Porositya– C1b [–] 0.23–0.39 0.27/0.13/0.13/0.13 0.39/0.35/0.35/0.27 Air entry value (SWRC)b– C1a1[m] 0.008–0.042 0.042 0.008
Shape factor of the SWRCb– C1a1[–] 12.9–14.7 12.9 14.7
Air entry value (SWRC)b– C1a2[m] 0.035–0.049 0.049 0.035
Shape factor of the SWRCb– C1a2[–] 11.5–13.1 11.5 13.1
Air entry value (SWRC)b– C1b [m] 0.016–0.21 0.021 0.016
Shape factor of the SWRCb– C1b [–] 12.3–13.7 12.2 13.7
aPorosity values vary between units U1/U2/U3/U4;bvalues taken from Malet et al. (2005).
Fig. 7. Observed and simulated groundwater level fluctuations over years 2007 (calibration period) and 2008 (validation period) with corre-sponding root-mean-squares errors values (RMSE). The 0 at the y-axis corresponds to average observed or simulated groundwater level. The shadow areas correspond to the period when the snow cover was observed.
When analysing the differences between the scenarios where fissure network are implemented (scenario-1–2) one can see how the model captures the behaviour of the fis-sure network. Let us analyse two areas within the landslide (Fig. 8a) being representative for:
– fissure network with limited downslope drainage – area A – located in the upper part of the landslide, where the highest fissure fraction (max Ffis≥25 %) and the
high-est variability in fissure fraction (max Ffis−min Ffisup
to 10 %) occurs during the simulation period and – fissure network with relatively unlimited drainage – area
B – lower part of the landslide, where fissure fraction is relatively high (Ffisfrom 10 % to 20 %).
The area located just below area A is characterised by rela-tively limited fissure fraction (Ffis=5 %). As a consequence
of this set up, the fissure network in the area A behaves as a network of dead-end fissures. The rising saturation of the particular soil column within area A results in rising chance for fissures to be connected (scenario-2). However, with limited drainage possibilities in downstream direction this results in rising of the average groundwater level in the area A (Fig. 10c). When mechanical feedback is included (scenario-1), the increase in the soil column saturation in-fluences the stability of the soil column and therefore fis-sure volume. Growing volume of fisfis-sures (i.e., increase of available water storage) results in lowering of groundwater
Fig. 8. The modelled dynamics in fissure fraction during: (a) max-imal fissure fraction (max Ffis), (b) minimal fissure fraction (min
Ffis)and (c) the difference between two extremes (max Ffis-min
Ffis)that occurs during one year simulation period (2007). The
ar-eas A and B indicated in Fig. 7a are further discussed.
level. Nevertheless, the annual average groundwater level in area A simulated with scenario-1 is still higher than the one modelled with scenario-3 (where fissures are not considered). The evidence for dead-end like fissure behaviour at the lower part of area A is: (a) the results of small-sprinkling experi-ment performed in this area (Krzeminska et al., 2013) show-ing that infiltration processes are controlled by the extended, but poorly connected fissure network and prolonged peri-ods of elevated pore water pressure are observed after the sprinkling; (b) the observation of saturated tension cracks, with the standing water, observed in this part of the landslide (Malet et al., 2005).
The opposite behaviour is observed in the area B. Here, the modelled fissure network extends till the border of the landslide and can provide natural drainage network when the fissures are connected between adjacent cells. Therefore, even if the average groundwater level in the area increases after introducing fissure network, it decreases when account-ing for hydrological and mechanical feedbacks (scenario-1) and there are almost no differences when compared with scenario-3 (where no fissure network is considered). This be-haviour is also observed in the field: the average groundwa-ter level observed in the piezomegroundwa-ter EV2 is lower than in the middle part of the landslide and it shows moderate piezomet-ric responses.
The results presented herein are, in general, in agreement with previous studies (McDonnell, 1990; Uchida et al., 2001) confirming that presence of fissures influences the percola-tion processes and storage capacity of the soil. Moreover, they confirm that fissure volume and fissure connectivity con-trol the distribution of soil pore water pressure within the landslide (Cameira et al., 2000; Uchida et al., 2001; Nobles et al., 2004; Krzeminska et al., 2012, 2013). The presence of
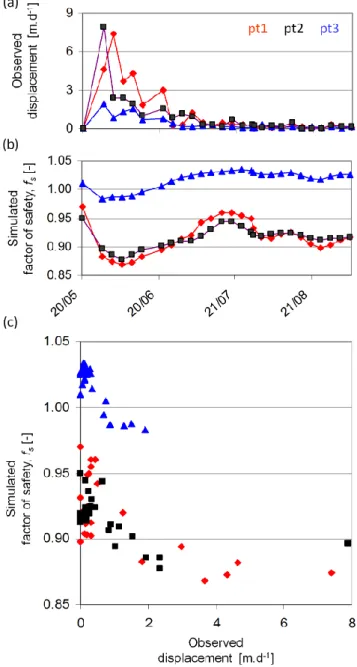
Fig. 9. (a) Observed displacement rates for points pt1, pt2 and pt3 (Travelletti et al., 2012); (b) the factor of safety, fs, simulated with
additional adjustment of “snow pack/snow melt” model; (c) the re-lationship between the “new” fsand observed displacement rates
(Travelletti et al., 2012). For the location of the points see Fig. 3a.
disconnected fissures increases the storage capacity whereas outflow is impeded. This results in persistently high ground-water levels. The presence of connected fissures network shows fast preferential drainage as the dominant process and, thus, results in a lower groundwater level.
Logically, groundwater level behaviour results in analo-gous differences, between the scenarios, in simulated stabil-ity of the particular cells. Implementation of the hydrological and mechanical feedbacks (scenario-1) results in a general increase of stability (fs)when comparing to the scenarios
D. M. Krzeminska et al.: A model of hydrological and mechanical feedbacks 957
Fig. 10. The simulated groundwater level behaviour – difference between the four scenarios.
where only hydrological feedback is considered to be dy-namic (scenario-2) (Fig. 6). The findings are schematically summarised in Fig. 11.
Last, but not least, it is important to stress the main limita-tion of the proposed model. The model uses the pre-defined landslide geometry that is not changing during the simulation periods and, thus, no mass displacement has been considered. Moreover, the implemented feedbacks in fissures character-istics have no influence on the strength properties of the ma-terial. The use of the infinite slope model is also an important simplification and calculated fs represent local conditions
only (cell level). However, Milledge et al. (2012) showed that infinite slope model can successfully be applied for land-slides with a length/depth ratio of at least 25. The Super-Sauze landslide is a complex slow-moving translational land-slide with the length around 900 m and the maximal depth of sliding material approximately 9 m (Malet et al., 2005; Trav-elletti and Malet, 2012).
Ideally, looking towards the future and drawing on the work presented by Travelletti et al. (2012) and Stumpf et al. (2013), high spatial resolution observation of surface dis-placement together with detailed observation of dynamic characteristics of fissure patterns should be performed on regular basis giving opportunity to link fissure volume to dif-ferential displacement. This would allow us to improve the proposed relationship (Eq. 2) and to take the mechanical ba-sis of fissure appearance into account. Clearly, the empiri-cal relation that is presently used between the loempiri-cal factor of safety and fissure volume is debatable. The excess shear
Fig. 11. General trends in groundwater level (hav)and local factor
of safety (fs)when analysing four scenarios.
stress could be used to calculate the displacement, but this would add complexity as assumptions on the nature of the displacement have to be taken into account. Still such an ap-proach would not take inter-slice (inter-cell) forces into ac-count and ignore the ensuing mass transfer. The implication is that there is no direct feedback between instability and the driving forces and only the indirect feedback through the fissure-controlled hydrology is taken into account. A com-prehensive alternative to address these limitations would be to consider the force differences between cells and make as-sumptions on the possible compression and dilatation of the soil volume within a cell; volumetric changes can then be logically tied to changes in fissure volume. Essential to in-clude the direct feedback between instability and the driv-ing forces is the incorporation of mass transfer (e.g., as in-cluded in the SlowMove model such as presented by Travel-letti, 2011). Yet, such a model would require a cumbersome update of the mass of the respective soil constituents and the associated properties and states; such an approach implies mixing to obtain effective, voxel-based parameters, which is at odds with the discrete nature of the fissure network. An improved scheme would, therefore, consider mass transfer and its direct effect on the driving forces through the matrix properties of the soil while the implied changes in the form of dilatation or compression for the current volume would affect the fissure content and nature. In order to keep such a scheme manageable, however, it requires close integration with information from field observations and laboratory tests and consequently is a matter for future studies.
5 Conclusions
This paper describes an initial attempt to model the hydrol-ogy of the Super-Sauze landslide with accounting for prefer-ential fissure flow and the dynamically changing character-istics of fissure network. The spatially distributed hydrologi-cal and slope stability model (STARWARS) has been adapted to account for geotechnical and hydrological feedbacks on
changes in fissure volume and fissure connectivity (Van Beek, 2002; Krzeminska et al., 2012). The hydrological pa-rameters used for model calibration are taken from the work of Malet et al. (2005).
The model reproduces well the observed hydrological be-haviour of the landslide, accounting for spatial differences in hydrological responses and captures all the physical phe-nomena and their variation in time and space. Our research outlines that fissure volume and fissure connectivity control the distribution of soil pore water pressure within the land-slide. Implementation of the dynamic characteristics of fis-sure network allowed to account for the spatial and temporal variability in the hydrological processes dominating in par-ticular areas of the landslide that are often observed in the field.
It is important to stress that proposed relationships be-tween saturation of the soil column and fissure connectivity and between the mass movement and fissure volume are the-oretical only. However, our research indicates the need for further study in the direction of measurement and monitor-ing of fissures characteristic and their variation over time. This would allow for a better understanding and constrain of the proposed relationship.
Acknowledgements. This work was supported by the European Commission within the Marie Curie Research and Training Network “Mountain Risks: from prediction to management and governance” (2007–2010, Contract MCRTN-035798, http://www.unicaen.fr/mountainrisks).
Edited by: R. Greco
References
Anderson, T. L.: Fracture Mechanics: Fundamentals and Applica-tions, 3rd Edn., Taylor & Francis, 621 pp., 2005.
Beckers, J. and Alila, Y.: A model of rapid preferential hills-lope runoff contributions to peak flow generation in a tem-perate rain forest watershed, Water Resour. Res., 40, W03501, doi:10.1029/2003WR002582, 2004.
Beven, K. and Germann, P.: Macropores and water flow in soils, Water Resour. Res., 18, 1311–1325, 1982.
Bievre, G., Jongmans, D., Winiarski, T., and Zumbo, V.: Application of geophysical measurements for assessing the role of fissures in water infiltration within a clay landslide (Trieves area, French Alps), Hydrol. Process., 26, 2128–2142, doi:10.1002/hyp.7986, 2011.
Bogaard, T. A.: Analysis of hydrological processes in unstable clayey slopes, PhD Thesis, University of Utrecht, Netherlands, 2001.
Bogaard, T. A.: A state-dependent ground water recharge model for landslide research, Proc. 9th Int. Cong. IAEG, Durban, South Africa, 1489–1496, 2002.
Cameira, M. R., Ahuja, L., Fernando, R. M., and Pereira, L. S.: Evaluating field-measured soil hydraulic properties in water
transport simulations using the RZWQM, J. Hydrol, 236, 78–90, 2000.
Fannin, R. J., Jaakkola, J., Wilkinson, J. M. T., and Hetherington, E. D.: Hydrologic response of soils to precipitation at Carnation Creek, British Columbia, Canada, Water Resour. Res., 36, 1481– 1494, 2000.
Farrel, D. and Larson, W.: Modeling of the pore structure of porous media, Water Resour. Res., 8, 699–705, 1972.
Gerke, H. H.: Preferential flow descriptions for structured soils, J. Plant Nutr. Soil Sc., 169, 382–400, 2006
Greco, R.: Preferential flow in macroporous swelling soil with inter-nal catchment: model development and applications, J. Hydrol., 269, 150–168, 2002.
Gwo, J. P., Jardine, P. M., Wilson, G. V., and Yeh, G. T.: A multiple-pore-region concept to modelling mass transfer in subsurface media, J. Hydrol., 164, 217–237, 1995.
Jarvis, N. J.: A review of non-equilibrium water flow and solute transport in soil macropores: principles, controlling factors and consequences for water quality, Eur. J. Soil Sci., 58, 523–546, 2007.
Kosugi, K., Uchida, T., and Mizuyama, T.: Numerical calculation of soil pipe flow and its effect on water dynamics in a slope, Hydrol. Process., 18, 777–789, 2004.
Krzeminska, D. M., Bogaard, T. A., van Asch, Th. W. J., and van Beek, L. P. H.: A conceptual model of the hydrological influ-ence of fissures on landslide activity, Hydrol. Earth Syst. Sci., 16, 1561–1576, doi:10.5194/hess-16-1561-2012, 2012. Krzeminska, D. M., Bogaard, T. A., Debieche, T.-H., Marc, V.,
and Malet, J.-P.: Sprinkling tests to understand hydrological be-haviour of mudslide, Proc. Int. Conf. “The Second World Land-slide Forum”, Rome, Italy, in press, 2013.
Lindenmaier, F.: Hydrology of a large unstable hillslope at Ebnit, Vorarlberg: identifying dominating processes and structures, PhD Thesis, Universit¨at Potsdam, Germany, 2007.
Malet, J.-P.: Les glissements de type ´ecoulement dans les marnes noires des Alpes de Su. Morphologie, fonctionnement et mod´elisation hydrom´ecanique, PhD Thesis, Universit´e Louis Pasteur, Strasbourg, 2003.
Malet, J.-P., Maquaire, O., and Calais, E.: The use of Global Po-sitioning System techniques for the continuous monitoring of landslides: application to the Super-Sauze earthflow (Alpes-de-Haute-Provence, France), Geomorphology, 43, 33–54, 2002. Malet, J.-P., Auzet, A.-V., Maquaire, O., Ambroise, B., Descroix,
L., Esteves, M., Vandervaere, J.-P., and Truchet, E.: Soil surface characteristics influence on infiltration in black marls: applica-tion to the Super-Sauze earthflow (Southern Alps, France), Earth Surf. Proc. Land., 28, 547–564, 2003.
Malet, J.-P., van Asch, Th. W. J., van Beek, R., and Maquaire, O.: Forecasting the behaviour of complex landslides with a spatially distributed hydrological model, Nat. Hazards Earth Syst. Sci., 5, 71–85, doi:10.5194/nhess-5-71-2005, 2005.
McDonnell, J. J.: The influence of macropores on debris flow initiation, Q. J. Eng. Geol. Hydroge., 23, 325–331, doi:10.1144/GSL.QJEG.1990.023.04.06, 1990.
Milledge, D. G., Griffiths, D. V., Lane, S. N., and Warburton J.: Limits on the validity of infinite length assumptions for mod-elling shallow landslides, Earth Surf. Proc. Land., 37, 1158– 1166, doi:10.1002/esp.3235, 2012.
D. M. Krzeminska et al.: A model of hydrological and mechanical feedbacks 959 Millington, R. J. and Quirk, J. P.: Permeability of porus media,
Na-ture, 183, 387–388, 1959.
Mulungu, D. M. M., Ichikawa, Y., and Shiiba, M.: A physically based distributed subsurface-surface flow dynamics model for forested mountainous catchments, Hydrol. Process., 19, 3999– 4022, 2005.
Niethammer, U., James, M. R., Rothmund, S., Travelletti, J., and Joswig, M.: UAV-based remote sensing of the Super-Sauze land-slide: evaluation and results, Eng. Geol., 128, 2–11, 2012. Nobles, M. M., Wilding, L. P., and McInnes, K. J.: Pathways of dye
tracer movement through structured soils on a macroscopic scale, Soil Sci., 169, 229–242, 2004.
Noguchi, S., Tsuboyama, Y., Sidle, R. C., and Hosoda, I.: Morpho-logical characteristics of macropores and the distribution of pref-erential flow pathways in a forested slope segment, Soil Sci. Soc. Am. J., 63, 1413–1423, 1999.
Schulson, E. M. and Duval, P.: Creep and Fracture of Ice, Cam-bridge University Press, New York, 2009.
Sidle, R. C., Tsuboyama, Y., Noguchi, S., Hosada, I., Fujieda, M., and Shimizu, T.: Stormflow generation in steep forested headwa-ters: a linked hydrogeomorphic paradigm, Hydrol. Process., 14, 369–385, 2000.
ˇSim˚unek, J., Jarvis, N. J., Van Genuchten, M. T., and Garde-nas, A.: Review and comparison of models for describing non-equilibrium and preferential flow and transport in the vadose zone, J. Hydrol., 272, 14–35, 2003.
Skempton, A. W.: The long-term stability of clay slopes, Geotech-nique, 14, 95–102, 1964.
Stumpf, A., Malet, J.-P., Kerle, N., Niethammer, U., and Roth-mund, S.: Image-based mapping of surface fissures for the in-vestigation of landslide dynamics, Geomorphology, 186, 12–27, doi:10.1016/j.geomorph.2012.12.010, 2013.
Travelletti, J.: Imagerie multi-param`etres et multi-r´esolutions pour l’observation et la caract´erisation des m´ecanismes de glissements-coul´ees, PhD Thesis, University of Caen, France, 2011.
Travelletti, J. and Malet, J.-P.: Characterisation of the 3D geome-try of flow-like landslides: A methodology based on the integra-tion of heterogeneous multi-source data, Eng. Geol., 128, 30–48, 2012.
Travelletti, J., Delacourt, C., Allemand, P., Malet, J.-P., Schmit-tbuhl, J., Toussaint, R., and Bastard, M.: Correlation of multi-temporal ground-based optical images for landslide monitoring: application, potential and limitations, Journal of Photogramme-try and Remote Sensing, 70, 39–55, 2012.
Tsuboyama, Y., Sidle, R. C., Noguchi, S., and Hosada, I.: Flow and transport through the soil matrix and macropores of hillslope seg-ment, Water Resour. Res., 30, 879–890, 1994.
Uchida, T., Kosugi, K., and Mizuyama, T.: Effects of pipeflow on hydrological process and its relation to landslide: a review of pipeflow studies in forested headwater catchments, Hydrol. Pro-cess., 15, 2151–2174, 2001.
Van Asch, T. W. J., Hendriks, M. R., Hassel, R., and Rappange, F. E.: Hydrological triggering conditions of landslide in varved clays in the French Alps, Eng. Geol., 42, 239–251, 1996. Van Asch, T. W. J., Van Dijk, S. J. E., and Hendriks, M. R.: The role
of the overland flow and subsurface flow on spatial distribution of soil moisture in the top soil, Hydrol. Process., 15, 2325–2340, 2001.
Van Asch, T. W. J., Van Beek, L. P. H., and Bogaard, T. A.: Problems in predicting the mobility of slow-moving landslides, Eng. Geol., 91, 46–55, 2007.
Van Beek, L. P. H.: Assessment of the influence of changes in land use and climate on landslide activity in a Mediterranean environ-ment, PhD Thesis, University of Utrecht, Netherlands, 2002. Van Beek, L. P. H. and Van Asch, T. W. J.: A combined
concep-tual model for the effects of fissure-induced infiltration on slope stability, in: Process Modelling and Landform Evolution, Lect. Notes Earth Sci., 78, 147–167, doi:10.1007/BFb0009716, 1999. Van Beek, L. P. H. and Van Asch, Th. W. J.: Regional assessment of the effects of land-use change on landslide hazard by means of physically based modelling, Nat. Hazards, 31, 289–304, 2004. Van Schaik, L.: The role of macropore flow from plot to catchment
scale. A study in a semi-arid area, PhD Thesis, University of Utrecht, Netherlands, 2010.
Walter, M., Arnhardt, C., and Joswig, M.: Seismic monitoring of rockfalls, slide quakes, and fissure development at the Super-Sauze mudslide, French Alps, Eng. Geol., 128, 12–22, 2012. Weiler, M. and McDonnell, J. J.: Conceptualizing lateral
preferen-tial flow and flow networks and simulating the effects on gauged and ungauged hillslopes, Water Resour. Res., 43, W03403, doi:10.1029/2006WR004867, 2007.
Zehe, E. and Bl¨oschl, G.: Predictability of hydrologic response at the plot and catchment scales – the role of initial conditions, Water Resour. Res., 40, W10202, doi:10.1029/2003WR002869, 2004.
Zhang, G. P., Savenije, H. H. G., Fenicia, F., and Pfister, L.: Mod-elling subsurface storm flow with the Representative Elemen-tary Watershed (REW) approach: application to the Alzette River Basin, Hydrol. Earth Syst. Sci., 10, 937–955, doi:10.5194/hess-10-937-2006, 2006.