HAL Id: hal-02271252
https://hal.sorbonne-universite.fr/hal-02271252
Submitted on 26 Aug 2019HAL is a multi-disciplinary open access archive for the deposit and dissemination of sci-entific research documents, whether they are pub-lished or not. The documents may come from teaching and research institutions in France or abroad, or from public or private research centers.
L’archive ouverte pluridisciplinaire HAL, est destinée au dépôt et à la diffusion de documents scientifiques de niveau recherche, publiés ou non, émanant des établissements d’enseignement et de recherche français ou étrangers, des laboratoires publics ou privés.
Framework for patient-ventilator asynchrony during long
term non-invasive ventilation
Jesus Gonzalez-Bermejo, Jean-Paul Janssens, Claudio Rabec, Christophe
Perrin, Frédéric Lofaso, Bruno Langevin, Annalisa Carlucci, Manel Lujan
To cite this version:
Jesus Gonzalez-Bermejo, Jean-Paul Janssens, Claudio Rabec, Christophe Perrin, Frédéric Lofaso, et al.. Framework for patient-ventilator asynchrony during long term non-invasive ventilation. Thorax, BMJ Publishing Group, 2019, 74 (7), pp.715-717. �10.1136/thoraxjnl-2018-213022�. �hal-02271252�
Rationale of polygraphy to assess NIV efficacy
Framework for patient-ventilator asynchrony during long term non-invasive ventilation Jesus Gonzalez-Bermejo (1, 2), Jean-Paul Janssens (3), Claudio Rabec (4), Christophe Perrin (5), Frederic Lofaso (6), Bruno Langevin (7), Annalisa Carlucci (8), Manel Lujan (9,10) on behalf of the SomnoNIV group
(1) MD, PhD, Sorbonne Université-médecine, INSERM, UMRS1158 Neurophysiologie respiratoire expérimentale et clinique, Paris, France
(2) AP-HP, Groupe Hospitalier Pitié-Salpêtrière Charles Foix, Service de Pneumologie et Réanimation Médicale (Département "R3S"), F-75013, Paris, France
(3) MD, Division of Pulmonary Diseases, Geneva University Hospitals, Geneva, Switzerland (4) MD, Service de Pneumologie et Réanimation Respiratoire, Centre Hospitalier et Universitaire de Dijon, Dijon, France
(5) MD, PhD, Service de Pneumologie, Centre Hospitalier Princesse Grace, Monaco, Principauté de Monaco
(6) MD, Physiologie-Explorations Fonctionnelles, Hôpital Raymond Poincaré, Assistance Publique-hôpitaux de Paris, Garches, France
(7) MD, Service de réanimation, centre hospitalier, Ales, France
(8) MD, Pulmonary Rehabilitation, Istituti Clinici Scientifici, Maugeri, IRCCS, Pavia, Italy (9) MD, PhD. Pneumology Service. Corporació Parc Taulí. Institut Universitari Parc Taulí. Sabadell. Universitat Autònoma de Barcelona.
(10) CIBERES. Bunyola. Spain. Address for correspondence Pr Jésus Gonzalez-Bermejo
Service de pneumologie et réanimation GH Pitié-Salpêtrière
75651 Paris Cedex 13
E-mail: [email protected] Tel: +33 1 421 67859
Rationale of polygraphy to assess NIV efficacy
Keywords: non-invasive ventilation; home ventilators; asynchrony; obstructive sleep apnoea,
central sleep apnea; polysomnography; monitoring; sleep-disordered breathing
Short title: Polygraphic features of asynchrony under NIV Word count: 953
Title: 9 words Abstract: 92 words Figures and tables: 2 References: 8
Rationale of polygraphy to assess NIV efficacy Abstract:
Episodes of patient-ventilator asynchrony (PVA) occur during acute and chronic non-invasive positive pressure ventilation (NIV). In long term NIV, description and quantification of PVA is not standardized, thus limiting assessment of its clinical impact.
The present report provides a framework for a systematic analysis of polygraphic recordings of patients under NIV for the detection, and classification of PVA validated by bench testing. The algorithm described uses two different time windows: rate asynchrony, and intracycle asynchrony. This approach should facilitate further studies on prevalence and clinical impact of PVA in long term NIV.
Rationale of polygraphy to assess NIV efficacy Introduction
Nocturnal non-invasive ventilation (NIV) is an effective treatment for chronic hypercapnic respiratory failure, provided mainly overnight. Previous papers from our SomnoNIV group(1) suggested a systematic approach for monitoring nocturnal NIV and summarized the semiology of undesired events detected by polygraphy (PG) performed under NIV.(1) Patient ventilator asynchrony (PVA) under NIV was not emphasized in these publications, although it has been extensively described in intensive care (ICU) patients, with its clinical consequences.(2) Over the past 10 years, PVA has also been reported in a small number of studies performed on chronic NIV patients, using polygraphic assessment.(3–5) PVA is often pauci- or asymptomatic. In a recent report, adding parasternal EMG increased the prevalence of PVA to a remarkable 79% in 28 patients with obstructive and restrictive disorders during initiation of long-term NIV, but without any evidence of major physiological consequences.(6) There is therefore a lack of studies allowing an appropriate assessment of the prevalence and relevance of PVA in chronic NIV based on a consensual definition of events.
This report proposes a standardized systematic analysis and description of PVA in long term NIV using pressure and flow tracings from an external pneumotachograph combined with abdominal and thoracic belts to facilitate its identification, management and associated clinical research.(3,4)
Methods
Over a 2-year period, nocturnal PG tracings of patients during NIV were reviewed and thoroughly discussed by a multinational expert group in work sessions focusing on PVA. Definitions, description, pathophysiological mechanisms and classification of PVA presented here are 1/the result of a consensus between all participants, and 2/were reproduced on a bench test for reliability of description. (see online supplement for details). The reporting of PVA as described requires that leaks and residual upper airway obstruction have been dealt with and corrected.(1)
Results:
We found 9 different PVA all confirmed by bench reproduction.
PVA classification was based on a visual analysis of polygraphy tracings with two different time windows, leading to identification of i/rate asynchronies and ii/intracycle asynchronies
Rationale of polygraphy to assess NIV efficacy
(figure 1).
Rate asynchronies were defined as a mismatch between ventilator and patient rates (figure 2).
When ventilator rate was above patient’s rate, the following events were identified and described: “double triggering” (figure 2) ; “auto-triggering” and “uncoupling” with 2 particular variants i. "isolated uncoupling"(figure S5) and ii.“Reverse triggering” (figure S6) but without being able to reproduce it on the bench.
When the patient’s rate was above the ventilator rate, we identified this as “ineffective efforts” (figure S7).
When patient and ventilator rates were completely dissociated, we described this as “prolonged uncoupling” (figure S8).
Intracycle asynchronies (figure 2) were defined as distortions of the flow and pressure curves,
during inspiration and/or expiration. When a distortion of the inspiratory curves occured during any portion of the inspiratory cycle or lasts for the entire cycle, we reported this as “intracycle underassistance” (figure S9). This event results from an insufficient unloading of inspiratory effort. The degree of distortion of the flow curve will depend on the intensity and the timing of the patient’s effort.
A pressure-overshoot (figure S10) can occur at the beginning of the pressurization, in devices using fasts turbines.
When the end of the pressure and flow curves are out of phase with the thoracic and/or abdominal belts, we described this as delayed cycling (or long cycle) (figure S11) or premature cycling (or short cycle) (figure S12).
Suggestions for making the distinction between triggered and controlled cycles are detailed in the on-line supplement.
Discussion
The present report proposes a pragmatic non-invasive and systematic approach of patient-ventilator asynchrony (PVA) in the setting of chronic hypercapnic respiratory failure (CHRF) treated by non-invasive ventilation. The detailed description and classification of PVA events provided in this report are based on a visual analysis of polygraphic tracings. The patient’s respiratory efforts were analyzed using abdominal and thoracic tracings. Bench testing was used to confirm hypothesized mechanisms involved. It has been possible for all the events except one (only due to technical limits of the bench). Because leaks and residual upper airway
Rationale of polygraphy to assess NIV efficacy
obstructive events may generate per se patient-ventilator asynchrony, our approach deals with PVA only after having corrected leaks and upper airway obstruction.(1)
One obvious limitation of our suggested algorithm for analysis of PVA is the absence of gold-standard signals of inspiratory effort (such as esophageal pressure, Pdi, EAdi, diaphragmatic or parasternal EMG(6)). As shown in the ICU setting,(2) it is possible that detection and quantification of PVA according to this algorithm underestimates the number of events.
Alternative non-invasive signals of inspiratory muscle effort such as parasternal electroneuromyography (EMG),(6) although theoretically simpler and used in clinical studies, require expertise, and have limitations, such as postural artifacts and potential contamination of signals by other chest muscles.(5) Other signals of inspiratory effort, such as analysis of mandibular movements(7) have not been validated under NIV and require further testing. Pulse transit time, also an indicator of inspiratory effort,(8) although helpful to distinguish obstructive from central events under NIV, does not have the resolution and the precise time coupling for detecting unrewarded efforts or intra-cycle asynchronies.
We found that no PVA is specific/pathognomonic of a given pathophysiological situation. Management of PVA will have to integrate not only the type(s) of PVA identified according to the presented algorithm, but also the patient’s pulmonary mechanics and settings.
Clinical relevance and usefulness of searching for PVA in chronic NIV is also a critical issue and requires further studies.
In summary, the present report provides a pragmatic approach for a systematic analysis of PVA in patients under long term NIV. Standardizing the analysis of PVA, which occurs frequently in long term NIV, will be helpful for future clinical studies exploring the impact of PVA on comfort, efficacy of NIV, morbidity, and mortality.
Rationale of polygraphy to assess NIV efficacy
Acknowledgments,
Fabienne Duguet (SPLF) and Sylvie Rouault for their logistic support Camille Rolland-Debord, for her help for the bibliography
Claudia Llontop, Capucine Morelot, Maria Alejandra Galarza-Gimenez and Monica González for providing traces
Alberto Mangas-Moro for his help with the figures
Competing interests,
All authors declare having no conflict of interest in relation to this manuscript
Rationale of polygraphy to assess NIV efficacy
Legends of the Figures:
Figure 1: Algorithm for analysis of PVA by type III polygraphy performed under NIV Figure 2: Patient/ventilator interaction, aspect of curves and EMG (electromyography) for each PVA.
T = triggered cycle, C = controlled cycle, P = inspiratory effort, 0 = no inspiratory effort,
ø
= no pressurization response.Rationale of polygraphy to assess NIV efficacy References
1. Gonzalez-Bermejo J, Perrin C, Janssens JP, Pepin JL, Mroue G, Léger P, et al. Proposal for a systematic analysis of polygraphy or polysomnography for identifying and scoring abnormal events occurring during non-invasive ventilation. Thorax. juin
2012;67(6):546‑52.
2. Vaporidi K, Babalis D, Chytas A, Lilitsis E, Kondili E, Amargianitakis V, Chouvarda I, Maglaveras N, Georgopoulos D, (2017) Clusters of ineffective efforts during mechanical ventilation: impact on outcome. Intensive care medicine 43: 184-191
3. Guo YF, Sforza E, Janssens JP. Respiratory patterns during sleep in
obesity-hypoventilation patients treated with nocturnal pressure support: a preliminary report. Chest. avr 2007;131(4):1090‑9.
4. Fanfulla F, Taurino AE, Lupo ND, Trentin R, D’Ambrosio C, Nava S. Effect of sleep on patient/ventilator asynchrony in patients undergoing chronic non-invasive mechanical ventilation. Respir Med. août 2007;101(8):1702‑7.
5. Aarrestad S, Qvarfort M, Kleiven AL, Tollefsen E, Skjønsberg OH, Janssens J-P. Sleep related respiratory events during non-invasive ventilation of patients with chronic hypoventilation. Respir Med. nov 2017;132:210‑6.
6. Ramsay M, Mandal S, Suh E-S, Steier J, Douiri A, Murphy PB, et al. Parasternal electromyography to determine the relationship between patient-ventilator asynchrony and nocturnal gas exchange during home mechanical ventilation set-up. Thorax. oct
2015;70(10):946‑52.
7. Martinot J-B, Senny F, Denison S, Cuthbert V, Gueulette E, Guénard H, et al.
Mandibular movements identify respiratory effort in pediatric obstructive sleep apnea. J Clin Sleep Med JCSM Off Publ Am Acad Sleep Med. 15 avr 2015;11(5):567‑74.
8. Contal O, Carnevale C, Borel J-C, Sabil A, Tamisier R, Lévy P, et al. Pulse transit time as a measure of respiratory effort under noninvasive ventilation. Eur Respir J. févr 2013;41(2):346‑53.
ONLINE supplement
Methods
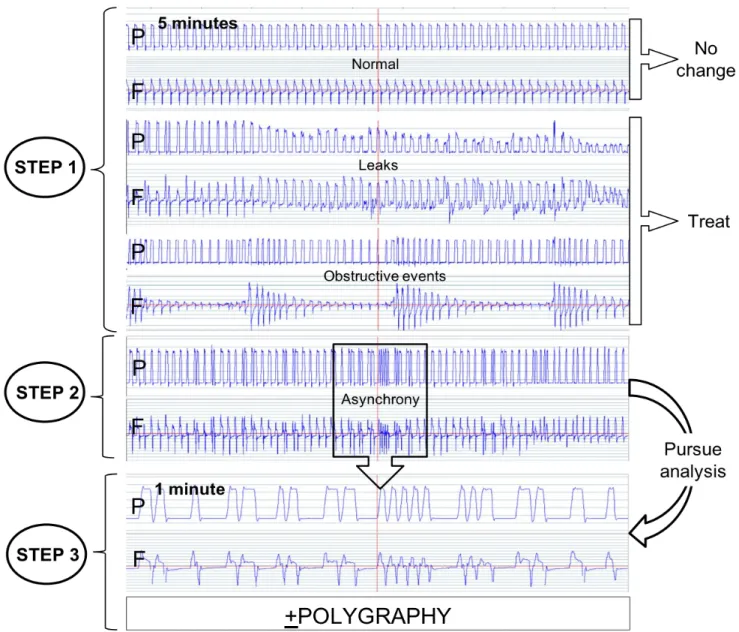
1) Algorithm of analysis (Figure 1)
Step 1: Eliminate leaks and/or obstructive events (1):
The first step is, by a visual analysis of the traces, to eliminate major leaks and/or upper airway obstructive events because this creates optimal conditions for PVA (2–5)
Leaks and obstructive events were detected by analysing a 5 -10 min. window on a PG recording (Figure S1). As previously described (1), the following items were suggestive of leaks: an increase in amplitude of inspiratory flow, a decrease in amplitude of abdominal and thoracic belt signals, a decrease in pressure signal amplitude if leaks are of sufficient magnitude, an amputation of the expiratory flow signal, and often a reversion of ventilator to back-up respiratory frequency with PVA (1).
Upper airway obstruction with persistence of ventilatory drive will cause a phase opposition or phase angle between thoracic and abdominal belts; a decrease of ventilatory drive will lead to a simultaneous dampening of amplitude of thoracic and abdominal belt signals (1).
Step 2: After correction of leaks and/or obstructive events, we determined whether asynchronism was still present?
Once leaks and residual upper airway obstruction have been identified and corrected, the second step is to determine whether PVA persisted or not. PVA was detected by analysing a 1-5 min. window on a PG recording (Figure S1), seeking for any dissociation between patient and ventilator signals, searching for rate asynchrony (ventilator vs. patient respiratory rate; or intra-cycle asynchrony (Table 1)).
Step 3: Visual classification of the asynchronism
PVA was considered as: - rate asynchrony when:
i. ventilator rate was higher than that of the patient or
ii. patient’s respiratory rate higher than that of the ventilator or
iii. when rates of the ventilator and the patient were totally dissociated, - “intracycle” asynchrony when:
i. the flow generated by the ventilator did not match the patient's inspiratory flow (referred to as flow asynchrony), or
ii. when pressurization was too short or too long compared to patient demand (referred to as phase asynchrony, with premature or delayed cycling).
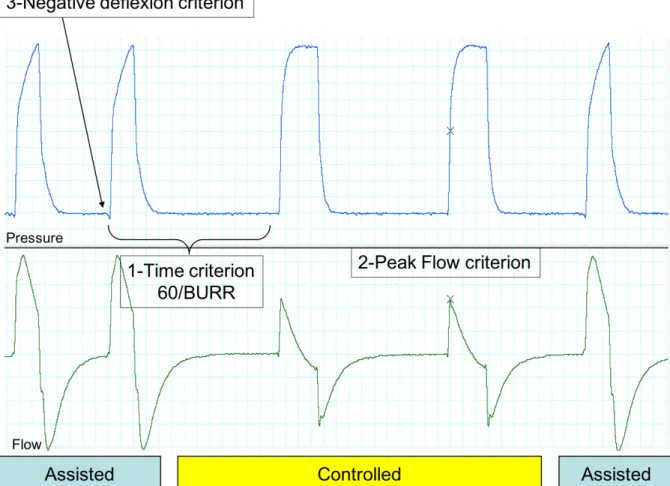
Step 4: Further classification required differentiating “controlled” from “triggered” cycles
A “controlled cycle” was defined as a pressurization by the ventilator irrespective of patient’s
efforts, following a back-up respiratory rate set by the clinician.
A “triggered cycle” was defined as a cycle triggered by a change in inspiratory flow or pressure
(according to the type of inspiratory trigger) detected by the ventilator. This cycle may correspond to an inspiratory effort generated by the patient (assisted cycle) or not (auto-triggering).
Making a reliable distinction between controlled and triggered cycles requires a electromyogram and/or an oesophageal balloon catheter, which are invasive, source of patient discomfort and most often not available in routine clinical practice. Without this information, some items were useful for distinguishing controlled vs. triggered cycles: time criterion, flow criterion and pre-cycle criterion (figure S2):
1. A time criterion: a cycle is probably controlled if the time lapse between its onset and that of inspiration of the preceding cycle is equal to [60/back-up respiratory rate].
2. A flow criterion: the peak inspiratory flow in controlled cycles should be lower than in assisted cycles, because there is no additional inspiratory effort provided by the patient. 3. A pre-cycle criterion: identifying a negative deflexion on the pressure tracing and a simultaneous positive deflexion in inspiratory flow (inspiratory trigger) just before the ventilator pressurizes defines a triggered cycle (these signs require a good resolution of the monitoring system and also depends on the intensity of inspiratory effort).
2) Bench
Bench tests were performed with the goal of confirming the respiratory events detected on the tracings during the meetings of the work group and by reproducing their hypothesized
Hans Rudolph 1101 Series simulator (Hans Rudolph, Shawnee, KS, USA) was connected to a home care ventilator through a single limb tubing with an intentional leak. The semiology of the tracings was reproduced by modifying the following features in the model:
a. The mechanical properties in the simulator (resistance and compliance of the “patient component”). Three different patterns were defined: 1/ Restrictive: resistance (R)=5 cm H2O/ L/sec and compliance (C) = 30 mL/cm H2O; 2/ Obstructive: R=20 cm H2O/ L/sec
and C=70 mL/cm H2O and 3/ Normal R=7.5 cm H2O/ L/sec and C=70 mL/cm H2O.
b. Inspiratory effort (intensity, duration and shape). Grading of effort: low intensity=-4 cm H2O; medium intensity= -8 to -10 cm H2O; high intensity= -15 to -20 cmH2O. Duration
and shape were programmed by default at 30 % of the inspiratory cycle with a symmetric profile and were modified accordingly.
c. The active respiratory backup rate in the simulator (“patient” backup rate). d. When required, an external additional leak was introduced
Each combination of parameters was selected according to the most likely pathophysiologic mechanism of the asynchrony to be reproduced. For example, for auto-triggering, a restrictive pattern with increased leakage was used; for short cycle and double triggering, a longer effort than usual was selected. Tracings were displayed with the built-in software of the simulator and, whenever possible, the screenshot were divided into two parts (with and without asynchrony) to highlight the changes. In some cases, an external monitoring system (Powerlab 16 SP, AD instruments, Australia) with an external pneumotachograph (S-300 model) and a pressure transducer (H1150) were used.
References
1. Gonzalez-Bermejo J, Perrin C, Janssens JP, Pepin JL, Mroue G, Léger P, et al. Proposal for a systematic analysis of polygraphy or polysomnography for identifying and scoring abnormal events occurring during non-invasive ventilation. Thorax. juin
2012;67(6):546‑52.
2. Vignaux L, Vargas F, Roeseler J, Tassaux D, Thille AW, Kossowsky MP, et al. Patient-ventilator asynchrony during non-invasive ventilation for acute respiratory failure: a multicenter study. Intensive Care Med. mai 2009;35(5):840‑6.
3. Crescimanno G, Canino M, Marrone O. Asynchronies and sleep disruption in neuromuscular patients under home noninvasive ventilation. Respir Med. oct
2012;106(10):1478‑85.
4. Carteaux G, Lyazidi A, Cordoba-Izquierdo A, Vignaux L, Jolliet P, Thille AW, et al. Patient-ventilator asynchrony during noninvasive ventilation: a bench and clinical study. Chest. août 2012;142(2):367‑76.
5. Mehta S, McCool FD, Hill NS. Leak compensation in positive pressure ventilators: a lung model study. Eur Respir J. févr 2001;17(2):259‑67.
ONLINE supplement:
DETAILED SEMIOLOGY
This section includes figures and comments which illustrate the following items:
Figure S1: Step-by-step analysis of a polygraphy under NIV: illustrative tracings p 2 Figure S2: Criteria to distinguish assisted from controlled cycles. p 3
1) Rate asynchronies
Figures S3: Double triggering (patient and bench tracings) p 4-5
Figures S4: Auto triggering p 6-7
Uncoupling: comment p 8
Figures S5: Uncoupling p 9-10
Figure S6: Reverse triggering p 11
Ineffective efforts: comment p 12
Figures S7: Ineffective effort p 12-13
Figure S8: Prolonged uncoupling p 14
2) Intracycle asynchronies p 15
Underassistance: comment p 15
Figure S9a: Underassistance during the whole cycle p 16 Figure S9b: Underassistance in the middle of the cycle p 17
Overshoot: comment p 18
Figures S10: Overshoot p 18-19
Delayed cycling: comment p 20
Figure S11a: Delayed cycling with expiratory effort p 21 Figure S11b: Delayed cycling with passive inflation p 22
Figure S12: Premature cycling p 23-24
Figure S2: Criteria to distinguish assisted from controlled cycles. 1: When time span between cycles is equal to (60/BURR), cycle is most probably controlled; 2: Flow is decreased when cycles are
controlled, because there is no inspiratory effort provided by the patient (Peak Flow Criterion); 3: Negative deflexion results from inspiratory effort. BURR: Back Up Respiratory Rate
1) RATE ASYNCHRONIES
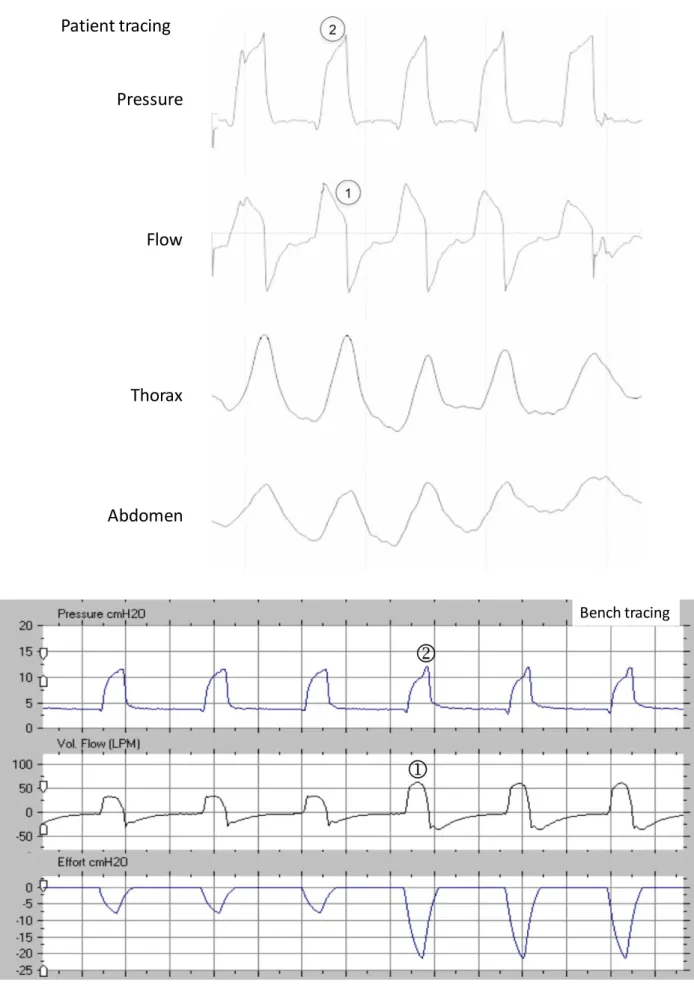
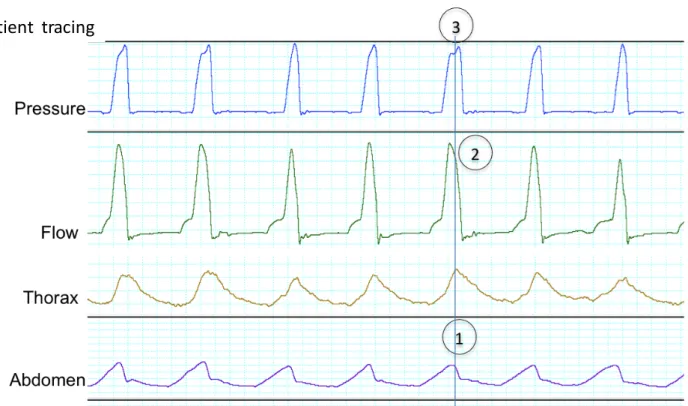
Figure S3: Double triggering in a patient (from top to bottom: pressure, flow, thoracic and abdominal belts) and reproduced on the bench (from top to bottom: pressure, flow and simulated inspiratory effort). The ventilator initiates two assisted cycles for one prolonged demand of the patient.
Two cycles are noted on the pressure and flow curves,[1] while there is only one on the abdominal belt[2]; there is a characteristic “M” form[2] on the thoracic belt without return to expiratory level between cycles[2]
Classically:
• the second cycle is shorter[3];
• the peak flow of the second cycle is lower than the first but never flat:[4]
• when expiratory flow tracing is available, the negative flow between both cycles should be less negative than the reference expiratory flow (due to patient’s persisting inspiratory effort between the two cycles).[5]
Figure S4: Auto triggering in a patient (from top to bottom: pressure, flow, thoracic and abdominal belts, EMG: parasternal muscles electromyography), reproduced on the bench (following page: from top to bottom: pressure, flow and simulated inspiratory effort). The ventilator initiates two or more cycles at a rate that is higher than the patient’s.
During bursts of auto-triggered cycles, pressure and flow curves are similar[1], while the thoraco/abdominal belts tracings are at a lower respiratory rate (synchronized or not)[2]; the EMG confirms that patient’s inspiratory efforts are not synchronized with the ventilator pressurizations[3]
Patient tracing
Pressure
Flow
Thorax
Abdomen
EMG
Bench tracingUncoupling:
Uncoupling is a mismatch between the back-up rate of the ventilator and the patient’s spontaneous respiratory rate. It can only occur if there is a back-up rate. Usually appears as two cycles, the first cycle controlled (initiated by the ventilator) without any movement of the belts and the second assisted (i.e. with an inspiratory effort). We noted 2 variants :
1."isolated uncoupling"(figure S5): an isolated ineffective controlled cycle is followed by an effective assisted cycle. Reported as “double trigger-premature termination” by Mellot and coll[1] or
“autocycling” by Ramsay and coll.[2]
2. “Reverse triggering”[3]: a controlled cycle produces a movement of the thorax that generates an assisted cycle induced by a contraction of inspiratory muscles. Inspiratory efforts occurred near the end of each mechanical inspiration in a repetitive and consistent manner
Figure S5: Isolated uncoupling, in a patient (from top to bottom: pressure, flow, thoracic and abdominal belts), and reproduced on the bench (from top to bottom: pressure, flow and simulated inspiratory effort).
The ventilator initiates a controlled cycle,[1] unexpected by the patient, which induces only a small expansion of the thorax/abdomen.[2] The patient is perfectly synchronized during the assisted cycles[3]. The time span between the controlled and assisted cycles is variable.[4]
Patient tracing
Figure S6:
Reverse triggering in a patient (from top to bottom: pressure, flow, thoracic and abdominal belts). Reverse triggering cannot be reproduced with the bench simulator because the mechanism is linked to the patient. The ventilator initiates a controlled cycle[1] which expands the thorax[2]; this triggers an assisted cycle[3]. The time span between the controlled and assisted cycles is always the same:[1-3]. The pressure signal shows two cycles and the abdominal/thoracic belts show two synchronized movements.[4] Patient tracing Pressure Flow Thorax Abdomen Pressure Flow Thorax Abdomen
Ineffective efforts (also referred to as unrewarded efforts): One or several inspiratory efforts of the patient are not followed by assisted cycles. The same mechanism (non detection or late detection of inspiratory effort) can cause a delayed triggering, i.e. a variable lag time between onset of inspiratory effort on the thoracic and/or abdominal belts and pressurization. This can also be detected on the flow tracing as a small positive deflection prior to the delivery of assisted breath (delta sign).
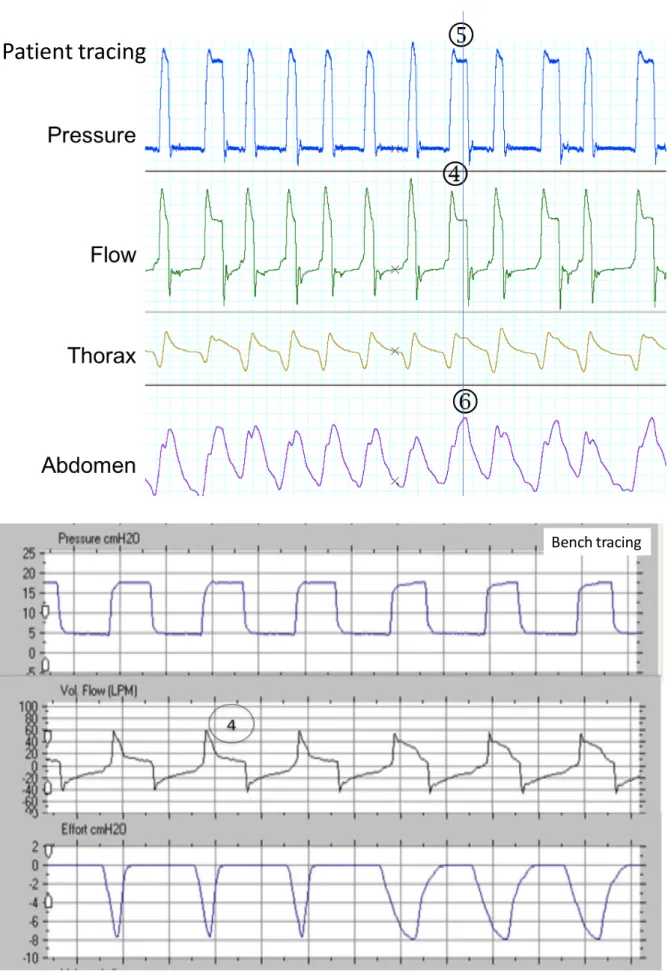
Figures S7: Ineffective effort, in a patient (from top to bottom: pressure, flow, thoracic and abdominal belts), and reproduced on the bench (from top to bottom: pressure, flow and simulated inspiratory effort). An inspiratory effort is not followed by an assisted cycle of the ventilator.
There is a movement of the belts 1] + and the flow curve 2] not followed by an assisted cycle on the pressure and flow curves.[3]
In one cycle, the effort starts just before the cycle, there is a sudden reduction in expiratory flow generating a “delta sign”.[4]
Patient tracing
Prolonged uncoupling is a prolonged and complete dissociation between the patient and the ventilator. Respiratory rate of the ventilator and that of the patient are clearly different but are not a multiple of each other.
Figures S8: prolonged uncoupling in a patient and (from top to bottom: pressure, flow, thoracic and abdominal belts) and reproduced on a bench (from top to bottom: pressure, flow and simulated inspiratory effort).. The pressure signal and the belts are completely dissociated.
Patient tracing
2) INTRACYCLE ASYNCHRONIES
Intracycle asynchronies appeared as distortions of the flow and pressure curves, during inspiration and/or expiration (flow asynchrony).
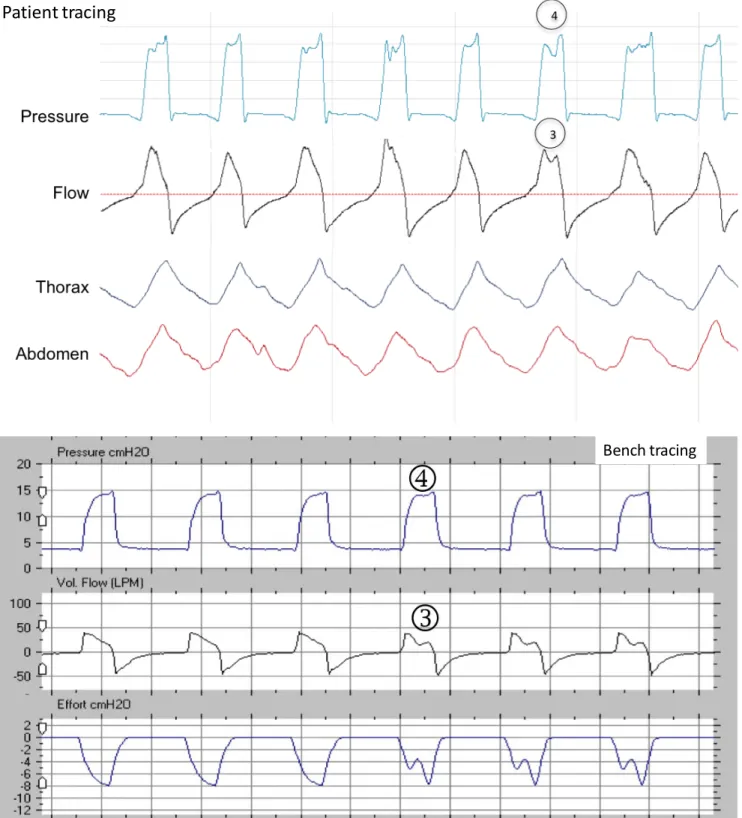
Figures S9: Underassistance in a patient (from top to bottom: pressure, flow, thoracic and abdominal belts), and reproduced on the bench (from top to bottom: pressure, flow and simulated inspiratory effort). The overall mechanism is that the patient’s demand is not met by the ventilator flow.
S9a. Underassistance during the pressurization phase and the whole cycle. The flow curve presents a high peak flow and an abrupt fall[1]; there is simultaneously a decreased slope in the ascending portion of the pressure curve[2], reaching later the IPAP value. In this case, the cycle does not achieve the set IPAP level, indicating that the cycle is flow-limited.
S9b With underassistance in the middle of the cycle, the flow waveform shows a positive wave in the second half of the inspiratory cycle[3] whereas the pressure waveform shows a small negative (level below IPAP) deflection in the second half of the inspiratory cycle (corresponding to the inspiratory effort of the patient).[4]
Figure S9a: Underassistance during the whole cycle Pressure Flow Thorax Abdomen Patient tracing Bench tracing
Figure S9b: Underassistance in the middle of the cycle
Patient tracing
Overshoot: with some devices, in case of a high inspiratory effort from the patient, a pressure-overshoot can occur. (due to a too high answer of the turbine)
Figure S10: Overshoot in a patient on the upper panel (from top to bottom: pressure, flow, thoracic and abdominal belts) and reproduced on the bench on the lower panel (from top to bottom: pressure, flow and simulated inspiratory effort).
A transient increase is seen at the beginning of the cycle both on the pressure (above the set pressure = overshoot)[1] and the flow[2] curves due to patient's effort.
Patient tracing
Delayed cycling also called « long cycle » or « late cycling »
Delayed cycling, also called « late cycling », in a patient, and reproduced on the bench (from top to bottom: pressure, flow and simulated inspiratory effort). Patient’s demand or patient’s Ti (Tip) is shorter than the Ti of the ventilator (Tiv). When Tiv exceeds Tip, there are two different possibilities.
Figure S11a: (from top to bottom: pressure, flow, thoracic and abdominal belts): the patient’s expiration starts when the ventilator remains still in inspiration [1]. The active expiration of the patient decreases inspiratory flow until the cycling-off criterion is reached and normal expiration begins.[2] Sometimes, if the expiratory effort is hard enough, a pre-expiratory peak can be seen in pressure-time curve.[3] Note : here, one of the mechanisms leading to delayed cycling is a delayed triggering.
Figure S11b: (from top to bottom: pressure, flow, thoracic and abdominal belts): In case of passive inflation of the thorax, 2 time constants in the flow waveform within the same cycle may be identified; the first half (“effort dependent”) has a more pronounced slope[4] than the second half (“non effort dependent”) and there is no negative deflection in the plateau of pressure/time curve (compared with intracycle effort: Figure S9b). [5] The end of inspiration in belts in both cases is synchronous with the end of ventilator cycle.[6]
Figure S11a : Delayed cycling with expiratory effort
Patient tracing
Figure S11b: Delayed cycling with passive inflation
Patient tracing
Premature cycling
Figures S12: Premature cycling in a patient (from top to bottom: pressure, flow, thoracic and abdominal belts), and reproduced on the bench (from top to bottom: pressure, flow and simulated inspiratory effort). In case of premature expiratory cycling, the demand of the patient continues as the ventilator has already cycled into expiration. Thoraco-abdominal band movement continues outwards [1] the Ti on the pressure and flow curve [2]. A smaller second positive flow can appear just after the first flow [3]. Note: a double triggering (empty circle) appears on the same trace.
Patient tracing
3) References
1. Mellott KG, Grap MJ, Munro CL, Sessler CN, Wetzel PA, Nilsestuen JO, et al. Patient ventilator asynchrony in critically ill adults: frequency and types. Heart Lung J Crit Care. juin 2014;43(3):231‑43.
2. Ramsay M, Mandal S, Suh E-S, Steier J, Douiri A, Murphy PB, et al. Parasternal
electromyography to determine the relationship between patient-ventilator asynchrony and nocturnal gas exchange during home mechanical ventilation set-up. Thorax. oct 2015;70(10):946‑52.
3. Akoumianaki E, Lyazidi A, Rey N, Matamis D, Perez-Martinez N, Giraud R, et al. Mechanical ventilation-induced reverse-triggered breaths: a frequently unrecognized form of neuromechanical coupling. Chest. avr 2013;143(4):927‑38.
Ventilator rate > patient rate Completely dissociated rates Patient rate > ventilatory rate Double triggering Ineffective efforts Auto triggering Uncoupling Complete uncoupling Pressure Flow Particularity in semeiology Mechanism Belts EMG Who does what?
Ventilator Patient P 0 0 P P P 0 P 0 P 0 T T T T C T Ø Ø C Ø C Ø C or or or Treatment Pressure Flow Semeiology Mechanism Flow asynchronies
Normal cycle Phase asynchronies
Underassistance Overshoot Delayed cycling
Entire cycle Second half Passive inflation Expiratory effort
Belts
EMG