HAL Id: hal-01718559
https://hal.archives-ouvertes.fr/hal-01718559
Submitted on 3 Jun 2021
HAL is a multi-disciplinary open access
archive for the deposit and dissemination of
sci-entific research documents, whether they are
pub-lished or not. The documents may come from
teaching and research institutions in France or
abroad, or from public or private research centers.
L’archive ouverte pluridisciplinaire HAL, est
destinée au dépôt et à la diffusion de documents
scientifiques de niveau recherche, publiés ou non,
émanant des établissements d’enseignement et de
recherche français ou étrangers, des laboratoires
publics ou privés.
Distributed under a Creative Commons Attribution| 4.0 International License
Ulf Schmitz, Natalia Pinello, Fangzhi Jia, Sultan Alasmari, William Ritchie,
Maria-Cristina Keightley, Shaniko Shini, Graham Lieschke, Justin J-L Wong,
John Rasko
To cite this version:
Ulf Schmitz, Natalia Pinello, Fangzhi Jia, Sultan Alasmari, William Ritchie, et al.. Intron retention
enhances gene regulatory complexity in vertebrates. Genome Biology, BioMed Central, 2017, 18 (1),
pp.216. �10.1186/s13059-017-1339-3�. �hal-01718559�
R E S E A R C H
Open Access
Intron retention enhances gene regulatory
complexity in vertebrates
Ulf Schmitz
1,2, Natalia Pinello
1,2,3, Fangzhi Jia
1,2, Sultan Alasmari
4, William Ritchie
5, Maria-Cristina Keightley
4,
Shaniko Shini
6, Graham J. Lieschke
4, Justin J-L Wong
1,2,3†and John E. J. Rasko
1,2,7,8*†Abstract
Background: While intron retention (IR) is now widely accepted as an important mechanism of mammalian gene expression control, it remains the least studied form of alternative splicing. To delineate conserved features of IR, we performed an exhaustive phylogenetic analysis in a highly purified and functionally defined cell type comprising neutrophilic granulocytes from five vertebrate species spanning 430 million years of evolution.
Results: Our RNA-sequencing-based analysis suggests that IR increases gene regulatory complexity, which is indicated by a strong anti-correlation between the number of genes affected by IR and the number of protein-coding genes in the genome of individual species. Our results confirm that IR affects many orthologous or functionally related genes in granulocytes. Further analysis uncovers new and unanticipated conserved characteristics of intron-retaining transcripts. We find that intron-retaining genes are transcriptionally co-regulated from bidirectional promoters. Intron-retaining genes have significantly longer 3′ UTR sequences, with a corresponding increase in microRNA binding sites, some of which include highly conserved sequence motifs. This suggests that intron-retaining genes are highly regulated post-transcriptionally.
Conclusions: Our study provides unique insights concerning the role of IR as a robust and evolutionarily conserved mechanism of gene expression regulation. Our findings enhance our understanding of gene regulatory complexity by adding another contributor to evolutionary adaptation.
Keywords: Transcriptomic complexity, Granulocytes, Evolution, Alternative splicing, Intron retention, Gene regulation Background
Most multi-exon genes (~95%) have more than one alter-native splice form due to exon skipping/inclusion, alterna-tive 3′ and 5′ splice site selection, or through intron retention (IR) [1]. Of these modes of alternative splicing, IR is unique as it does typically not contribute to prote-omic diversity. IR affects transcripts from up to three-quarters of multi-exonic genes in mammals, yet remains the least understood mode of alternative splicing [2–5].
IR occurs physiologically when the splicing machinery fails to excise introns from primary messenger RNA (mRNA) transcripts leading to the inclusion of premature
termination codons (PTCs) in most intron-retaining tran-scripts [6]. As a consequence, intron-retaining mRNA transcripts are susceptible to degradation via nonsense-mediated decay (NMD) [6, 7]. Thus, IR can reduce gene expression at the post-transcriptional level and thereby imposes an additional level of gene regulation. Indeed, we have shown previously that IR-triggered NMD in differ-entiating myeloid cells reduces the abundance of cog-nate RNA and proteins [3]. In this context, several studies have subsequently reported transcripts with in-cluded introns detained in the nucleus and not suscep-tible to NMD [2, 8–12]. Additionally, there are several alternative hypotheses concerning the biological func-tions of IR [6, 13]. Intron-retaining transcripts may act as sentinel RNAs ready to be spliced and translated on de-mand, thereby inducing more rapid protein production than de novo transcription and translation [5, 10, 14]. Other downstream effects of IR include the synthesis of novel peptides or protein isoforms, the suppression of
* Correspondence:[email protected] †Equal contributors
1
Gene & Stem Cell Therapy Program, Centenary Institute, University of Sydney, Camperdown 2050, NSW, Australia
2Sydney Medical School, University of Sydney, Camperdown 2050, NSW, Australia
Full list of author information is available at the end of the article
© The Author(s). 2017 Open Access This article is distributed under the terms of the Creative Commons Attribution 4.0 International License (http://creativecommons.org/licenses/by/4.0/), which permits unrestricted use, distribution, and reproduction in any medium, provided you give appropriate credit to the original author(s) and the source, provide a link to the Creative Commons license, and indicate if changes were made. The Creative Commons Public Domain Dedication waiver (http://creativecommons.org/publicdomain/zero/1.0/) applies to the data made available in this article, unless otherwise stated.
protein and/or non-coding RNA (ncRNA) synthesis and the regulation of nuclear mRNA export [2, 3, 15–17]. Nor-mal regulation of IR is essential for physiological cell func-tions including differentiation capacity and aberrant IR leads to human diseases including cancer [18–21].
Retained introns are known to contain, on average, a higher density of GC nucleotides and are shorter in length compared to non-retained introns [2, 3]. We and others have demonstrated that IR is a conserved mech-anism that affects functionally related genes in humans and mice [2, 3, 8]. Although IR has been shown to be conserved across several vertebrate species at a tissue level, such as in the nervous system and brain [2], a thorough analysis of IR in a highly purified and function-ally defined cell type has been lacking.
In an evolutionary context, the expansion of alterna-tive splicing has been associated with increased tran-scriptomic complexity [22]. Although the frequency of alternative splicing reduces with evolutionary distance from primates [23], it is not known whether this is also a characteristic of IR. We aimed to determine whether IR contributes to transcriptomic complexity, to reveal af-fected biological processes, and to define specific con-served features. To achieve these goals, we analyzed IR in highly purified neutrophilic granulocytes from three mammalian species, one avian and one representative of the teleost fish, i.e. in total, five vertebrate species span-ning 430 million years of evolution (Table 1) [24].
Investigation of IR in a cell type with conserved func-tion across diverse species can potentially reveal unique characteristics, which would otherwise be masked when studying mixed populations of cells [2]. Neutrophilic granulocytes offer a discrete, well-defined cell type with phylogenetically conserved functions that serve as an excellent exemplar to study mechanisms of gene expression control. They are the most abundant cells of the innate immune system and consistently exhibit potent anti-microbial defenses since before the evolu-tionary divergence of teleost fish [25]. Our experimen-tal design provides a tightly controlled model that allowed us to examine the relationship between IR and transcriptomic complexity.
We demonstrate that IR affects many orthologous or functionally related genes and that intron-retaining tran-scripts have very similar characteristics in all species in-vestigated. For example, we found that intron-retaining genes are transcriptionally regulated from bidirectional promoters. The strong anti-correlation between the number of genes affected by IR and the number of protein-coding genes in the genome of individual species suggests that IR provides a mechanism of enhancing transcriptomic complexity.
It is unknown whether IR acts independently of other post-transcriptional mechanisms of gene expression con-trol. In examining the relationship between IR and microRNA (miRNA)-mediated gene regulation we found that intron-retaining genes have significantly longer 3′ UTR sequences that are enriched for miRNA binding sites. Our results suggest that IR is an evolutionary well-conserved form of alternative splicing that orchestrates post-transcriptional gene expression control.
Results
The function of IR is conserved over 430 million years We have shown previously that IR affects similar bio-logical processes during hematopoietic differentiation in human and mouse [3]. To study the functional conserva-tion of IR events in species spanning 430 million years, we identified IR in terminally differentiated granulocytes using the IRFinder algorithm [26] (see “Methods”). For every intron the algorithm computes the IR ratio (in the range of 0–1), which is an approximation of the propor-tion of total transcripts that retained the given intron. More specifically, the IR ratio is the ratio of the median read coverage of the intron to that of its flanking exons. We defined a threshold for the IR ratio (IR_ratio = 0.1) in order to consider only biologically meaningful cases of IR for further analysis.
Of the five species, the representative of the ray-finned fishes (zebrafish) has the lowest fraction of expressed genes that are affected by IR (7.8%). The group of more closely related mammalian species have a similar IR abun-dance with 13.6% of the expressed genes affected in Table 1 Genomic characteristics of intron-retaining mammalian and vertebrate species
Genome size (GB) Chromosomes pc genes nc genes sRNA lncRNA Pseudogenes GC (%) Introns
Mb (%)a Human 3.5 46 20,296 25,173 7703 14,889 14,424 41.3 1512.7 (52.2) Mouse 3.4 40 22,547 12,583 5530 6489 8770 42.3 992.7 (37.4) Dog 2.3 78 19,856 3774 3348 426 950 41.3 796.6 (33.3) Chicken 1.07 78 15,508 1558 1408 150 42 41.9 403.1 (39.0) Zebrafish 1.46 50 25,642 6008 3172 2741 293 36.7 722.2 (52.7)
Sources of information are indicated in the“Methods” section. Data on introns were determined using the featureBits program of the UCSC genome browser.
a
Percent of the genome
mouse, 17.4% in human, and 18.6% in dog. The exception in this study is the avian representative, in which a great proportion of expressed genes (40.8%) retained one or more introns in their mRNA transcripts (Fig. 1a). Taken together, in all five species we found a considerable fraction of expressed genes that are affected by IR (see Additional file 1).
Next, we clustered all known orthologous genes based on their IR pattern in the five species under investiga-tion. We found gene clusters in which IR events are
exclusive to one particular species. While these species-specific clusters represent distinct sets of genes, annota-tion enrichment analysis revealed that similar terms are over-represented in association with all of these gene sets, as well as those in which the IR pattern is similar in several or all species (Additional file 2: Figure S1). This suggests that IR is a global control mechanism affecting functionally conserved biological processes independent of specific effector genes. Although we note that mutually enriched terms are rather general, they differ from terms
786 560 651 2556 422 37 157 490 269 206 39 67 277 486 398 71 27 200 320 325 28 31 59 77 258 51 32 392 70 53 86 786 560 651 2556 422 37 157 490 269 206 39 67 277 486 398 71 27 200 320 325 28 31 59 77 258 51 32 392 70 53 86 786 560 651 2556 422 37 157 490 269 206 39 67 277 486 398 71 27 200 320 325 28 31 59 77 258 51 32 392 70 53 86
a b
90.9 429.6 320.5 97.5 Mya Granulocytes 17.38 % 13.64 % 18.63 % 7.80 % 10% 30% 50% Percent genes affected by IR40.80 % Human Mouse Dog Chicken Zebrafish
c
6 7 8 9 0.1 0.2 0.3 0.4 0.5IR per kbp exon sequence
Introns human mouse dog chicken zebrafish per kbp e xon sequence r = −0.95 0.1 0.2 0.3 0.4 15.0 17.5 20.0 22.5 25.0 Protein coding genes (x103 )
F
raction of
intron retaining genes
d
e
Fig. 1 IR conservation in mammalian and vertebrate species. a Phylogenetic tree of species under investigation and morphology of FACS sorted human, mouse, dog, chicken, and zebrafish granulocytes (Mya = million years ago) following Giemsa or Wright staining. The horizontal bar plot shows the fraction of expressed genes affected by IR in each species. b The five-way symmetric Venn diagram shows the intersections of orthologous intron-retaining genes between species. Eighty-six orthologs are conjointly affected by IR in all five species. The three-way asymmetric Venn diagram shows the intersecting gene sets of intron-retaining orthologs in placental mammals (human, mouse, dog), while the asymmetric two-way Venn diagram below illustrates the intersection of intron-retaining orthologs in the non-placental vertebrates (chicken and zebrafish). c Circos plot illustrating links between genes and annotation terms that are repeatedly enriched in the species-specific gene clusters. The right semicircle depicts the enriched terms. The left semicircle includes five concentric rings that represent color-coded IR ratios of orthologous genes in all five species, starting from human (H), mouse (M), dog (D), chicken (C), and zebrafish (Z). Left: A magnified section of the concentric rings. Orthologous genes sometimes do not have consistent IR values across the species; however, the IR functional specificity is conserved by targeting functionally related genes. A scalable version of this figure in vector format is provided in Additional file 5. d IR data from granulocytes exhibits a strong anti-correlation (Pearson correlation; r =–0.95) between the fraction of expressed intron-retaining genes and the number of protein-coding genes in a genome. e Number of retained introns per kbp exon sequence in relation to the average number of introns per kpb exon sequence in a genome
that were found enriched in other studies of IR in purified cells (Additional file 2: Table S1).
Interestingly, functionally enriched classes of genes in-clude phosphoproteins, kinases, and genes involved in alternative splicing, i.e. groups of intron-retaining genes that realize a multitude of gene expression and protein activity control mechanisms. Consistent with this func-tional enrichment, Theilgaard-Mönch et al. observed an overall decline of proliferative and general cellular activ-ity during terminal granulocytic differentiation [27]. This is plausible given that IR typically induces NMD and thereby negatively affects widespread mRNA and protein expression [3, 28]. Analogous to these observations is a recent finding that shows decreasing IR ratios associated with increasing levels of fully spliced mRNAs during T cell activation, to facilitate a prompt cellular response to extracellular stimuli [5].
In all species there are large numbers of intron-retaining genes with functions that are relevant to organelle lumina, most commonly the nuclear lumen. This result confirms our previous observations concerning the importance of IR in the control of granulocyte nuclear morphology [3]. The organelle lumina group includes genes that we also identi-fied in our previous study in mouse and human granulo-cytes [3], e.g. Ddx5 (all species), Ddx3x, Lbr, Atf4, Hspa5, Ing4 (human, mouse, dog, chicken), Dnmt3a (mouse, dog, chicken), Hnrnpa2b1 (human, dog), Lmnb2 (mouse, chicken), and Lmnb1 (mouse).
Other well-conserved classes of intron-retaining gene orthologs include: kinases (e.g. Cdkn1a, Cdk9/10/13, Map2k2, Sik1), RNA-binding proteins (e.g. Upf1, Dhx58, Ddx17, Upf3b); ATP binding proteins (e.g. Ddx5, Ddx3x, Hspa5, Eif4a1, Ddx39, Atp2a3, Adrbk1); and protein trans-porters (Hspa5, Hsp90aa1, Hsp90ab1) (see Additional file 3). We conclude that although specific intron-retaining genes may vary between species, they are conserved in functional clusters. Our results suggest that IR is a function-centric rather than gene-centric mechanism of coordinating gene expression (Fig. 1c). Nonetheless, there are surprisingly large numbers of gene orthologs (n = 86) in which IR-mediated gene regulation is conserved in the granulocytes of all five species under investigation, i.e. spe-cies that shared a common ancestral genome sequence 430 million years ago (Fig. 1b). The number of conserved intron-retaining genes is even tenfold higher among the placental mammalian species (human, mouse, dog), which share as many as 873 intron-retaining gene orthologs. The non-mammalian vertebrates share 706 intron-retaining gene orthologs (Fig. 1b). We also analyzed conservation of IR on a per-intron basis by determining orthologs of retained introns in the other species. The results suggest that although IR on a per-intron basis is less conserved, conservation is still remarkable among the mammalian species (Additional file 2: Figure S2b).
In summary, our data indicate that IR is a well-conserved mechanism of process- or function-centric gene regulation in mammalian and vertebrate species, affecting a large number of orthologous and functionally related genes.
IR preserves functional complexity in species with fewer genes
It has previously been shown that the frequency of alter-native splicing events reduces with evolutionary distance from primates [23]. However, our observations of IR events in the investigated vertebrates contradict this ob-served trend (Fig. 1a). To determine whether retained in-trons, acting as gene expression control elements, preserve complexity in vertebrate species, we compared the fractions of intron-retaining genes in each species with the number of protein-coding genes in their genome. A strong anti-correlation exists between these two variables (r =–0.95, Pearson correlation; Fig. 1c). In contrast to other forms of alternative splicing that introduce prote-omic complexity to the cell [29–32], our data indicate that IR introduces transcriptomic complexity in species with lower numbers of protein-coding genes. The most ex-treme example in our study is chicken in which > 40% of the 8911 expressed genes (fragments per kilobase of tran-script per million mapped reads [FPKM]≥ 1) in granulo-cytes possess retained introns, the largest fraction in all species investigated. Chicken has by far the smallest num-ber of protein-coding genes among the five species, with a total of 15,508. On the other end of the spectrum is zebra-fish, in which 7.8% of the 768 expressed genes contain retained introns, which is a relatively small fraction in a genome that has evolved complexity via a large number of protein-coding genes (n = 25,642). While IR anti-correlates with the number of protein-coding genes in a genome, the correlation does not hold when we instead compare IR to the number of expressed genes. Our obser-vations indicate transcriptional control is the dominant mechanism of gene expression control in cases where few genes are expressed (zebrafish). Post-transcriptional con-trol of gene expression including IR is more dominant in cases where many genes are expressed (chicken). In order to reinforce this thesis, we extracted the number of tran-scriptional regulators (transcription factors, transcription co-factors, and chromatin remodeling factors) for each species from the AnimalTFDB database [33] and found that this number anti-correlates (r =–0.73, Pearson correl-ation) with the number of expressed genes in our samples. In zebrafish, where there are abundant transcriptional reg-ulators, the number of expressed genes is low. We argue therefore in zebrafish that IR is not as important compara-tively as it is in organisms like avian species where IR is a dominant mechanism of post-transcriptional gene expression control. Of note, intra-sample comparisons of
gene expression values resulted in no consistent picture, showing lower median expression levels (FPKM values) of intron-retaining genes only in dog, chicken, and zebrafish (Additional file 2: Figure S3).
Despite the number of intron-retaining genes, it is also important to take into account the density of retained introns. Eukaryotic species differ substantially in their intronic density [34]. Some species have less than 100 introns in their total genome but through spliceosomal in-tron evolution higher developed organisms have, on aver-age, up to eight introns per gene [35]. In our present study humans exhibit the highest density of introns with 9.6 introns per kilobase-pair (kbp) of exonic sequences. However, chicken has the highest density of retained in-trons (0.53 retained inin-trons/kbp exon), which is almost three times more than the species with the second highest density (dog, 0.18 retained introns/kbp exon; Fig. 1e).
Our observations suggest that IR is a phenomenon, among others, implemented to preserve transcriptomic complexity in genomes with fewer protein-coding genes. Here, complexity is effected by realizing fine-tuning of gene expression control and thereby allowing a cell to adapt to environmental changes [5]. Therefore, we propose that IR enhances gene regulatory complexity in vertebrate species.
Characteristics of retained introns are well-conserved To define features that are conserved we compared characteristics of retained introns and their host genes in the investigated species. First, we compared the length of retained introns in granulocytes and found very simi-lar distributions in human, mouse, dog, and chicken, where the average length of retained introns is consist-ently shorter than that of non-retained introns (Fig. 2a, Additional file 2: Table S2 and Figure S4). Interestingly, as the genome-specific intron length (μ) increases with genome size (μChicken= 797 nt;μZebrafish= 1023 nt;μDog=
1091 nt;μMouse= 1402 nt; μHuman= 1677 nt) so does the
fold difference (FD) between the length of non-retained introns and retained introns (FDChicken= 1.4; FDZebrafish
= 2.8; FDDog= 3.1; FDMouse= 3.7; FDHuman= 4.9). The
length of retained introns also decreases with higher IR ratios in chicken and zebrafish; however, in the mamma-lian species the negative trend is reversed at an IR ratio of about 0.5 in mouse and dog, and at an IR ratio of ~ 0.7 in human (Fig. 2b). Nevertheless, the majority (more than 93%) of retained introns examined have an IR ratio < 0.5 (Additional file 2: Figure S5).
Others have shown previously that weak splice sites favor IR [36]. Using maximum entropy modeling [37], we confirmed this characteristic of retained introns in
a
b
d
c
Fig. 2 Characteristics of retained introns. a Violin plots showing the log10 length distribution of non-retained (left violin in each subplot) and retained introns (right violin). Mann–Whitney U test was used to determine significance, denoted by *** (p < 0.001). b Generalized additive model with smoothness estimation of the intron length/IR ratio relationship. c Bivariate histograms illustrating strengths of splice site pairs (as maximum entropy) [37] of retained introns and all other introns using hexagon binning (100 × 100 bins). d Density of the GC content in retained (dark color) and non-retained introns (light color). Numbers indicate the mean GC content
our data and thus demonstrate that this feature is well-conserved in all species investigated (Fig. 2c). The pattern of splice site pair entropies shown in the bivariate histograms suggests that often both splice sites of retained introns are weak, thereby predispos-ing them for retention.
Retained introns are known to have, on average, a higher GC content compared to non-retained introns [2, 3]. We confirmed this trend in this wider spectrum of species, where the highest GC content was found in retained introns of the mammalian representatives (Fig. 2d). This reinforces our previous observations in human and mouse granulocytes as well as in murine megakaryocytes and erythrocytes [3, 4].
Intron-flanking domains expanded faster during prote-omic evolution than other protein domains [38]. These mobile domains have a strong preference for phase 1 in-trons. Although retained introns also exhibit a phase 0 excess as observed in all introns [39], our data indicate a slight but consistent shift of the intron phase distribu-tion away from phase 0 in retained introns in all five species (Additional file 2: Figure S6).
We have shown previously that many retained introns har-bor PTCs [3]. By comparing the density of PTCs in retained vs non-retained introns, we found that retained introns incorporate slightly but significantly lower PTC densities (Additional file 2: Figure S7). The underrepresentation of PTCs in retained introns might be due to the contribution of intron-retaining isoforms that are not destined for NMD.
Intron-retaining transcripts in granulocytes are often subject to degradation via NMD mostly triggered by PTCs that facilitate detection by UPF1 triggering NMD by inter-acting with UPF2 and UPF3 bound to the next exon-junction complex [3, 7]. Although conditions exist in which a PTC does not lead to NMD [40], for the purpose of gene regulation via IR no more than one retained PTC-containing intron should be required. Surprisingly, in intron-retaining genes the number of retained introns is proportional to the total number of introns in a gene (Additional file 2: Figure S8). It needs to be noted, how-ever, that the relatively short read length (201 bp) in Illu-mina RNA sequencing (RNA-seq) does not allow conclusions about the number of introns that are retained in a single transcript. Both scenarios are therefore pos-sible: (1) different transcripts have distinct individual in-trons retained; or (2) transcripts harbor several retained introns. In most of the cases in human, mouse, and zebra-fish, it is only one intron that is retained with a steady de-crease in the frequency of cases where two or more different introns are retained (Fig. 3a). In dog, there are as many genes with three different retained introns as there are cases where only one intron is retained. Notable in this context is once again chicken, where in most of the cases three or four introns per gene are retained.
We also observed that transcripts with a larger num-ber of introns are more prone to be affected by IR (Fig. 3b). This observation is consistent with previous studies that have identified the increase of the number
0.00 0.05 0.10 0.15 0.20 0.25 0.00 0.05 0.10 0.15 0.20 0.25 Other IR 1 10 20 30 40 1 10 20 30 40 1 10 20 30 40 1 10 20 30 40 1 10 20 30 40 Introns Proportion µ = 4.4 µ = 6.3 µ = 8.5 µ = 7.0 µ = 6.1 µ = 13.5 µ = 14.0 µ = 14.7 µ = 16.4 µ = 11.6 1 10 20 1 10 20 1 10 20 1 10 20 2.5% 5.0% 7.5% 10.0% 12.5% 1 10 20
Retained introns per gene
Percent of IR genes
a
b
µ = 12.7 µ = 10.5 µ = 10.5 µ = 10.7 µ = 8.9
Fig. 3 Characteristics of intron-retaining genes. a Histograms of the number of retained introns in intron-retaining genes. b Distribution of intron number in transcripts without (upper panel) and with IR (lower panel) as a proportion of all transcripts. Genes that do not contain retained introns (Other) include expressed genes (FPKM > 1) only. Gray arrows above the curves indicate the average number of introns per gene in each species
and length of introns in higher developed organisms as a way to induce genomic complexity [41, 42].
Bidirectional gene pairs are co-transcribed due to a mu-tual promoter region. It was shown previously that among adjacent human housekeeping genes there is enrichment in bidirectional gene pairs that reside in close proximity (<1 kb nt distance) [43–45]. To explore possible post-transcriptional repression via IR, we measured the dis-tances between gene pairs that involve two intron-retaining genes. Furthermore, we classified gene pairs in accordance to the published system as depicted (Fig. 4a) [46]. We consider head-to-head gene pairs as bidirectional and gene pairs with a distance < 1 kb as putatively
co-regulated. It has been shown that many gene pairs in hu-man and mouse share a mutual promoter region [46]. We have confirmed these findings (Additional file 2: Figure S10); however, the fraction of the gene pairs is smaller than that in the group of genes with retained introns com-pared to non-retained (human: 16% vs 23%; mouse: 14% vs 23%). We found that the fraction of gene pairs sharing a mutual promoter is much larger in the group of genes with retained introns (human: 23%; mouse: 23%; Fig. 4b) compared to genes without retained introns (human: 6.4%; mouse: 3.5%; Additional file 2: Figure S10). Strik-ingly, frequencies of gene distances show an enrichment of bidirectional promoters also in dog and chicken (Fig. 4b,
HH TH TT 10−1101103 10−1101103 10−1101103 10−1101103 10−1101103 0 100 200 300 0 100 200 300 0 100 200 300
Intergenic distance [kb]
No
. of gene pairs
23% 4.4% 0.0% 23% 4.4% 0.0% 0.0% 3.7% 9.0% 0.0% 11% 20% 0.0% 1.8% 4.9%a
(i) Head-to-head (ii) Tail-to-tail(iii) Tail-to-head
b
Fig. 4 Bidirectional promoters in intron-retaining genes. a Gene orientation scheme with arrow heads at the 3′ end. b Histograms of binned intergenic distances between intron-retaining genes (right). The intergenic distance is determined as distance (in kb) between the transcription start sites of two genes (–/+; HH) or end of transcripts (+/–; TT), when on opposite strands, and between end of transcript and transcription start site, when both genes are on the same strand (+/+ or–/–; TH). The percentages indicated in each plot refer to the fraction of gene pairs with an intergenic distance of ≤ 1 kb
top row). The observed enrichment of bidirectional pro-moters could be an indication of post-transcriptionally dominated gene regulation in species/cells with a large number of expressed genes. This would explain why no enrichment has been observed in zebrafish with the lowest number of expressed genes and the largest number of transcriptional regulators in this cohort. Taken together, common regulation of transcriptional initiation or other processes occurring at the promoter may play a role in intron-retaining genes and is well-conserved.
In examining diverse species in a well-defined cell, our study corroborates previously observed characteristics of retained introns (Additional file 2: Table S3). Additionally, we demonstrated that these characteristics are well-conserved. Patterns of IR at the gene level suggest that often several different introns are retained and that tran-scripts with a larger number of introns have a higher probability of IR events (Additional file 2: Figure S11). These observations can be linked to previous hypotheses that the ratio of non-coding to protein-coding DNA rises as a function of transcriptomic complexity [47] and that introns fulfill many essential functions, including the regu-lation of gene expression, in intron-rich species [48]. Intron retention complements miRNA-mediated gene regulation
Independent observations show that retained introns predominantly reside near the 3′ end of a gene tran-script [2, 3, 18]. We further determined the genomic dis-tribution of retained introns to confirm previous findings and demonstrate the strong conservation of this 3′ prevalence in IR (Fig. 5a). Although this pattern is consistent, in case of very long retained introns, the 3′ prevalence is only preserved in zebrafish (see Additional file 2: Figure S9). Our observations with respect to the length and location of retained introns correspond with the trend of a decrease in intron length towards the 3′ ends of genes in vertebrate genomes [49]. This also pro-vides reassurance that the observed 3′ prevalence of IR is neither caused by a technical nor analytical artifact. We performed gene body coverage analysis and did not find an overall bias in the mapping of any regions of genes. Thus, the 3′ prevalence of IR is not due to a tech-nical bias (Additional file 2: Figure S9).
Interestingly, in human and mouse many retained in-trons are located in the 3′ UTR (Additional file 2: Figure S12), i.e. they reside between untranslated exons and are typically spliced out during the mRNA maturation process [50]. This observation suggests the existence of novel yet unannotated 3′ UTR isoforms. Because longer 3′ UTR sequences may harbor additional miRNA bind-ing sites [51], we wondered whether intron-retainbind-ing transcripts might act as competing endogenous RNAs or miRNA sponges [6, 52]. To further investigate this
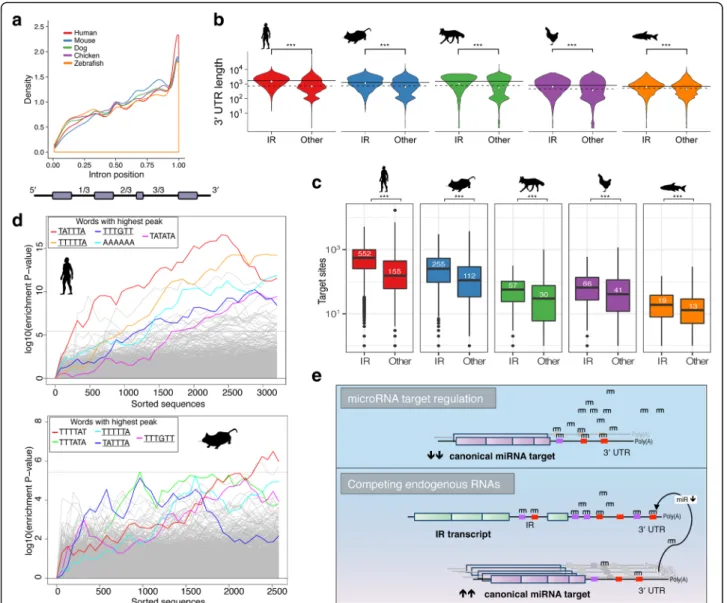
possibility, we compared the 3′ UTR lengths of genes with and without retained introns in their cognate ma-ture transcripts. Surprisingly, we found that the mean 3′ UTR length of intron-retaining genes is significantly lon-ger than that of non-intron-retaining genes in all species (Fig. 5b). The difference increases in species that are evolutionarily closer to human, while in humans the median 3′ UTR sequence of intron retaining genes is more than twice as long compared to the median in non-intron-retaining genes (Fig. 5b). Our evidence suggests that IR preferentially occurs in longer, more complex genes.
We predicted miRNA binding sites in the 3′ UTR se-quences of genes with retained introns and all other genes (not incorporating any 3′ UTR intron sequences). Surprisingly, in all species the number of putative miRNA binding sites is drastically increased in genes with retained introns (Fig. 5c). The difference in miRNA binding sites in intron-retaining genes relative to non-intron-retaining genes increases with species that are evolutionarily closer to human (zebrafish: 46%; chicken: 61%; dog: 90%; mouse: 126%; and human: 256% in-crease). With retained introns in the 3′ UTR, the num-ber of predicted miRNA binding sites increases further by 186.3, 124.1, 18.1, 70.4, and 28.9 additional sites, on average, in human, mouse, dog, chicken, and zebrafish, respectively. This leads us to hypothesize that the ex-pression of genes subject to IR is also controlled by miR-NAs. MiRNA target prediction also revealed a significantly higher density of putative miRNA binding sites in sequences of retained introns compared to non-retained introns (Additional file 2: Figure S13). IR tran-scripts could therefore function as miRNA sponges to indirectly regulate other transcripts by modulating the available pool of miRNAs (Fig. 5e). Six examples in which retained introns may facilitate a miRNA sponge effect were derived from our previous data comparing promyelocyte against granulocyte transcriptomes in mice (Additional file 2: Figure S14; GEO accession numbers: GSE48307 [53], GSE57624 [54]). Moreover, we show based on public Ago2 HITS-CLIP data that Argonaute and possibly associated miRNAs can potentially bind to the predicted miRNA binding sites in introns (Additional file 2: Figure S15). We have also illustrated the putative ef-fects of different miRNA expression and intron-retaining transcript levels on the expression of endogenous miRNA targets using a kinetic model based on ordinary differen-tial equations (Additional file 2: Figure S16).
In addition, we identified significantly over-represented sequence motifs (putative miRNA seed sites) in the 3′ UTR sequences of intron-retaining genes using Sylamer [55]. Interestingly, we found strong similarities among the enriched sequence motifs in mammalian species (Fig. 5d; Additional file 2: Figure S17 and Table S4) and the motifs
are, on average, more conserved than their flanking regions (Additional file 2: Figure S18). Taken together, these results indicate that IR is a mechanism of post-transcriptional gene regulation that complements miRNA-mediated target repression. However, given that many 3′ UTR introns are retained and that intron-retaining transcripts have more miRNA binding sites, they
may also act as miRNA sponges as we previously proposed [6] (Fig. 5e). In support of this notion is our observation that the enriched sequence motifs are also over-represented in the 3′ UTRs of genes upregulated in hematopoietic differentiation, putatively benefiting a relief from miRNA-induced expression control through intron-retaining miRNA sponge genes (Additional file 2: Figure S20).
Fig. 5 Relative position of retained introns and miRNA binding site enrichment. a Probability density function of the position of retained introns in relation to the other introns in the gene structure. Values between 0 and 1 represent the relative intron position, which is calculated by dividing the intron position by the total number of introns in a transcript. b Densities of 3′ UTR lengths as violin plots. Densities of 3′ UTR sequence lengths in transcripts with (IR) and without retained introns (Other). The solid and dashed horizontal lines mark the median 3′ UTR length of genes with and without retained introns, respectively, and the white dots their mean. Genes that do not contain retained introns
(Other) include lowly and non-expressed genes. c Comparison of the number of predicted miRNA binding sites in the 3′ UTR sequences
of genes with retained introns and non-intron-retaining genes. The white numbers indicate the median value, illustrated also by a horizontal line in each box. Genes that do not contain retained introns (Other) include lowly and non-expressed genes. d Sylamer [55] plots illustrating 6mer seed sites enriched in the 3′ UTR sequences (x-axis) of intron-retaining genes in human and mouse based on a hypergeometric significance test. The canonical polyadenylation signal (AATAAA), which is also enriched in both species, is not highlighted. Mutually enriched seed site sequences are underlined. The horizontal dotted line represents an E-value threshold (Bonferroni-corrected) of 0.01. The corresponding plots for dog, chicken, and zebrafish are in Additional file 2: Figure S17. e Model of intron-retaining transcripts as competing endogenous RNAs. Wilcoxon test was used to determine significance, denoted by***(p < 0.001)
Discussion
Of all forms of alternative splicing, least is known about IR. One reason is that IR events are difficult to detect because cellular surveillance mechanisms like NMD can rapidly degrade transcripts with retained introns, although under certain circumstances primary transcripts can evade NMD by detention in the nucleus [2, 8, 9, 11, 12]. Such differences can be separated experimentally by performing nuclear:cytoplasmic fractionation, as we have previously described [3]. Furthermore, read mapping is challenging as introns are long and abundant in low-complexity re-gions [56]. Therefore, most transcriptomic studies focus-ing on alternative splicfocus-ing have overlooked this type of regulation, despite its potential impact and the multitude of possible downstream effects [6].
In this in-depth phylogenetic exploration of IR in three mammalian and two non-mammalian vertebrate species, which shared a common ancestral genome 430 million years ago, we have shown that IR provides a conserved and orchestrated mechanism of post-transcriptional gene regulation. Since different subtypes of cells have vastly different mRNA splicing patterns associated with different functions, in this study we in-vestigated IR in a highly purified and functionally defined cell type. By adopting this meticulous approach to benchmarking IR, we have extracted unique insights regarding the conservation and function of IR across species, which would otherwise likely be obscured when performing whole-tissue analysis [2, 3, 57, 58].
A surprising outcome arising from this study was the strong anti-correlation between the number of intron-retaining genes and the number of protein-coding genes in a genome (Fig. 1d). This contrasts with the known in-crease in intron quantity with genome size, thereby fa-cilitating increased transcriptomic complexity [34]. The false assumption that developmental complexity would be reflected by the number of protein-coding genes in a genome, referred to as the G-value paradox [59], was partially explained by alternative splicing phenomena that introduce proteomic complexity through novel pro-tein isoforms [22, 29–31, 42]. An alternative measure sug-gested to account for genomic complexity is the intron density in eukaryotic organisms [30], which relates to the capacity in realizing alternative splicing events [5, 34]. By studying IR in detail, we have observed how alternative splicing utilizes introns as cis-acting regulatory gene ele-ments to post-transcriptionally fine-tune gene expression. Therefore, we suggest that IR increases gene regulatory complexity and refer to: (1) the increased number of mRNA isoforms detectable due to IR; (2) the increased so-phistication in gene expression fine-tuning (possible bene-fits illustrated in Additional file 2: Figure S19a/b) [60]; and (3) IR-induced complexity on a molecular network level (i.e. gene regulatory networks, metabolic networks,
signaling networks) by introducing dose-dependent non-linear dynamics (Additional file 2: Figure S19b/c) [61]. However, the ultimate function of IR can only be evalu-ated when the fates of intron-retaining transcripts are de-termined [56]. Therefore, we cannot rule out other explanations for the observed anti-correlation between the number of intron-retaining genes and the number of protein-coding genes in a genome. For example, the relative absence of IR transcripts in zebrafish granulo-cytes, which also express a comparatively small num-ber of genes, could either indicate an absence of IR, or it could reflect more efficient degradation of IR transcripts than in chicken with both a high number of expressed genes and high incidence of detected IR.
Another important observation from this analysis is that intron-retaining genes harbor a larger number of miRNA binding sites (Fig. 5c), mainly generated by the presence of longer 3′ UTR sequences than occur in other genes (Fig. 5b). It has been shown that the length of 3′ UTRs is correlated with morphological complexity in metazoan species [62] and that gene regulation by multiple and cooperating miRNAs mediates enhanced target repression [63–65]. This indicates that IR-mediated decay and miRNA-induced translational re-pression may be complementary mechanisms orchestrat-ing post-transcriptional gene expression control.
Our analysis reveals that IR does not just affect many gene orthologs but also encompasses other functionally related genes, suggesting that IR is a function-centric form of gene regulation. Many of the intron-retaining genes are downregulated in differentiated granulocytes. We found, for example, 674 human intron-retaining genes to be more than twofold downregulated in the study of Theilgaard-Mönch et al., in which the authors compare gene expression profiles of human promyelo-cytes, myelopromyelo-cytes, and neutrophils [27]. The authors de-scribe a general decline of proliferative and general cellular activity during terminal granulocytic differenti-ation. Here, IR seems to be a crucial regulatory factor. Downregulated genes that show IR are enriched in acetylation-related genes and splicing factors, as well as phosphoproteins and kinases and thus affect general gene expression and activity on the transcriptional, post-transcriptional, and post-translational levels, respectively (Additional file 2: Figure S21). This may also explain the G0/G1 arrest and downregulation of kinase expression observed in most end-stage differentiated neutrophil granulocytes in the study by Klausen et al. [66].
The exact mechanisms leading to IR remain to be elu-cidated; however, it is known that certain features in-crease the likelihood of an intron to be retained [36, 67]. These features are mainly composed of cis-regulatory el-ements marking characteristics of retained introns and their host genes [68, 69]. In our phylogenetic study of IR
in five species we confirmed conservation of such features including weaker splice sites, a higher GC con-tent, and a shorter length of retained introns. Further-more, we found that retained introns are predominantly located near the 3′ termini of transcripts and have lower PTC densities than non-retained introns.
Most of the observations that we found conserved in all species are particularly pronounced in the avian rep-resentative. Chicken granulocytes contained the most intron-retaining genes both in number and in relation to the total number of expressed genes (~40%). Chicken also has the highest density of retained introns; however, their median length is larger than that observed in the other species (Fig. 2a). This is surprising because intron size correlates with genome size and bird introns are typically shorter than that of mammals [49]. This appar-ent paradox may have two explanations: (1) retained in-trons in chicken have other functions beyond regulating the expression of their host genes; or (2) they may contain more cis-regulatory elements that interact with splicing factors. Moreover, many of the chicken genes are presum-ably co-regulated (15% of genes and 20% of the intron-retaining genes share a mutual promoter region) and thus are more dependent on post-transcriptional gene regula-tion (Fig. 4, Addiregula-tional file 2: Figure S10). This observaregula-tion contradicts an earlier statement made by Koyanag et al. who studied the evolution of bidirectional gene pairs that share a mutual promoter region and found that enrich-ment in bidirectional gene pairs is only detectable in mammals and not in other eukaryotes [46].
However, the variation in IR abundance may also be explained by cell biological nuances in each species. Chicken heterophils for example are exceptional in not having a myeloperoxidase-like activity whereas this is the most abundant protein in neutrophils of the other species [70]. In general, IR calling is influenced by se-quencing depth and annotation quality, i.e. the more reads and annotated genes/introns the more IR events should be detected. However, this has a negligible im-pact on our analysis, as the sequencing depth is compar-able in all experiments. The fact that the number of retained introns detected in chicken exceeds that of all other species (including human, with the highest num-ber of annotated introns) suggests that our results and conclusions are not biased by annotation quality.
Conclusions
In summary, our study has provided a definitive docu-mentation of the conserved characteristics exhibited by IR in vertebrate granulocytes, including humans. We have provided new insights that support the notion of IR as an independent mechanism of gene regulation that may interfere with or complement other forms of
post-transcriptional gene regulation. In IR we see a form of alternative splicing that realizes a feature contributing to gene regulatory complexity thereby facilitating organis-mal propensity for adaptation.
Methods
Primary granulocytes
A whole blood sample was obtained from a healthy male individual. Peripheral blood leukocytes were separated from red cells and platelets using dextran sedimentation and Ficoll density separation. Human granulocytes (CD11b + CD15+) were isolated using fluorescence-activated cell sorting (FACS) as previously described [3].
Primary mouse granulocytes from bone marrow of male C57BL/6J mice (8–10 weeks) were purified using FACS as previously published [3, 71].
Peripheral blood from ten male dogs (Beagles aged 1– 8 years) were collected from Novartis Animal Health. Dog granulocytes were purified using Percoll density separation as previously described [72], followed by FACS using a monoclonal antibody against canine neu-trophils (CAD048A, Monoclonal Antibody Center, Washington State University). Purity of granulocytes was > 95% based on morphological assessment.
Chicken granulocytes were isolated from peripheral blood of six male Ross breed chickens (Gallus gallus domesticus) aged eight weeks. Following blood collec-tion, heterophil-granulocytes were isolated as previously described [73]. Briefly, whole blood was diluted 1:1 with RPMI 1640 media (Sigma) containing 1% methylcellu-lose (25 centipoises; Sigma) and centrifuged (25 g, 30 min at 4 °C). The supernatant was transferred to a new tube, washed with calcium and magnesium-free Hank’s balanced salt solution (HBSS, 1:1; Sigma), and layered onto discontinuous Ficoll-Histopaque (Sigma) gradient (specific gravity 1.077 over specific gravity 1.119). The gradients were centrifuged at 250 g for 60 min at 4 °C. After centrifugation, the Histopaque layer containing the granulocytes was collected at the second interface 1.077/ 1.119 and transferred to a new Falcon tube. Cells were washed three times in RPMI 1640 media and pelleted by centrifugation at 4 °C, 10 min, 200 g. The last cell pellet was resuspended in calcium and magnesium-free Hank’s balanced salt solution with fetal bovine serum. Cells were further purified based on low forward and high side scatter using FACS to achieve a purity of > 95% based on morphological assessment.
Kidneys from zebrafish aged 3–6 months were dis-sected as previously described [74], pooled in HBSS (Sigma), homogenized, pelleted by centrifugation (250 g, 15 min), and gently resuspended in 6 mL HBSS. The suspension was gently layered on 2 mL of lymphocyte separation medium 1078 (Mediatech; CellGro, AK, USA) in a 15-mL Falcon tube and centrifuged (400 g, 30
min). The resulting layer of leukocytes was removed with a 1-mL sterile pipette and transferred to a 15-mL tube. HBSS was added to a total volume of 4 mL and leukocytes collected by centrifugation (400 g, 15 min). Yield assessed by hemocytometer cell counts was 1.1 ± 0.6 × 10⁶ cells/kidney (n = 15 independent preparations) and samples were 88.7 ± 6.2% (mean ± SD) granulocytes (n = 9 random fields).
Morphological confirmation of granulocytes was performed following Giemsa (human, mouse, dog, and zebrafish) or Wright staining (chicken) of cells smeared or spun onto poly-L-lysine slides.
RNA isolation and mRNA-seq
Total RNA was isolated from granulocytes using Trizol (Invitrogen). The RNA quality was assessed using RNA 6000 Nano Chips on an Agilent Bioanalyzer (Agilent Technologies) to confirm an RNA integrity score of > 7.0. mRNA-seq was performed by Macrogen (Korea) using the Illumina Hi-Seq 2000 platform. RNA-seq li-braries were prepared from > 1 μg of total RNA using TruSeq RNA sample prep kit (Illumina) according to the manufacturers’ instructions.
Genome/gene sequences and gene structure annotations Whole-genome assemblies of human, mouse, dog, chicken, and zebrafish (GRCh37.75, GRCm38.78, CanFam3.1.78, Galgal4.78, Zv9.78) were downloaded from Ensembl (Release 75). Intron sequences and gene structure information were retrieved from the UCSC Table browser [75]. Data on exon phases were retrieved via the ENSEMBL BioMart interface [76].
RNA-seq data analysis and identification of IR events Reference genome files were built and mRNA-seq reads were mapped to the respective reference genomes using STAR (Version 2.4) [77]. Details on sequencing depth and read mapping statistics for each sample are provided in Additional file 2: Table S5 and Figure S22. Gene body coverage was determined using the geneBody coverage module from the RSeQC package (v2.6.3) [78].
We used the IRFinder algorithm [26] for the detection of IR events in all known introns. IRFinder estimates the abundance of IR by computing the ratio between gene transcripts retaining an intron and the sum of all tran-scripts of the respective gene. We refer to this measure as the “IR ratio,” while others have also used the term “percent IR” (PIR) [2]. The IR ratio is in the range of 0–1; however, we only considered introns with an IR ratio≥ 0.1. We excluded introns with insufficient splicing depth (<4 reads correctly crossing the splice junction) and insuf-ficient coverage (splicing depth + trimmed mean intron depth < 10). IRFinder has a built-in routine to handle confounding factors. For example, partial IR resulting
from splicing inside the intron is a distinct process and was not considered. On a per-gene basis, we con-sidered the highest observed IR ratio for any of the retained introns as the gene’s IR ratio.
Gene expression estimation
Gene expression levels specified as FPKM were deter-mined using Cufflinks [79]. FPKM values for the genes in all species are specified in Additional file 4. Ratios of intron-retaining genes to all expressed genes were deter-mined for all genes with an FPKM value≥ 1.
Annotation enrichment analysis
Gene annotation enrichment was performed using the Database for Annotation, Visualization and Integrated Discovery (DAVID 6.7) [80]. In order to make the ana-lyses comparable across species, we used the set of orthologous genes shared among all species as back-ground. Enriched terms with a p value < 0.05 were con-sidered significant. Most commonly enriched terms are SwissProt and Protein Information Resource keywords (SP_PIR_KEYWORDS). All enriched functional annota-tions for each cluster of intron-retaining orthologs illus-trated in Additional file 2: Figure S1 can be found in Additional file 3. The Circos plot in Fig. 1c was generated using the R package GOplot [81]. We have additionally performed a functional enrichment analysis of all intron-retaining genes using expressed genes as background in each species. The results are attached in Additional file 3. Gene orthologs
Orthologs of intron-retaining genes were determined based on orthology relationships extracted from the Ensembl BioMart interface. Venn diagrams were drawn with the VennDiagram R package.
miRNA target site analysis
miRNA sequences and genomic coordinates were down-loaded from the miRBase database (release 21) [82]. miRNA target site predictions were performed using mi-Randa v3.3a [83] with the energy threshold set to –14 kcal/mol and requiring strict alignment in the seed re-gion (offset positions 2–8). Seed site enrichment analysis was performed using Sylamer [55], which calculates cu-mulative hypergeometric p values associated with small word occurrences in a sequence repository. 3′ UTR se-quences of intron retaining genes were tested for 6mer seed site enrichment using the 3′ UTR sequences of all genes as background.
Splice-site strength analysis
We used the maximum entropy model prosed in Yeo and Burge [37] to estimate the strengths of donor and acceptor sites in retained and non-retained introns.
3′ UTR introns
GTF files for all species under investigation were re-trieved from the ENSEMBL ftp server (ftp.ensembl.org). Introns were flagged as 3′ UTR-based when located in the 3′ UTR of any of the transcripts of a gene.
Statistical analyses
All statistical tests were performed using the statistical programming language R and are specified in the main text. In Fig. 2b, we used the geom_smooth function of the R ggplot2 package, which uses a generalized additive model with integrated smoothness estimation to fit a curve and standard error bounds to the intron length to IR ratio relationship.
IR profiles of orthologous genes in Additional file 2: Figure S1 were quantile normalized and grouped based on k-meansclustering (with Euclidian distance). Species-based profiles (columns) were grouped using a hierarchical clus-tering approach (1-pearson average linkage). Clusclus-tering and heat map visualizations were performed using GENE-E (http://www.broadinstitute.org/cancer/software/GENE-E/).
Additional files
Additional file 1: List of retained introns, their genomic coordinates, and IR ratios. (XLSX 1965 kb)
Additional file 2: Supplementary tables and figures. (DOCX 6927 kb) Additional file 3: Sheets 1–7: All enriched functional annotations for each cluster of intron-retaining orthologs illustrated in Additional file 2: Figure S1. Sheet 8: List of homologous genes used as background. Sheets 9–13: All enriched functional annotations of all intron-retaining genes using expressed genes as background in each species. (XLSX 913 kb) Additional file 4: Gene expression levels (FPKM) in all species. (XLSX 16883 kb)
Additional file 5: Scalable version of Fig. 1c. (PDF 8057 kb)
Acknowledgements
We thank Kim Baker and Elanco (formerly Novartis Animal Health) for providing the peripheral blood from dogs. We thank Steven Allen, Frank Kao, and Suat Dervish for FACS. The authors acknowledge the Sydney Informatics Hub and the University of Sydney’s high-performance computing cluster, Artemis, for providing the high-performance computing resources that have contributed to the research results reported within this paper.
Funding
This work was supported by the National Health and Medical Research Council (Grant #1061906 to JEJR and WR, #1080530 to JEJR, WR, and JJW, #1044754 and #1086020 to GJL, #1126306 to JJW, JEJR), Cure the Future (JEJR and US), and an anonymous foundation (JEJR). JJW and WR hold Fellowships from the Cancer Institute of NSW. US was supported by the Sydney Research Excellence Initiative. SA was supported by the King Khalid University, ABHA, KSA and the Saudi Arabian Cultural Attache in Australia. The Australian Regenerative Medicine Institute is supported by funds from the State Government of Victoria and the Australian Government.
Availability of data and materials
All RNA-seq data are available at the NCBI Sequence Read Archive (SRA project accession number: SRP092128 [84]). All other data generated during this study are included in this published article and its supplementary information files.
Authors’ contributions
JEJR conceived the overall project, and supervised its execution. US, JJW, and JEJR designed the experiments. US, WR, and FJ performed statistical and bioinformatics analyses. NP, SA, SS, MCK, GJL, and JJW purified granulocytes from human, mice, dogs, chicken, and zebrafish and prepared RNA for RNA-seq. US, JJW, and JEJR wrote and revised the manuscript. All authors reviewed the results and approved the manuscript.
Ethics approval and consent to participate
The human whole blood sample was obtained with ethics approval from the Human Research Ethics Committee of the Royal Prince Alfred Hospital (HREC/08/RPAH/222). The human participant has given written informed consent. Experimental methods comply with the Helsinki Declaration. Ethics approval for the primary mouse granulocytes from bone marrow
of male C57BL/6J mice (8–10 weeks) was obtained from RPAH AEC
Protocol no. 2013/045. Dog peripheral blood samples were collected from Novartis Animal Health with ethics approval (Protocol no. YAR-13-001 and RPAH AEC Protocol no. 2013/045). Chicken peripheral blood was collected with ethics approval (UQ AEC no. SVS/365/13/ANNANDALE and RPAH AEC Protocol no. 2013/045). The zebrafish experiments were approved by the Monash University Animal Ethics Committee (protocol MAS-2010-18).
Consent for publication Not applicable.
Competing interests
The authors declare that they have no competing interests.
Publisher’s Note
Springer Nature remains neutral with regard to jurisdictional claims in published maps and institutional affiliations.
Author details
1Gene & Stem Cell Therapy Program, Centenary Institute, University of Sydney, Camperdown 2050, NSW, Australia.2Sydney Medical School, University of Sydney, Camperdown 2050, NSW, Australia.3Gene Regulation in Cancer Laboratory, Centenary Institute, University of Sydney, Camperdown 2050, NSW, Australia.4Australian Regenerative Medicine Institute, Monash University, Clayton 3800, VIC, Australia.5CNRS, UMR 5203, Montpellier 34094, France.6School of Biomedical Sciences, The University of Queensland, Brisbane, QLD 4072, Australia.7Cell and Molecular Therapies, Royal Prince Alfred Hospital, Camperdown 2050, NSW, Australia.8Locked Bag 6, Newtown, NSW 2042, Australia.
Received: 9 October 2017 Accepted: 13 October 2017
References
1. Barash Y, Calarco JA, Gao W, Pan Q, Wang X, Shai O, Blencowe BJ, Frey BJ. Deciphering the splicing code. Nature. 2010;465:53–9.
2. Braunschweig U, Barbosa-Morais NL, Pan Q, Nachman EN, Alipanahi B, Gonatopoulos-Pournatzis T, et al. Widespread intron retention in mammals functionally tunes transcriptomes. Genome Res. 2014;24:1774–86. 3. Wong JJ, Ritchie W, Ebner OA, Selbach M, Wong JW, Huang Y, et al.
Orchestrated intron retention regulates normal granulocyte differentiation. Cell. 2013;154:583–95.
4. Edwards CR, Ritchie W, Wong JJ, Schmitz U, Middleton R, An X, et al. A dynamic intron retention program in the mammalian megakaryocyte and erythrocyte lineages. Blood. 2016;127:e24–34.
5. Ni T, Yang W, Han M, Zhang Y, Shen T, Nie H, et al. Global intron retention mediated gene regulation during CD4+ T cell activation. Nucleic Acids Res. 2016;44:6817–29.
6. Wong JJ, Au AY, Ritchie W, Rasko JE. Intron retention in mRNA: No longer nonsense: Known and putative roles of intron retention in normal and disease biology. Bioessays. 2015;38:41–9.
7. Kurosaki T, Maquat LE. Nonsense-mediated mRNA decay in humans at a glance. J Cell Sci. 2016;129:461–7.
8. Boutz PL, Bhutkar A, Sharp PA. Detained introns are a novel, widespread class of post-transcriptionally spliced introns. Genes Dev. 2015;29:63–80.
9. Pirnie SP, Osman A, Zhu Y, Carmichael GG. An Ultraconserved Element (UCE) controls homeostatic splicing of ARGLU1 mRNA. Nucleic Acids Res. 2016;45:3473–86.
10. Mauger O, Lemoine F, Scheiffele P. Targeted intron retention and excision for rapid gene regulation in response to neuronal activity. Neuron. 2016;92:1266–78.
11. Pimentel H, Parra M, Gee SL, Mohandas N, Pachter L, Conboy JG. A dynamic intron retention program enriched in RNA processing genes regulates gene expression during terminal erythropoiesis. Nucleic Acids Res. 2016;44:838–51. 12. Naro C, Jolly A, Di Persio S, Bielli P, Setterblad N, Alberdi AJ, et al. An
orchestrated intron retention program in meiosis controls timely usage of transcripts during germ cell differentiation. Dev Cell. 2017;41:82–93. 13. Jacob AG, Smith CW. Intron retention as a component of regulated gene
expression programs. Hum Genet. 2017. doi: 10.1007/s00439-017-1791-x 14. Boothby TC, Zipper RS, van der Weele CM, Wolniak SM. Removal of retained
introns regulates translation in the rapidly developing gametophyte of Marsilea vestita. Dev Cell. 2013;24:517–29.
15. Bell TJ, Miyashiro KY, Sul JY, Buckley PT, Lee MT, McCullough R, et al. Intron retention facilitates splice variant diversity in calcium-activated big potassium channel populations. Proc Natl Acad Sci U S A. 2010;107:21152–7. 16. Cuenca-Bono B, Garcia-Molinero V, Pascual-Garcia P, Dopazo H, Llopis A,
Vilardell J, et al. SUS1 introns are required for efficient mRNA nuclear export in yeast. Nucleic Acids Res. 2011;39:8599–611.
17. Gontijo AM, Miguela V, Whiting MF, Woodruff RC, Dominguez M. Intron retention in the Drosophila melanogaster Rieske Iron Sulphur Protein gene generated a new protein. Nat Commun. 2011;2:323.
18. Zhang Q, Li H, Jin H, Tan H, Zhang J, Sheng S. The global landscape of intron retentions in lung adenocarcinoma. BMC Med Genomics. 2014;7:15. 19. Jung H, Lee D, Lee J, Park D, Kim YJ, Park WY, et al. Intron retention is
a widespread mechanism of tumor-suppressor inactivation. Nat Genet. 2015;47:1242–8.
20. Buckley PT, Lee MT, Sul JY, Miyashiro KY, Bell TJ, Fisher SA, et al. Cytoplasmic intron sequence-retaining transcripts can be dendritically targeted via ID element retrotransposons. Neuron. 2011;69:877–84.
21. Dvinge H, Bradley RK. Widespread intron retention diversifies most cancer transcriptomes. Genome Med. 2015;7:45.
22. Chen L, Bush SJ, Tovar-Corona JM, Castillo-Morales A, Urrutia AO. Correcting for differential transcript coverage reveals a strong relationship between alternative splicing and organism complexity. Mol Biol Evol. 2014;31:1402–13. 23. Barbosa-Morais NL, Irimia M, Pan Q, Xiong HY, Gueroussov S, Lee LJ, et al.
The evolutionary landscape of alternative splicing in vertebrate species. Science. 2012;338:1587–93.
24. Amores A, Catchen J, Ferrara A, Fontenot Q, Postlethwait JH. Genome evolution and meiotic maps by massively parallel DNA sequencing: spotted gar, an outgroup for the teleost genome duplication. Genetics. 2011;188:799–808.
25. Havixbeck JJ, Barreda DR. Neutrophil development, migration, and function in teleost fish. Biology. 2015;4:715–34.
26. Middleton R, Gao D, Thomas A, Singh B, Au A, Wong JJ-L, et al. IRFinder: assessing the impact of intron retention on mammalian gene expression. Genome Biol. 2017;18:51.
27. Theilgaard-Monch K, Jacobsen LC, Borup R, Rasmussen T, Bjerregaard MD, Nielsen FC, et al. The transcriptional program of terminal granulocytic differentiation. Blood. 2005;105:1785–96.
28. Jaillon O, Bouhouche K, Gout JF, Aury JM, Noel B, Saudemont B, et al. Translational control of intron splicing in eukaryotes. Nature. 2008;451:359–62. 29. Blencowe BJ. Alternative splicing: new insights from global analyses. Cell.
2006;126:37–47.
30. Black DL. Protein diversity from alternative splicing: a challenge for bioinformatics and post-genome biology. Cell. 2000;103:367–70. 31. Kriventseva EV, Koch I, Apweiler R, Vingron M, Bork P, Gelfand MS, et al.
Increase of functional diversity by alternative splicing. Trends Genet. 2003; 19:124–8.
32. Resch A, Xing Y, Modrek B, Gorlick M, Riley R, Lee C. Assessing the impact of alternative splicing on domain interactions in the human proteome. J Proteome Res. 2004;3:76–83.
33. Zhang HM, Chen H, Liu W, Liu H, Gong J, Wang H, et al. AnimalTFDB: a comprehensive animal transcription factor database. Nucleic Acids Res. 2012;40:D144–149.
34. Rogozin IB, Carmel L, Csuros M, Koonin EV. Origin and evolution of spliceosomal introns. Biol Direct. 2012;7:11.
35. Roy SW, Gilbert W. The evolution of spliceosomal introns: patterns, puzzles and progress. Nat Rev Genet. 2006;7:211–21.
36. Ge Y, Porse BT. The functional consequences of intron retention: alternative splicing coupled to NMD as a regulator of gene expression. Bioessays. 2014;36:236–43. 37. Yeo G, Burge CB. Maximum entropy modeling of short sequence motifs
with applications to RNA splicing signals. J Comput Biol. 2004;11:377–94. 38. Liu M, Walch H, Wu S, Grigoriev A. Significant expansion of exon-bordering
protein domains during animal proteome evolution. Nucleic Acids Res. 2005;33:95–105.
39. Nguyen HD, Yoshihama M, Kenmochi N. Phase distribution of spliceosomal introns: implications for intron origin. BMC Evol Biol. 2006;6:69.
40. Lykke-Andersen S, Jensen TH. Nonsense-mediated mRNA decay: an intricate machinery that shapes transcriptomes. Nat Rev Mol Cell Biol. 2015;16:665–77. 41. Lynch M, Conery JS. The origins of genome complexity. Science. 2003;
302:1401–4.
42. Taft RJ, Pheasant M, Mattick JS. The relationship between non-protein-coding DNA and eukaryotic complexity. Bioessays. 2007;29:288–99. 43. Adachi N, Lieber MR. Bidirectional gene organization: a common
architectural feature of the human genome. Cell. 2002;109:807–9. 44. Takai D, Jones PA. Origins of bidirectional promoters: computational
analyses of intergenic distance in the human genome. Mol Biol Evol. 2004;21:463–7.
45. Trinklein ND, Aldred SF, Hartman SJ, Schroeder DI, Otillar RP, Myers RM. An abundance of bidirectional promoters in the human genome. Genome Res. 2004;14:62–6.
46. Koyanagi KO, Hagiwara M, Itoh T, Gojobori T, Imanishi T. Comparative genomics of bidirectional gene pairs and its implications for the evolution of a transcriptional regulation system. Gene. 2005;353:169–76.
47. Mattick JS. RNA regulation: a new genetics? Nat Rev Genet. 2004;5:316–23. 48. Chorev M, Carmel L. The function of introns. Front Genet. 2012;3:55. 49. Zhang Q, Edwards SV. The evolution of intron size in amniotes: a role for
powered flight? Genome Biol Evol. 2012;4:1033–43.
50. Bicknell AA, Cenik C, Chua HN, Roth FP, Moore MJ. Introns in UTRs: why we should stop ignoring them. Bioessays. 2012;34:1025–34.
51. Tan S, Guo J, Huang Q, Chen X, Li-Ling J, Li Q, et al. Retained introns increase putative microRNA targets within 3′ UTRs of human mRNA. FEBS Lett. 2007;581:1081–6.
52. Salmena L, Poliseno L, Tay Y, Kats L, Pandolfi PP. A ceRNA hypothesis: the Rosetta Stone of a hidden RNA language? Cell. 2011;146:353–8. 53. Wong JJ, Ritchie W, Ebner OA, Selbach M, Wong JW, Huang Y, et al.
Orchestrated intron retention regulates normal granulocyte differentiation. Gene Expression Omnibus. 2013. https://www.ncbi.nlm.nih.gov/geo/query/ acc.cgi?acc=GSE48307. Accessed 18 July 2016.
54. Wong JJ, Ritchie W, Gao D, Lau KA, Gonzalez M, Choudhary A, et al. Identification of nuclear-enriched miRNAs during mouse granulopoiesis. Gene Expression Omnibus. 2014. https://www.ncbi.nlm.nih.gov/geo/query/ acc.cgi?acc=GSE57624. Accessed 1 Mar 2017.
55. van Dongen S, Abreu-Goodger C, Enright AJ. Detecting microRNA binding and siRNA off-target effects from expression data. Nat Methods. 2008;5:1023–5.
56. Vanichkina DP, Schmitz U, Wong JJ, Rasko JEJ. Challenges in defining the role of intron retention in normal biology and disease. Semin Cell Dev Biol. 2017. 10.1016/j.semcdb.2017.07.030
57. Yap K, Lim ZQ, Khandelia P, Friedman B, Makeyev EV. Coordinated regulation of neuronal mRNA steady-state levels through developmentally controlled intron retention. Genes Dev. 2012;26:1209–23.
58. Welch JD, Williams LA, DiSalvo M, Brandt AT, Marayati R, Sims CE, et al. Selective single cell isolation for genomics using microraft arrays. Nucleic Acids Res. 2016;44:8292–301.
59. Hahn MW, Wray GA. The g-value paradox. Evol Dev. 2002;4:73–5. 60. Brawand D, Soumillon M, Necsulea A, Julien P, Csardi G, Harrigan P, et al.
The evolution of gene expression levels in mammalian organs. Nature. 2011;478:343–8.
61. Tyson JJ, Chen KC, Novak B. Sniffers, buzzers, toggles and blinkers: dynamics of regulatory and signaling pathways in the cell. Curr Opin Cell Biol. 2003;15:221–31.
62. Chen CY, Chen ST, Juan HF, Huang HC. Lengthening of 3′UTR increases with morphological complexity in animal evolution. Bioinformatics. 2012;28:3178–81. 63. Schmitz U, Lai X, Winter F, Wolkenhauer O, Vera J, Gupta SK. Cooperative
gene regulation by microRNA pairs and their identification using a computational workflow. Nucleic Acids Res. 2014;42:7539–52.
64. Lai X, Bhattacharya A, Schmitz U, Kunz M, Vera J, Wolkenhauer O. A systems’ biology approach to study microRNA-mediated gene regulatory networks. Biomed Res Int. 2013;2013:703849.
65. Lai X, Schmitz U, Gupta SK, Bhattacharya A, Kunz M, Wolkenhauer O, et al. Computational analysis of target hub gene repression regulated by multiple and cooperative miRNAs. Nucleic Acids Res. 2012;40:8818–34.
66. Klausen P, Bjerregaard MD, Borregaard N, Cowland JB. End-stage differentiation of neutrophil granulocytes in vivo is accompanied by up-regulation of p27kip1 and down-up-regulation of CDK2, CDK4, and CDK6. J Leukoc Biol. 2004;75:569–78.
67. Wong JJ, Gao D, Nguyen TV, Kwok CT, van Geldermalsen M, Middleton R, et al. Intron retention is regulated by altered MeCP2-mediated splicing factor recruitment. Nat Commun. 2017;8:15134.
68. Sakabe NJ, de Souza SJ. Sequence features responsible for intron retention in human. BMC Genomics. 2007;8:59.
69. Wang Z, Burge CB. Splicing regulation: from a parts list of regulatory elements to an integrated splicing code. RNA. 2008;14:802–13. 70. Genovese KJ, He H, Swaggerty CL, Kogut MH. The avian heterophil. Dev
Comp Immunol. 2013;41:334–40.
71. Wong JJ, Ritchie W, Gao D, Lau KA, Gonzalez M, Choudhary A, et al. Identification of nuclear-enriched miRNAs during mouse granulopoiesis. J Hematol Oncol. 2014;7:42.
72. Weiss DJ, Kraemer R, Schmit K. Isolation of granulocytes and mononuclear cells from the blood of dogs, cats, horses and cattle. Vet Clin Pathol. 1989;18:33–6. 73. Shini S, Shini A, Kaiser P. Cytokine and chemokine gene expression
profiles in heterophils from chickens treated with corticosterone. Stress. 2010;13:185–94.
74. Lieschke GJ, Oates AC, Crowhurst MO, Ward AC, Layton JE. Morphologic and functional characterization of granulocytes and macrophages in embryonic and adult zebrafish. Blood. 2001;98:3087–96.
75. Karolchik D, Hinrichs AS, Furey TS, Roskin KM, Sugnet CW, Haussler D, et al. The UCSC Table Browser data retrieval tool. Nucleic Acids Res. 2004;32: D493–496.
76. Flicek P, Amode MR, Barrell D, Beal K, Billis K, Brent S, et al. Ensembl 2014. Nucleic Acids Res. 2014;42:D749–755.
77. Dobin A, Davis CA, Schlesinger F, Drenkow J, Zaleski C, Jha S, et al. STAR: ultrafast universal RNA-seq aligner. Bioinformatics. 2013;29:15–21. 78. Wang L, Wang S, Li W. RSeQC: quality control of RNA-seq experiments.
Bioinformatics. 2012;28:2184–5.
79. Trapnell C, Williams BA, Pertea G, Mortazavi A, Kwan G, van Baren MJ, et al. Transcript assembly and quantification by RNA-Seq reveals unannotated transcripts and isoform switching during cell differentiation. Nat Biotechnol. 2010;28:511–5.
80. da Huang W, Sherman BT, Lempicki RA. Systematic and integrative analysis of large gene lists using DAVID bioinformatics resources. Nat Protoc. 2009;4:44–57. 81. Walter W, Sanchez-Cabo F, Ricote M. GOplot: an R package for visually combining expression data with functional analysis. Bioinformatics. 2015; 31:2912–4.
82. Kozomara A, Griffiths-Jones S. miRBase: annotating high confidence microRNAs using deep sequencing data. Nucleic Acids Res. 2014;42:D68–73. 83. Enright AJ, John B, Gaul U, Tuschl T, Sander C, Marks DS. MicroRNA targets
in Drosophila. Genome Biol. 2003;5:R1.
84. Schmitz U, Pinello N, Jia F, Alasmari S, Ritchie W, Keightley M-C, et al. Intron retention enhances gene regulatory complexity in vertebrates. NCBI Sequence Read Archive. 2017. https://www.ncbi.nlm.nih.gov/sra/?term= SRP092128.
• We accept pre-submission inquiries
• Our selector tool helps you to find the most relevant journal • We provide round the clock customer support
• Convenient online submission • Thorough peer review
• Inclusion in PubMed and all major indexing services • Maximum visibility for your research
Submit your manuscript at www.biomedcentral.com/submit