HAL Id: hal-00296354
https://hal.archives-ouvertes.fr/hal-00296354
Submitted on 10 Oct 2007
HAL is a multi-disciplinary open access
archive for the deposit and dissemination of
sci-entific research documents, whether they are
pub-lished or not. The documents may come from
teaching and research institutions in France or
abroad, or from public or private research centers.
L’archive ouverte pluridisciplinaire HAL, est
destinée au dépôt et à la diffusion de documents
scientifiques de niveau recherche, publiés ou non,
émanant des établissements d’enseignement et de
recherche français ou étrangers, des laboratoires
publics ou privés.
P. Stier, J. H. Seinfeld, S. Kinne, O. Boucher
To cite this version:
P. Stier, J. H. Seinfeld, S. Kinne, O. Boucher. Aerosol absorption and radiative forcing. Atmospheric
Chemistry and Physics, European Geosciences Union, 2007, 7 (19), pp.5237-5261. �hal-00296354�
www.atmos-chem-phys.net/7/5237/2007/ © Author(s) 2007. This work is licensed under a Creative Commons License.
Chemistry
and Physics
Aerosol absorption and radiative forcing
P. Stier1,*, J. H. Seinfeld1,2, S. Kinne3, and O. Boucher4
1Department of Environmental Science and Engineering, California Institute of Technology, Pasadena, USA 2Department of Chemical Engineering, California Institute of Technology, Pasadena, USA
3Aerosols, Clouds, and Climate, Max Planck Institute of Meteorology, Hamburg, Germany 4Met Office Hadley Centre for Climate Change, Exeter, UK
*now at: Atmospheric, Oceanic and Planetary Physics, University of Oxford, UK
Received: 26 April 2007 – Published in Atmos. Chem. Phys. Discuss.: 30 May 2007 Revised: 26 July 2007 – Accepted: 20 September 2007 – Published: 10 October 2007
Abstract. We present a comprehensive examination of aerosol absorption with a focus on evaluating the sensitivity of the global distribution of aerosol absorption to key uncer-tainties in the process representation. For this purpose we ex-tended the comprehensive aerosol-climate model ECHAM5-HAM by effective medium approximations for the calcula-tion of aerosol effective refractive indices, updated black car-bon refractive indices, new cloud radiative properties consid-ering the effect of aerosol inclusions, as well as by modules for the calculation of long-wave aerosol radiative properties and instantaneous aerosol forcing. The evaluation of the sim-ulated aerosol absorption optical depth with the AERONET sun-photometer network shows a good agreement in the large scale global patterns. On a regional basis it becomes ev-ident that the update of the BC refractive indices to Bond and Bergstrom (2006) significantly improves the previous underestimation of the aerosol absorption optical depth. In the global annual-mean, absorption acts to reduce the short-wave anthropogenic aerosol top-of-atmosphere (TOA)
radia-tive forcing clear-sky from −0.79 to −0.53 W m−2 (33%)
and all-sky from −0.47 to −0.13 W m−2 (72%). Our
re-sults confirm that basic assumptions about the BC refractive index play a key role for aerosol absorption and radiative forcing. The effect of the usage of more accurate effective medium approximations is comparably small. We demon-strate that the diversity in the AeroCom land-surface albedo fields contributes to the uncertainty in the simulated anthro-pogenic aerosol radiative forcings: the usage of an upper ver-sus lower bound of the AeroCom land albedos introduces
a global annual-mean TOA forcing range of 0.19 W m−2
(36%) clear-sky and of 0.12 W m−2(92%) all-sky. The con-sideration of black carbon inclusions on cloud radiative prop-erties results in a small global annual-mean all-sky absorp-tion of 0.05 W m−2and a positive TOA forcing perturbation
Correspondence to: P. Stier
of 0.02 W m−2. The long-wave aerosol radiative effects are small for anthropogenic aerosols but become of relevance for the larger natural dust and sea-salt aerosols.
1 Introduction
Atmospheric aerosols play an important role in the global climate system through modifications of the global radiation budget: directly, by scattering and absorption of radiation (e.g. ˚Angstr¨om, 1962; McCormic and Ludwig, 1967; Schulz et al., 2006); indirectly, by the modification of cloud prop-erties and abundance (e.g. Twomey, 1974, 1977; Albrecht, 1989; Lohmann and Feichter, 2005); and semi-directly, by the effect of the direct and indirect aerosol effects on cloud properties and abundance via the modification of the thermal structure of the atmosphere and the surface energy budget (Hansen et al., 1997; Ackerman et al., 2000; Lohmann and Feichter, 2005). Aerosol absorption is of particular impor-tance for both direct and semi-direct aerosol effects; how-ever, the magnitude of aerosol absorption on the global scale and its contribution to global warming is subject to consid-erable uncertainty (Cooke and Wilson, 1996; Cooke et al., 1999; Hansen et al., 2002; Jacobson, 2002; Menon et al., 2002; Chung and Seinfeld, 2002, 2005; Bond and Sun, 2005; Kinne et al., 2006; Roeckner et al., 2006; Stier et al., 2006b; Schulz et al., 2006).
A number of factors complicate the understanding of aerosol absorption, even at the local scale. The radiative properties of an individual particle are determined by the par-ticle composition and the associated component refractive in-dices as well as by its size and shape (e.g. Bohren and Huff-man, 1998). It follows from Mie theory that, to a first order, aerosol extinction per unit aerosol mass is largest when the aerosol radius is comparable to the wavelength of the radi-ation (e.g. Bohren and Huffman, 1998). This has important implications for natural and anthropogenic aerosol radiative
effects. Anthropogenic aerosols are formed predominantly by combustion and gas-to-particle conversion, resulting in average particle sizes at which most of the anthropogenic aerosol mass resides in the sub-micron accumulation mode size-range. By contrast, the predominant sources of natu-ral particles are sea salt and minenatu-ral dust, both emitted by wind-driven processes as primary particles with a large con-tribution in the super-micron coarse mode size ranges (e.g. Seinfeld and Pandis, 2006). Therefore, it can be expected that the long-wave aerosol radiative effects will be of primary importance for the larger natural aerosols.
Black carbon (BC), also referred to as “elemental carbon” or “light absorbing carbon”, emitted from incomplete com-bustion processes, is the dominant absorber of solar radia-tion under present day condiradia-tions, followed by mineral dust (DU) that has typically an imaginary part of the refractive index that is about two orders of magnitude smaller than for BC (e.g. Kinne et al., 2003). While present day BC is pre-dominantly of anthropogenic origin (Ito and Penner, 2005; Stier et al., 2006b), the contribution of anthropogenically disturbed soils to the DU emissions is uncertain (Tegen and Fung, 1995; Mahowald and Luo, 2003; Tegen et al., 2004; Mahowald et al., 2004). The refractive index of representa-tive BC and DU particles is subject to considerable uncer-tainty (Bond and Bergstrom, 2006; Balkanski et al., 2007), resulting in diverse assumptions in aerosol models and mea-surement retrievals.
As BC is the predominant anthropogenic aerosol absorber, it is a focal point of this study. Observations show that black carbon particles have complex non-spherical morphologies upon emission, depending on the source type and combus-tion temperature (Mikhailov et al., 2006; Andreae and Ge-lencs´er, 2006) affecting their radiative properties (Martins et al., 1998a; van Poppel et al., 2005). Microphysical ageing processes and subsequent mixing with other aerosol compo-nents tend to transform these structures to more spherical morphologies, supporting the spherical approximation and application of Mie theory in large-scale modelling (Martins et al., 1998b; Mikhailov et al., 2006) that will also be used throughout this study.
The radiative properties of an aerosol population depend further on the aerosol mixing state, that is the degree to which the chemical components occur as independent par-ticles (external mixing) as compared to a component mix-ture in each individual particle (internal mixing). Within the framework of Mie theory, internal mixtures are generally rep-resented by effective medium approximations that quantify the macroscopic radiative properties of the mixture as an av-erage over the microscopic arrangement of the components. Practically this is approached through mixing rules that cal-culate an effective complex refractive index from the refrac-tive indices of the individual components. A wide range of mixing rules have been developed of which the simple volume-weighted averaging of the component complex re-fractive indices is most widely used in atmospheric
appli-cations. The internal mixing of a population of black car-bon with other aerosol components enhances the co-single scattering albedo of the population, and therefore the absorp-tion optical depth, i.e. the column integrated extincabsorp-tion ow-ing to absorption (Ackerman and Toon, 1981; Ch´ylek et al., 1995; Jacobson, 2000; Stier et al., 2006c). However, in re-cent work we showed that microphysical ageing processes leading to the internal mixing of initially hydrophobic BC with hydrophilic aerosols, such as sulfate, decrease the at-mospheric lifetime and abundance of BC and compensate for the absorption enhancement by internal mixing (Stier et al., 2006c).
The actual atmospheric aerosol absorption over the atmo-spheric column with given aerosol radiative properties de-pends on its global spatio-temporal distribution. In particu-lar, the vertical distribution relative to clouds and the surface albedo play a role, as overlying clouds reduce the incoming solar radiation and the surface albedo and underlying clouds regulate the upwelling solar radiation available for absorp-tion. The simulated or retrieved aerosol absorption depends also on the radiative transfer scheme and its spectral reso-lution, as well as on the assumptions about aerosol effects within clouds.
Both interstitial aerosols and aerosols embedded in cloud droplets and ice crystals affect cloud radiative properties. It has been estimated that absorption from embedded aerosols could be a non-negligible contributor to short-wave cloud absorption, potentially reaching up to 1–3 W m−2 (Ch´ylek et al., 1996) in the global annual-mean. In their lower esti-mate Ch´ylek et al. (1996) have found relatively small global impact, in agreement with other studies (Chuang et al., 2002; Liu et al., 2002); however, as pointed out in Ch´ylek et al. (1996), the underlying assumptions about the BC abundance in their work and the work of Liu et al. (2002) might not be applicable for highly polluted areas.
The effect of atmospheric absorption on the top-of-atmosphere (TOA) aerosol radiative forcing, i.e. net change in the radiative fluxes at TOA introduced by the aerosols, depends crucially on the effective albedo of the underlying surface (e.g. Haywood and Shine, 1995; Myhre et al., 2003, 2004). The aerosol single scattering albedo (SSA), i.e. the ratio of the extinction due to scattering to the total extinction due to scattering and absorption, decreases with increasing aerosol absorption. For a certain threshold SSA, the criti-cal single scattering albedo (Haywood and Shine, 1995), the combined aerosol-surface system reflects less solar radiation back to space than the surface of a specific surface albedo alone. In this case the SW TOA forcing becomes positive and the aerosols warm the earth system. It is important to note that optically deep clouds under an aerosol layer also serve effectively as a high albedo surface. Thus, absorbing aerosols above a cloud layer have the potential to introduce positive TOA forcings as evident in the spatial distribution of the all-sky forcing estimates in Schulz et al. (2006).
This complex dependency of aerosol absorption on the aerosol microphysical state, i.e. the composition, size distri-bution, and mixing state, complicates its simulation in global aerosol models as well as the retrieval from remote sensing instruments.
Early global circulation model based estimates of climatic effects of aerosol absorption focused on specific events such as nuclear winter (Pittock et al., 1986; Turco et al., 1990) or the Kuwait oil fires after 1990 (Bakan et al., 1991). The ef-fects of black carbon on the atmospheric radiation balance and the potential for positive TOA forcing have been con-ceptually explored by Haywood and Shine (1995). Subse-quently, a number of studies investigated the general radia-tive effects of absorbing carbonaceous aerosols, employing bulk aerosol schemes in global circulation models (Cooke and Wilson, 1996; Liousse et al., 1996; Cooke et al., 1999; Chung and Seinfeld, 2002, 2005). By now, most multicom-ponent global aerosol models include a bulk representation of the predominant absorbers, black carbon and mineral dust, with prescribed size distributions and assumptions about the aerosol mixing state. A few studies prescribe ageing times from externally-mixed hydrophobic to hydrophilic BC that in some studies is then treated as an internal mixture with sul-fate for the radiation calculations. See Textor et al. (2006) for an overview of current aerosol models. A few global aerosol models include a prognostic treatment of the aerosol mixing that allows simulation of variations in the BC mixing state under different aerosol emission scenarios (Jacobson, 2001; Stier et al., 2005).
There exist a number of studies in which the global distri-bution of aerosol absorption has been computed, generally as part of an overall analysis of aerosol radiative forcing. As noted, the absorption portion is likely the most uncertain component of direct aerosol radiative forcing. Only few stud-ies evaluate the simulated aerosol absorption. Other studstud-ies focus on individual processes relevant for aerosol absorption, such as refractive index mixing rules (e.g. Ackerman and Toon, 1981; Ch´ylek et al., 1995, 2000; Jacobson, 2000). The objective of the present study is to carry out a comprehensive, measurement constrained examination of aerosol absorption. A focus is on evaluating the sensitivity of the global distribu-tion of aerosol absorpdistribu-tion to key uncertainties in the process representation. These include aerosol absorbing component refractive indices, surface albedo, refractive indices mix-ing rules, and the absorption of aerosol inclusions in cloud droplets and ice crystals. Predictions of present day aerosol absorption optical depths and the sensitivity to the process representations are evaluated and quantified with observa-tions from the global AERONET sun-photometer network (http://aeronet.gsfc.nasa.gov; Holben et al., 1998; Dubovik and King, 2000; Holben et al., 2001). Another key uncer-tainty in model based estimates of aerosol absorption are the emissions of carbonaceous aerosols that have been dis-cussed in much detail (Cooke et al., 1996; Liousse et al., 1996; Cooke, 1997; Cooke et al., 1999; van der Werf et al.,
2003; Bond et al., 2004; Schaap et al., 2004; Rao et al., 2005; Ito and Penner, 2005) and will not be considered in this study. To facilitate this investigation we further extend and eval-uate the comprehensive aerosol climate model ECHAM5-HAM (Stier et al., 2005), concentrating on the representa-tion of aerosol absorprepresenta-tion. The ECHAM5-HAM model is described in Sect. 2 with a brief summary of the base config-uration as in Stier et al. (2005) in Sect. 2.1 and its extension for this study in Sect. 2.2. The base and sensitivity simu-lations are described in Sect. 3. Results and discussion are presented in Sect. 4 followed by conclusions in Sect. 5.
2 Model description
In this study we employ the aerosol-climate model ECHAM5-HAM with a prognostic representation of the composition, size distribution, and mixing state of the ma-jor global aerosol components: sulfate, black carbon, partic-ulate organic matter, sea salt, and mineral dust (Stier et al., 2005). A brief description of ECHAM5-HAM, employed in its version echam 5.3.01 ham 1.51, is presented in the first part of this section. More details and an extensive evalua-tion of this base model can be found in Stier et al. (2005). The extensions of the representation of aerosol absorption in ECHAM5-HAM are given in the second part of the section.
2.1 ECHAM5-HAM
2.1.1 The atmospheric general circulation model ECHAM5
The atmospheric general circulation model (GCM)
ECHAM5 (Roeckner et al., 2003) is the fifth-generation climate model developed at the Max Planck Institute for
Meteorology. ECHAM5 solves prognostic equations for
vorticity, divergence, surface pressure, and temperature, expressed in terms of spherical harmonics with a
trian-gular truncation. Non linear processes and the physical
parameterisations are solved on a corresponding Gaussian
grid. Water vapour, cloud liquid water, cloud ice, and
trace components are transported in grid-point space with a flux form semi-Lagrangian transport scheme (Lin and
Rood, 1996). ECHAM5 contains a bulk microphysical
stratiform cloud scheme (Lohmann and Roeckner, 1996) with prognostic equations for cloud liquid water and ice. Cloud cover is predicted with a prognostic-statistical scheme solving equations for the distribution moments of total water (Tompkins, 2002). Convective clouds and convective transport are based on the mass-flux scheme of Tiedtke (1989) with modifications by Nordeng (1994), based on steady-state equations for mass, heat, moisture, cloud water, and momentum for an ensemble of updrafts and downdrafts. Cloud water detrainment from convective updrafts is used as source term in the stratiform cloud water equations. The short-wave radiation scheme of Fouquart and Bonnel (1980)
Table 1. Modal structure of the aerosol module HAM where SU
(sulfate), BC (black carbon), POM (particulate organic matter), SS (sea salt), DU (mineral dust) denote the components in the respec-tive modes.
Modes Hydrophilic Hydrophobic
Nucleation SU
Aitken SU, BC, POM BC, POM
Accumulation SU, BC, POM, SS, DU DU
Coarse SU, BC, POM, SS, DU DU
is employed with 4 spectral bands, one for the visible and ultra-violet, and three for the near-infrared. It uses the Eddington approximation for the integration over the zenith and azimuth angles and the delta-Eddington approximation for the reflectivity of a layer. The long-wave radiation scheme (Mlawer et al., 1997; Morcrette et al., 1998) has 16 spectral bands.
2.1.2 The aerosol module HAM
The microphysical aerosol module HAM (Stier et al., 2005) predicts the evolution of an ensemble of seven interacting internally- and externally-mixed log-normal aerosol modes. In the current setup, the components comprise: sulfate, black carbon, particulate organic matter, sea salt, and mineral dust. The aerosol mixing state is prognosed within the possible mixing state configurations illustrated in Table 1. The modes are composed either of hydrophobic compounds or of an in-ternal mixture of hydrophobic and hydrophilic compounds, henceforth denoted as hydrophilic modes. The main com-ponents of HAM are the microphysical core M7, a sulfur chemistry scheme, a module to calculate the aerosol radiative properties, a deposition module, and an emission module.
The microphysical core M7 (Vignati et al., 2004) calcu-lates the coagulation of aerosol particles, condensation of gas-phase sulfuric acid on the aerosol surface, binary nucle-ation of sulfate, and water uptake.
The sulfur cycle model (Feichter et al., 1996) treats the prognostic variables dimethyl sulfide (DMS), sulfur dioxide, sulfate and their gas- and aqueous-phase reaction pathways, using pre-calculated monthly mean oxidant fields.
Aerosol radiative properties, as well as the sink processes dry deposition, sedimentation, and wet deposition, are pa-rameterised in dependence on the prognostic aerosol size dis-tribution, composition, and mixing state and coupled to the ECHAM5 meteorology.
Aerosol radiative properties are calculated in the frame-work of Mie theory. For each aerosol mode, effective fractive indices are calculated by volume-averaging the re-fractive indices of all components, including aerosol water, which is parameterised in terms of ambient relative humidity. The effective complex refractive indices and the Mie
size-Table 2. Global annual aerosol and aerosol-precursor emissions
used in the simulations in Tg yr−1 and Tg(S) yr−1 for sulfur species. The range for the sea salt and mineral dust emissions indi-cate small fluctuations of the interactive sources.
Species Source Year 1750 Year 2000
DMS Marine Biosphere 23.5 23.5 Terrestrial Biosphere 0.3 0.3 SO2 Volcanoes 14.6 14.6 Vegetation Fires 0.7 2.1 Industry, Fossil-Fuel, 0.8 54.2 Bio-Fuels Total sulfur 39.9 94.6 BC Vegetation Fires 1.0 3.0 Fossil-Fuel 0.0 3.0 Bio-Fuels 0.4 1.6 Total BC 1.4 7.7 POM Biogenic 19.1 19.1 Vegetation Fires 12.7 34.7 Fossil-Fuel 0.0 3.4 Bio-Fuels 2.0 9.1 Total POM 33.8 66.3 SS Wind driven 5050±5 5050±5 DU Wind driven 820±10 820±10
parameters for each mode serve as input to look-up tables for the aerosol radiative properties, providing extinction cross-section, single scattering albedo, and asymmetry parameter to the ECHAM5 radiation scheme. To allow the investiga-tion of a wide range of refractive indices we extended the upper boundary of the range of the imaginary part of the re-fractive index in the look-up tables from 0.5 i to 1.0 i for this study.
Aerosol wet deposition is parameterised in terms of the aerosol size distribution and mixing state via mode-specific scavenging ratios, specifying embedded and inter-stitial aerosol fractions in the cloudy part of a grid box and in convective updrafts. The actual wet deposition is calcu-lated from the resulting embedded aerosol content based on the precipitation formation and re-evaporation calculated by the ECHAM5 cloud scheme. Aerosol and gas dry deposition velocities are calculated based on a serial resistance approach (Stier et al., 2005; Ganzeveld et al., 2006).
Emissions of mineral dust are calculated online depend-ing on the ECHAM5 10-m wind speed, soil moisture, and snow cover (Tegen et al., 2002, 2004). Freshly emitted BC and mineral dust are assumed hydrophobic. Sea salt emis-sions are parameterised in terms of the simulated 10-m wind speed and sea-ice cover (Schulz et al., 2004). Emissions of DMS are calculated interactively from DMS seawater con-centrations of Kettle and Andreae (2000) depending on the
simulated 10-m wind speed and sea surface temperature, ap-plying the sea-air exchange formulation of Nightingale et al. (2000). Terrestrial biogenic DMS emissions are prescribed
(Pham et al., 1995). For all other compounds, emission
strength, distribution, and height are based on the AeroCom aerosol model inter-comparison (http://nansen.ipsl.jussieu. fr/AEROCOM/) emission inventory representative for the years 2000 and 1750 (Dentener et al., 2006). The emissions for the years 1750 and 2000 are summarised in Table 2.
2.2 Extensions of ECHAM5-HAM
2.2.1 Mixing rules for refractive indices
The prognostic treatment of the aerosol mixing state re-quires the interactive computation of the aerosol radiative properties from the composition of each mode. In standard HAM, the effective refractive index of each mode is obtained by volume-weighted averaging of the refractive index of its components. However, as discussed in Ch´ylek et al. (1995) and Lesins et al. (2002), the volume-weighted mixing of the refractive indices for strongly absorbing inclusions, such as BC, in a less absorbing medium, such as sulfate, results in an overestimate of the effective imaginary part of the refractive index as compared to an average of explicit calculations over all possible positions of an inclusion in the host medium. A more accurate approximation for effective refractive indices can be obtained from mixing rules derived from effective medium approaches, quantifying the macroscopic radiative properties as an average over the microscopic arrangement of the components.
A general formulation for mixing rules of n components can be expressed as (Aspnes, 1982):
ǫeff− ǫ0 ǫeff+ 2ǫ0 = n X k=1 fk ǫk− ǫ0 ǫk+ 2ǫ0 (1) where ǫeffis the complex effective dielectric constant of the
mixture, ǫ0 is the complex dielectric constant of the host
medium, and ǫk and fk are the complex dielectric constant and volume fraction of component k, respectively.
The appropriate mixing rule for the inclusion of an insolu-ble core in a liquid host medium is the Maxwell-Garnet mix-ing rule (Garnett, 1904, 1906), see Ch´ylek et al. (2000) and Lesins et al. (2002). However, it requires the explicit choice of a host and an inclusion medium. As the volume fractions of the components in the internally-mixed aerosol modes of HAM are highly variable and the modes can be composed of mixtures of either dry or solid components, the application of the Maxwell-Garnett mixing rule is not straightforward. The mixing rule of Bruggeman (1935), best suited for internal mixtures of solid compounds (see Ch´ylek et al., 2000; Lesins et al., 2002), does not require the explicit definition of host and inclusion media. The resulting real and imaginary parts of the refractive indices obtained from the Bruggeman mix-ing rule lie in-between the results of the two possible choices
of host and inclusion media in the Maxwell-Garnet mixing rule (Ch´ylek et al., 2000).
In the Maxwell-Garnet mixing rule one of the mode com-ponents (k=1) is chosen as the host medium, i.e. ǫ1=ǫ0, so
that the first term of the sum in Eq. (1) vanishes and the sys-tem reduces to:
ǫeff− ǫ1 ǫeff+ 2ǫ1 = n X k=2 fk ǫk− ǫ1 ǫk+ 2ǫ1 (2) so that ǫeff = ǫ1 1 + 2Pnk=2fkǫǫk−ǫ1 k+2ǫ1 1 −Pnk=2fkǫǫkk+2ǫ−ǫ11 (3)
For the Bruggeman mixing rule no choice of a host medium is required as it is assumed that the components are embed-ded in a host medium of the effective dielectric constant, i.e. ǫ0=ǫeff, so that the left-hand side in Eq. (1) vanishes and
the system is reduced to the implicit equation for ǫeff:
f (ǫeff) = n X k=1 fk ǫk− ǫeff ǫk+ 2ǫeff = 0 (4)
2.2.2 Calculation of effective aerosol refractive indices em-ploying the Bruggeman mixing rule
As the component volume fractions for the modes of ECHAM5-HAM are highly variable, we employ in this study the Bruggeman mixing rule as an alternative method for the calculation of the mode effective complex refrac-tive indices (neff=√ǫeff) in ECHAM5-HAM. (The
Maxwell-Garnet mixing rule has also been implemented but requires somewhat arbitrary choices of host and inclusion media.) Us-ing f′(ǫeff) = n X k=1 fk −3ǫ k (ǫk+ 2ǫeff)2 (5)
we solve Eq. (4) with a Newton iteration over the index ν:
ǫeffν+1= ǫeffν − f (ǫ ν eff) f′(ǫν eff) (6) The number of required iterations for convergence was de-termined not to exceed six iterations at any grid point in a one-year test simulation, so that a fixed number of seven it-erations is applied globally.
2.2.3 Parameterisation of the effect of aerosol inclusions on cloud radiative properties employing the Maxwell-Garnett mixing rule
To facilitate the investigation of aerosol inclusions on the cloud radiative properties, we recompute the standard ECHAM5 cloud radiative properties (Roeckner et al., 2003; Rockel et al., 1991) including aerosol effects. Analogous to
Table 3. Size-distribution parameters reff[µm] and νeffof the 32
water droplet and 40 ice crystal distributions (Rockel et al., 1991). Water reff 0.188, 0.375, 0.75, 1.5, 3, 6, 12, 24
νeff 0.01, 0.1, 0.175, 0.25
Ice reff 0.375, 0.75, 1.5, 3, 6, 12, 24, 40, 60, 80
νeff 0.001, 0.1, 0.175, 0.25
the parameterisation of the aerosol radiative properties, we tabulate the cloud radiative properties in a look-up table as a function of the effective refractive index of the cloud droplets with aerosol inclusions.
In standard ECHAM5, short-wave cloud radiative prop-erties are parametrised from idealised size-distributions (Rockel et al., 1991) under the assumption of spherical cloud droplets and ice crystals. From a series of Mie calculations, fits are derived to express the resulting radiative properties of cloud droplets and ice crystals in terms of the effective radius (Roeckner et al., 2003) that is empirically related to the ra-dius of average volume by Johnson (1993) for water droplets and by Moss (personal communication as in Roeckner et al., 2003) for ice crystals.
For the extended parameterisation we repeated the Mie calculations of the cloud radiative properties for varying cloud droplet or ice crystal refractive indices. For each com-plex pair of the refractive indices, we use Mie calculations (Toon and Ackerman, 1981) to compute, as in ECHAM5, ra-diative properties for cloud droplets and ice crystals as an average over idealised gamma size-distributions following Hansen and Travis (1974):
n(r) = Cr1−3νeffνeff ereffνeff−r (7)
where C is a constant and νeffis the effective variance of the
distribution, with the specifications given in Table 3 based on Rockel et al. (1991).
The computed radiative properties for cloud droplet and ice crystal extinction cross section, single scattering albedo, and asymmetry factor are provided in a look-up table with three dimensions: Mie effective size-parameter
(Xeff=2πreff/λ), as well as real and imaginary parts (nr
and ni) of the effective refractive index of the cloud water – aerosol mixture.
The standard ECHAM5 cloud droplet concentration Nlis prescribed within the boundary layer as 220×106m−3over land and as 80×106m−3over sea. Above the boundary layer, Nl decreases exponentially to 50 m−3 in the upper tropo-sphere over both land and ocean. The cloud ice crystal num-ber concentration is calculated from the ice water mixing ra-tio via an empirical parameterisara-tion of the effective radius (Moss, 1996, personal communication as in Roeckner et al., 2003). In an extended version of ECHAM5-HAM, the stan-dard bulk stratiform cloud scheme of ECHAM5 (Lohmann
and Roeckner, 1996) has been replaced by a microphysical cloud parameterisation with a prognostic treatment of the cloud droplet number concentration and ice crystal number concentration (Lohmann et al., 2007).
Contrary to standard ECHAM5-HAM, in which all aerosol within the cloudy fraction of a grid box is assumed interstitial with identical radiative properties as for clear-sky, the in-cloud aerosol content is split into interstitial aerosol and cloud droplet/crystal inclusions that are considered for the cloud radiative properties. For the calculation of the cloud droplet and ice crystal effective refractive indices, the aerosol content associated with water droplet/ice crys-tal inclusions is calculated consistently from the prescribed ECHAM5-HAM scavenging ratios (Stier et al., 2005), de-fined as the fraction of aerosol embedded in cloud droplets or ice crystals within the cloudy fraction of a grid box. The embedded aerosol content is assumed uniformly distributed over all cloud droplets and ice crystals. The volume fraction of the aerosol inclusions can be considered small for cloud droplets and ice crystals so that the Maxwell-Garnett mixing rule (Eq. 3) is employed for the calculation of the effective dielectric constants, from which the complex refractive in-dex is derived by taking the complex root neff=√ǫeff. For
the case of pure water clouds, as applied in the CL-INT sen-sitivity study (see Sect. 3), the aerosol volume fractions in Eq. (3) are zero and the effective refractive index reduces to the host medium value. While all aerosol components could be considered for the calculation of the cloud droplet/crystal refractive indices via Eq. (3), here we activate only the effect of BC on the cloud radiative properties, as the orders of mag-nitude larger BC imaginary part of the refractive index will dominate the total aerosol effect.
2.2.4 Long-wave aerosol radiative properties
The radiation module of ECHAM5-HAM has been extended to also cover the long-wave radiative properties of aerosol, in analogy to the original short-wave radiation module (Stier et al., 2005). The long-wave aerosol radiative properties are pre-computed from Mie theory for the 16 long-wave spectral bands of the Mlawer et al. (1997); Morcrette et al. (1998) radiation scheme of ECHAM5 and supplied in look-up ta-bles with the three dimensions: Mie median size-parameter
(Xg=2πrg/λ), and real and imaginary parts of the
refrac-tive index. Hereby, r is the number median radius of the
log-normal mode and λ is the wavelength. Effective
re-fractive indices of internally-mixed modes are calculated by volume-weighted averaging of the component refractive in-dices (default) or by the Bruggeman mixing rule as described in Sect. 2.2.1. References for the implemented long-wave re-fractive indices are given in Table 4, and the spectral depen-dence of the refractive indices is depicted in Fig. 1.
Long-Wave Refractive Indices 500 1000 1500 2000 2500 3000 Wavenumber 0.0 0.5 1.0 1.5 2.0 2.5 3.0 Real Part 0.001 0.01 0.1 1 10 Imaginary Part Sulfate Black Carbon Particulate Organic Matter Sea Salt Dust Water Real
Imaginary
Fig. 1. Long-wave component refractive indices as given in Table 4.
Table 4. References for the long-wave aerosol refractive indices
shown in Fig. 1.
Species Reference SU Toon et al. (1976)
BC Bond and Bergstrom (2006)
spectrally extrapolated with Hess et al. (1998) POM Hess et al. (1998)
SS Shettle and Fenn (1979); Nilsson (1979) DU Irina Sokolik (pers. comm., 2006) WAT Downing and Williams (1975)
2.2.5 Instantaneous forcing calculation
We have extended ECHAM5-HAM by a module for the cal-culation of instantaneous direct aerosol radiative forcing (as already applied in Schulz et al., 2006). Due to the internal mixing of mode components and the resulting nonlinear ef-fects of individual components on the aerosol microphysi-cal state and radiative properties (Stier et al., 2006c), it is not possible to directly calculate radiative forcing for indi-vidual components. Instead, we calculate total aerosol ra-diative forcing by a double call of the ECHAM5 radiation scheme, without and with the radiative properties of the total aerosols. The instantaneous direct aerosol radiative forcing is then computed as the difference in the separate clear-sky and all-sky, short-wave and long-wave net radiative fluxes, without and with aerosols. No adjustment of stratospheric temperatures is performed in the forcing calculations.
3 Simulation setup
To investigate aerosol absorption and its radiative effects we perform a series of sensitivity studies with the ECHAM5-HAM model in which we vary key uncertainties in model parameterisations and compare the results to observations as well as the Stier et al. (2005) base simulation.
Table 5. Studies to explore the sensitivity of the simulated
absorp-tion to uncertain model parameters. Each scenario is simulated with AeroCom year 2000 and 1750 emissions.
Name Description
BASE Base run as in Stier et al. (2005)
BB-M Updated medium absorbing refractive indices from Bond and Bergstrom (2006)
BB-H Updated highly absorbing refractive indices from Bond and Bergstrom (2006)
BRUG As BB-M but with Bruggeman (1935) mixing rule for refractive indices ALB-L As BB-M but with low AeroCom
surface albedo estimate
ALB-H As BB-M but with high AeroCom surface albedo estimate
TRANS As BB-M but with imaginary part of all aerosol refractive indices set to ni=10−9
CL-INC As BB-M but with new cloud radiative properties and in-cloud aerosol split in interstitial and cloud droplet/crystal inclusions that are considered via cloud radiative properties
CL-INT As CL-INC with new cloud radiative properties and interstitial aerosol but without consideration of cloud droplet/crystal inclusions via cloud radiative properties
CL-EXT As CL-INC with new cloud radiative properties but all in-cloud aerosol considered as interstitial, i.e. externally mixed with cloud droplets
For each simulation we run ECHAM5-HAM from Octo-ber 1999 to DecemOcto-ber 2000 and constrain the large-scale me-teorology to the year 2000 by nudging (Jeuken et al., 1996) the model to the ECMWF ERA40 reanalysis data (Simmons and Gibson, 2000). Only the year 2000 data are analysed. We employ a horizontal resolution of T63 in spectral space with a corresponding resolution of 1.8◦×1.8◦on a Gaussian grid. The vertical resolution is set to 31 levels, extending from the surface up to 10 hPa. Aerosol and aerosol precur-sor emissions are identical in all simulations, except for small variations in the interactive sources owing to small variations in the local scale meteorology. To isolate the effect of an-thropogenic emissions, each study is performed twice with emissions from the AeroCom emission inventory (Dentener et al., 2006) representative for the years 2000 and 1750. An overview of the simulations performed is given in Table 5.
The first series of simulations (BASE, BB-M, BB-H) is aimed at exploring the sensitivity of the aerosol absorption and radiative forcing to uncertainties in the BC refractive in-dices. The BASE simulation is physically identical to that of Stier et al. (2005), however, has been performed with an updated model version, as described in Sect. 2. In the BB-M and BB-H simulations we employ the medium and highly absorbing BC refractive indices from Bond and Bergstrom
Table 6. Complex BC refractive indices at λ=550 nm used in the
sensitivity studies.
Name Refractive Index Reference BASE 1.75+0.44 i Hess et al. (1998)
BB-M 1.85+0.71 i Bond and Bergstrom (2006) BB-H 1.95+0.79 i Bond and Bergstrom (2006) TRANS 1.85+10−9i Sensitivity study
Bergstrom (2006) report the BC refractive indices only at a wavelength of 550 nm, we use the same spectral dependence as in BASE (Hess et al., 1998) to spectrally extrapolate BC refractive indices for BB-M and BB-H.
Variations in the aerosol absorption have been attributed partly to the calculation of the effective refractive indices for internally mixed aerosols, in particular for internal mix-tures of BC (Ch´ylek et al., 1995; Lesins et al., 2002; Jacob-son, 2000). To quantify the effect of mixing rules on global atmospheric absorption and radiative forcing we replace in the BRUG simulation the most commonly applied volume-weighted averaging applied in all other simulations with the more elaborate Bruggeman (1935) mixing rule.
Variations in the TOA forcing of absorbing aerosols are often partly attributed to differences in the assumed surface albedos (e.g. Schulz et al., 2006). To quantify this effect, we derive upper and lower estimates of the global surface albedo distribution, as applied in current global aerosol mod-els, and apply those fields in ECHAM5-HAM. We derive these upper and lower bounds from the surface albedo fields submitted by the GISS (Koch et al., 2006), ECHAM5-HAM (Stier et al., 2005), LOA (Reddy et al., 2005), LSCE (see Textor et al., 2006), UIO-GCM (Kirkev˚ag and Iversen, 2002; Kirkev˚ag et al., 2005; Iversen and Seland, 2002, 2003), UMI (Liu et al., 2005), and SPRINTARS1(Takemura et al., 2005) global aerosol models to the AeroCom forcing experiment (Schulz et al., 2006). At each grid point of ECHAM5-HAM we select the highest and lowest value of the surface albedo provided by any of the AeroCom models. The resulting up-per and lower bounds of the AeroCom surface albedo distri-butions are depicted in Fig. 2. Please note that the protocol of the AeroCom forcing experiment specified albedo broadly as “surface solar broadband albedo (0.2–4.0 µm)”. Therefore, some of the submissions provide the prescribed background surface albedo while others provide the applied effective sur-face albedo, including the contributions from interactively
1For SPRINTARS, the AeroCom database contained the visible
instead of the broad-band short-wave surface albedo. This field was used in the calculation of the upper and lower bound of the broad-band surface albedos. However, a reanalysis of the derived upper and lower bounds without SPRINTARS resulted in almost indis-tinguishable lower and upper bounds with global annual means of 0.19 and 0.35, respectively. Therefore, we decided not to repeat the sensitivity studies with the corrected fields.
AeroCom Minimum Surface albedo: 0.18
0.0 0.1 0.2 0.3 0.4 0.5 0.6 0.7 0.8 0.9 1.0
AeroCom Maximum Surface albedo: 0.36
0.0 0.1 0.2 0.3 0.4 0.5 0.6 0.7 0.8 0.9 1.0
Fig. 2. Global distribution and mean of the upper and lower bound
of broadband short-wave (0.2–4.0 µm) land surface albedo fields sampled from submissions the AeroCom forcing experiment.
computed snow and ice covers. This might cause a high bias of the upper bound of the surface albedo estimate at high latitudes. For the sensitivity studies with ECHAM5-HAM, we use the the derived lower (ALB-L) and upper (ALB-H) bounds to replace the prescribed background ECHAM5 land surface albedo (Hagemann, 2002) used in all other tions. The background albedo is modified during the simula-tion based on the simulated snow cover. We do not modify the original sea and lake surface albedo of ECHAM5, which is set to a constant value of 0.07 (Roeckner et al., 2003).
To quantify the contribution of aerosol absorption to aerosol radiative forcing, we perform a study with transpar-ent aerosols (TRANS), i.e. with the imaginary parts of all aerosol refractive indices set to ni=10−9.
The effect of aerosol inclusions on short-wave cloud ab-sorption and the resulting radiative effects are investigated in the CL-INC, CL-INT, and CL-EXT simulations. All employ the new cloud radiative properties described in Sect. 2.2.3. CL-INC is set up as BB-M but with in-cloud aerosol split in interstitial aerosol and cloud droplet/crystal inclusions that are considered in the calculation of the cloud radiative prop-erties via the Maxwell-Garnett mixing rule. CL-INT is
iden-tical to CL-INC but considers only the interstitial aerosol and not the effect of cloud droplet/crystal inclusions on the new cloud radiative properties. In CL-EXT, all in-cloud aerosol is considered interstitial, i.e. externally mixed with the cloud droplets.
4 Results
In this section we will systematically evaluate the sensitivity of aerosol absorption and radiative forcing to key uncertain-ties in aerosol modelling.
The general setup of our simulations is identical to that in Stier et al. (2005), and the sensitivity studies performed dif-fer only in the representation of the aerosol and surface radia-tive properties, so that the extensive evaluation of ECHAM5-HAM in Stier et al. (2005) does also apply for this study. As the present study focuses on the representation of aerosol ab-sorption, the changes in all simulations affect only minimally the global aerosol optical depth as compared to Stier et al. (2005), with a global annual mean value of 0.14.
4.1 Total aerosol absorption and its evaluation
The simulated global distribution of clear-sky total aerosol absorption optical depth (AAOD=AOD(1-SSA)), its sea-sonal evaluation with AERONET sun-photometer measure-ments, and the simulated clear-sky total aerosol absorption for the BASE, BB-M, BB-H, and BRUG scenarios are de-picted in Figs. 3–6, respectively. For the AAOD evaluation at each AERONET site, the simulated daily mean AAOD values at the model grid-box containing the site have been sampled at the available measurement dates. To minimise the error of the AERONET retrieval, we apply the following pro-cedure for the derivation of daily mean AAOD values from Version 1 Level 2.0 data. We stratify the retrieved aerosol single scattering albedo data for each day into a 5 bin his-togram ordered by AOD. If the average AOD is larger than a critical threshold value of 0.3 we adopt the associated single scattering albedo average for the calculation of AAOD. If the average AOD falls below the critical threshold, we adopt the SSA value associated to the first AOD bin average above the threshold. In case the average of even the largest AOD bin stays below the critical threshold, we prescribe the SSA of the largest AOD bin to all bins with lower AOD. This pro-cedure is designed to minimise the potential SSA error for small AODs (small signal to noise ratios).
For the BB-M sensitivity study, all included daily-mean AAODs are additionally given as seasonally colour-coded scatterplots for each AERONET site in Appendix A,
Fig. A1. The same plots for the BASE, BB-H,
and BRUG study can be found in the supplementary online material (http://www.atmos-chem-phys.net/7/5237/ 2007/acp-7-5237-2007-supplement.pdf), SOM-Figs. 1–3.
Aerosol radiative properties and forcings for all simulations are given in Table 7.
The global distribution of the AAOD and aerosol absorp-tion shows maxima in the biomass burning regions of Central Africa and South America, in the Saharan dust plume, and in the regions with high anthropogenic activities over India and South East Asia, as well as secondary maxima over the Eastern U.S. and Central to Eastern Europe. For all simula-tions, the AERONET evaluation of AAOD shows generally a good agreement in these large-scale global patterns. Also the seasonality is well captured at many AERONET sites, such as the July to September onset of the Southern Hemispheric biomass burning season in South America and Africa.
On a regional basis, general and seasonal biases as well as differences among the simulations become more clearly evident. For example, AAODs at the urban Mexico City site (99.2 W, 19.3 N) as well as over the central European site Lille (3.1 E, 50.6 N) are generally underestimated, and the AAOD increase during the Asian spring dust-season at the Mongolian Dalanzadgad site (104.4 E, 43.6 N) is not cap-tured. The BASE simulation has a tendency to generally un-derestimate AAOD, in particular over the European and US source regions. The increase of the imaginary part of the BC refractive index from BASE to BB-M and BB-H (Table 6), generally improves the agreement with the AERONET re-trieved AAOD. The incomparability of different stations and the consideration of a highly variable number of measure-ments at each site (Fig. A1) do not seem to allow deriving a global measure of the overall model performance. How-ever, from comparison of Figs. 3–6 and SOM-Figs. 1–3 we conclude that the BB-M (and the very similar BRUG) case seems to provide the best representation of the AERONET retrieved AAOD. Thus, the BB-M simulation will be used as a reference for comparison with the other sensitivity studies. 4.2 Anthropogenic aerosol absorption and radiative forcing
4.2.1 BASE case
The simulated short-wave anthropogenic aerosol absorp-tion and TOA radiative forcings are depicted in Fig. 7; corresponding global annual-mean total and anthropogenic aerosol radiative properties and forcings are given in Table 7. For the BASE case, as submitted to the AeroCom forc-ing experiment (Schulz et al., 2006), the global annual mean short-wave clear- and all-sky anthropogenic aerosol absorp-tion are 0.81 W m−2 and 0.74 W m−2, these are 46% and 45% of the total year 2000 aerosol absorption, respectively. Aerosol absorption generally reduces the amount of solar ra-diation reflected back to space. Over high surface albedo areas the combined aerosol-surface system reflects less solar radiation back to space than the high albedo surface alone, resulting in a positive TOA forcing and a warming effect. This can be observed in the clear-sky TOA aerosol radiative forcing over North Africa and West Australia. In the all-sky
Table 7. ECHAM5-HAM simulated short- and long-wave aerosol radiative properties and forcings for the different sensitivity studies.
Aerosol optical depths are given at wavelength λ = 550 nm. Please note that the BB-M study, showing good agreement with the AERONET AAOD retrieval, serves as reference for comparison with the other studies.
Study AAOD AAOD Absorption Absorption Absorption Absorption Forcing TOA Forcing TOA Forcing TOA Forcing TOA fClear-Sky Clear-Sky Clear-Sky All-Sky Clear-Sky All-Sky Clear-Sky All-Sky Clear-Sky All-Sky Total Antrop. Total Total Anthrop. Anthrop. Total Aerosol Total Aerosol Anthrop. Anthrop. [10−3] [10−3] [W m−2] [W m−2] [W m−2] [W m−2] [W m−2] [W m−2] [W m−2] [W m−2] SW BASE 2.1 1.3 1.78 1.63 0.81 0.74 –4.02 –2.51 –0.65 –0.27 BB-M 3.0 2.0 2.35 2.15 1.20 1.11 -3.84 –2.30 –0.53 –0.13 BB-H 3.2 2.2 2.50 2.30 1.31 1.21 –3.80 –2.24 –0.50 –0.09 BRUG 2.6 1.7 2.12 1.95 1.05 0.97 –3.90 –2.37 –0.58 –0.18 ALB-L 3.1 2.0 2.42 2.22 1.18 1.08 –4.29 –2.62 –0.61 –0.18 ALB-H 3.0 2.0 2.38 2.18 1.24 1.14 –3.55 –2.09 –0.42 –0.06 TRANS 0.0 0.0 0.08 0.11 0.01 0.02 –3.96 –2.47 –0.79 –0.47 LW BASE 1.33 0.72 0.06 0.03 0.37 0.21 0.03 0.02
case, clouds below absorbing aerosols serve as an effective high albedo surface so that large regions over South America and regions with persistent fields of stratocumulus clouds of the west coast of Southern Africa show positive TOA aerosol radiative forcings. The global annual-mean short-wave clear-sky and all-clear-sky anthropogenic TOA aerosol radiative forc-ings are –0.65 W m−2and –0.27 W m−2, respectively. 4.2.2 Sensitivity to BC refractive indices
To investigate the sensitivity of aerosol absorption and radia-tive forcing to the BC refracradia-tive index we increase the imagi-nary part of the BC refractive index from 0.44 in BASE to the medium and high recommendations by Bond and Bergstrom (2006) of 0.71 in BB-M and 0.79 in BB-H (at λ=550 nm). As evident in Fig. 7, these changes increase the anthro-pogenic short-wave aerosol absorption from 0.81 to 1.20 and 1.31 W m−2in the clear-sky and from 0.74 to 1.11 and 1.21 W m−2in the all-sky case, respectively. It is interesting to note that while this increase of absorption reduces the TOA
forcing from −0.65 to −0.53 (−19%) and −0.50 W m−2
(−23%) for the clear-sky case, the all-sky forcing decreases
from −0.27 to −0.13 (−52%) and −0.09 W m−2(−67%).
This highlights the strong sensitivity of the all-sky TOA aerosol radiative forcing to aerosol absorption and the cru-cial role of the relative location of absorbing aerosols and clouds. For the BB-M study, which shows the best agreement of AAOD with the AERONET sunphotometer network, the TOA aerosol radiative forcing becomes positive over large regions of Africa, South America, Asia and Australia. 4.2.3 Sensitivity to refractive index mixing rules
In the BRUG study, we replace the simple volume-weighted averaging calculation of the effective refractive indices for internally mixed modes in BB-M by the Bruggeman (1935) mixing rule. As shown in Table 7, this change decreases the
total aerosol clear-sky and all-sky absorption from 2.35 to
2.12 W m−2(−10%) and from 2.15 to 1.95 W m−2(−9%),
respectively. This relatively small change of the aerosol ab-sorption, as compared to the change associated with the vari-ations of the BC refractive indices from BASE to BB-H, does not allow one to identify significant improvements in the evaluation of AAOD with the AERONET sun-photometer network between BB-M (Fig. 4) and BRUG (Fig. 6). The anthropogenic aerosol clear-sky and all-sky TOA radia-tive forcings intensify from BB-M to BRUG from −0.53
to −0.58 W m−2 (+9%) and from −0.13 to −0.18 W m−2
(+39%), respectively.
4.2.4 Sensitivity to surface albedo
The large gradients in the TOA forcing at discontinuities of the surface albedo fields, such as the coasts of Africa, read-ily suggest a strong dependence of aerosol radiative forcing on the surface albedo. To quantify the effect of common as-sumptions for the surface albedo on the aerosol absorption and radiative forcing, we replace the land surface albedo field applied in BB-M by the upper (ALB-H) and lower (ALB-L) bound of the reported surface albedos in the AeroCom forc-ing experiment, as described in Sect. 3. The resultforc-ing annual-mean difference in the broad-band land surface albedo be-tween the simulations ALB-H and ALB-L is shown in Fig. 8. It is clearly evident that significant surface albedo difference exist between the two simulations, reaching values of 0.5. Interestingly, the differences are not limited to high latitude areas where different assumptions in snow covers and albe-dos could play a role in the AeroCom upper bound of the surface albedo. Instead, differences of up to about 0.4 occur over all continents with the largest absolute differences over the high albedo desert areas. The global annual-mean differ-ence is 0.04 and the differdiffer-ence averaged over the land areas is 0.13.
Aerosol Absorption Optical Depth: 2.1x10
-30 0.00001 0.00005 0.0002 0.001 0.005 0.02 0.1
Aerosol Absorption Optical Depth
0.0005 0.001 0.002 0.005 0.01 0.02 0.05 ECHAM5-HAM AeroNet J F M A M J J A S ON D
Aerosol Absorption Clear-Sky: 1.78 W m
-20 0.05 0.1 0.2 0.5 1 2 5 10 20 50
Fig. 3. ECHAM5-HAM simulated BASE year 2000 mean
clear-sky aerosol absorption optical depth [1] at wavelength λ=550 nm, comparison of simulated (red) and AERONET sun-photometer re-trieved (black) clear-sky aerosol absorption optical depth [1] as sea-sonal distribution (clockwise, starting at 12 o’clock) at respective AERONET locations, simulated clear-sky short-wave aerosol ab-sorption [W m−2]. Global annual-mean values are given in the ti-tles.
Aerosol Absorption Optical Depth: 3.0x10
-30 0.00001 0.00005 0.0002 0.001 0.005 0.02 0.1
Aerosol Absorption Optical Depth
0.0005 0.001 0.002 0.005 0.01 0.02 0.05 ECHAM5-HAM AeroNet J F M A M J J A S ON D
Aerosol Absorption Clear-Sky: 2.35 W m
-20 0.05 0.1 0.2 0.5 1 2 5 10 20 50
Fig. 4. ECHAM5-HAM simulated BB-M year 2000 mean
clear-sky aerosol absorption optical depth [1] at wavelength λ=550 nm, comparison of simulated (red) and AERONET sun-photometer re-trieved (black) clear-sky aerosol absorption optical depth [1] as sea-sonal distribution (clockwise, starting at 12 o-clock) at respective AERONET locations, simulated clear-sky short-wave aerosol ab-sorption [W m−2]. Global annual-mean values are given in the ti-tles.
Aerosol Absorption Optical Depth: 3.2x10
-30 0.00001 0.00005 0.0002 0.001 0.005 0.02 0.1
Aerosol Absorption Optical Depth
0.0005 0.001 0.002 0.005 0.01 0.02 0.05 ECHAM5-HAM AeroNet J F M A M J J A S ON D
Aerosol Absorption Clear-Sky: 2.50 W m
-20 0.05 0.1 0.2 0.5 1 2 5 10 20 50
Fig. 5. ECHAM5-HAM simulated BB-H year 2000 mean
clear-sky aerosol absorption optical depth [1] at wavelength λ=550 nm, comparison of simulated (red) and AERONET sun-photometer re-trieved (black) clear-sky aerosol absorption optical depth [1] as sea-sonal distribution (clockwise, starting at 12 o-clock) at respective AERONET locations, simulated clear-sky short-wave aerosol ab-sorption [W m−2]. Global annual-mean values are given in the ti-tles.
Aerosol Absorption Optical Depth: 2.6x10
-30 0.00001 0.00005 0.0002 0.001 0.005 0.02 0.1
Aerosol Absorption Optical Depth
0.0005 0.001 0.002 0.005 0.01 0.02 0.05 ECHAM5-HAM AeroNet J F M A M J J A S ON D
Aerosol Absorption Clear-Sky: 2.12 W m
-20 0.05 0.1 0.2 0.5 1 2 5 10 20 50
Fig. 6. ECHAM5-HAM simulated BRUG year 2000 mean
clear-sky aerosol absorption optical depth [1] at wavelength λ=550 nm, comparison of simulated (red) and AERONET sun-photometer re-trieved (black) clear-sky aerosol absorption optical depth [1] as sea-sonal distribution (clockwise, starting at 12 o-clock) at respective AERONET locations, simulated clear-sky short-wave aerosol ab-sorption [W m−2]. Global annual-mean values are given in the ti-tles.
Atmospheric Atmospheric Top-Of-Atmosphere Top-Of-Atmosphere
Absorption Absorption Forcing Forcing
Clear-Sky All-Sky Clear-Sky All-Sky
BASE Atmosphere Clear-Sky: 0.81 W m-2 -20 -10 -5-2 -1 -0.5 -0.2 -0.1 0 0.1 0.2 0.5 1 2 510 20 [ Atmosphere All-Sky: 0.74 W m-2 -20 -10 -5-2 -1 -0.5 -0.2 -0.1 0 0.1 0.2 0.5 1 2 510 20 [ TOA Clear-Sky: -0.65 W m-2 -20 -10 -5-2 -1 -0.5 -0.2 -0.1 0 0.1 0.2 0.5 1 2 510 20 [ TOA All-Sky: -0.27 W m-2 -20 -10 -5-2-1 -0.5 -0.2 -0.1 0 0.1 0.2 0.5 1 2 510 20 [ BB-M Atmosphere Clear-Sky: 1.20 W m-2 -20 -10 -5-2 -1 -0.5 -0.2 -0.1 0 0.1 0.2 0.5 1 2 510 20 [ Atmosphere All-Sky: 1.11 W m-2 -20 -10 -5-2 -1 -0.5 -0.2 -0.1 0 0.1 0.2 0.5 1 2 510 20 [ TOA Clear-Sky: -0.53 W m-2 -20 -10 -5-2 -1 -0.5 -0.2 -0.1 0 0.1 0.2 0.5 1 2 510 20 [ TOA All-Sky: -0.13 W m-2 -20 -10 -5-2-1 -0.5 -0.2 -0.1 0 0.1 0.2 0.5 1 2 510 20 [ BB-H Atmosphere Clear-Sky: 1.31 W m-2 -20 -10 -5-2 -1 -0.5 -0.2 -0.1 0 0.1 0.2 0.5 1 2 510 20 [ Atmosphere All-Sky: 1.21 W m-2 -20 -10 -5-2 -1 -0.5 -0.2 -0.1 0 0.1 0.2 0.5 1 2 510 20 [ TOA Clear-Sky: -0.50 W m-2 -20 -10 -5-2 -1 -0.5 -0.2 -0.1 0 0.1 0.2 0.5 1 2 510 20 [ TOA All-Sky: -0.09 W m-2 -20 -10 -5-2-1 -0.5 -0.2 -0.1 0 0.1 0.2 0.5 1 2 510 20 [ BR UG Atmosphere Clear-Sky: 1.05 W m-2 -20 -10 -5-2 -1 -0.5 -0.2 -0.1 0 0.1 0.2 0.5 1 2 510 20 [ Atmosphere All-Sky: 0.97 W m-2 -20 -10 -5-2 -1 -0.5 -0.2 -0.1 0 0.1 0.2 0.5 1 2 510 20 [ TOA Clear-Sky: -0.58 W m-2 -20 -10 -5-2 -1 -0.5 -0.2 -0.1 0 0.1 0.2 0.5 1 2 510 20 [ TOA All-Sky: -0.18 W m-2 -20 -10 -5-2-1 -0.5 -0.2 -0.1 0 0.1 0.2 0.5 1 2 510 20 [ ALB-L Atmosphere Clear-Sky: 1.18 W m-2 -20 -10 -5-2 -1 -0.5 -0.2 -0.1 0 0.1 0.2 0.5 1 2 510 20 [ Atmosphere All-Sky: 1.08 W m-2 -20 -10 -5-2 -1 -0.5 -0.2 -0.1 0 0.1 0.2 0.5 1 2 510 20 [ TOA Clear-Sky: -0.61 W m-2 -20 -10 -5-2 -1 -0.5 -0.2 -0.1 0 0.1 0.2 0.5 1 2 510 20 [ TOA All-Sky: -0.18 W m-2 -20 -10 -5-2-1 -0.5 -0.2 -0.1 0 0.1 0.2 0.5 1 2 510 20 [ ALB-H Atmosphere Clear-Sky: 1.24 W m-2 -20 -10 -5-2 -1 -0.5 -0.2 -0.1 0 0.1 0.2 0.5 1 2 510 20 [ Atmosphere All-Sky: 1.14 W m-2 -20 -10 -5-2 -1 -0.5 -0.2 -0.1 0 0.1 0.2 0.5 1 2 510 20 [ TOA Clear-Sky: -0.42 W m-2 -20 -10 -5-2 -1 -0.5 -0.2 -0.1 0 0.1 0.2 0.5 1 2 510 20 [ TOA All-Sky: -0.06 W m-2 -20 -10 -5-2-1 -0.5 -0.2 -0.1 0 0.1 0.2 0.5 1 2 510 20 [ TRANS Atmosphere Clear-Sky: 0.01 W m-2 -20 -10 -5-2 -1 -0.5 -0.2 -0.1 0 0.1 0.2 0.5 1 2 510 20 [ Atmosphere All-Sky: 0.02 W m-2 -20 -10 -5-2 -1 -0.5 -0.2 -0.1 0 0.1 0.2 0.5 1 2 510 20 [ TOA Clear-Sky: -0.78 W m-2 -20 -10 -5-2 -1 -0.5 -0.2 -0.1 0 0.1 0.2 0.5 1 2 510 20 [ TOA All-Sky: -0.47 W m-2 -20 -10 -5-2-1 -0.5 -0.2 -0.1 0 0.1 0.2 0.5 1 2 510 20 [
Fig. 7. Simulated year 2000 anthropogenic aerosol short-wave clear-sky atmospheric absorption , all-sky atmospheric absorption, clear-sky
TOA forcing, and all-sky TOA forcing [W m−2] for the BASE, BB-M, BB-H, BRUG, ALB-L, ALB-H, and TRANS scenarios. Global annual-mean values are given in the titles.
Surface Albedo Difference: 0.04
-0.5 -0.4 -0.3 -0.2 -0.1 0.0 0.1 0.2 0.3 0.4 0.5
Fig. 8. Annual-mean difference in the effective ECHAM5-HAM
broad-band surface albedo between the simulations with the the up-per (ALB-H) and lower (ALB-L) bound of the AeroCom land sur-face albedos. The global annual mean value in the title includes unchanged ocean areas to allow for a comparison with the global forcings in Fig. 9
The resulting modification of the upwelling surface short-wave radiative fluxes cause small changes in the clear-and all-sky anthropogenic aerosol absorption of less than 0.05 W m−2(Table 7). However, the corresponding anthro-pogenic TOA aerosol radiative forcing changes from −0.53
in BB-M to −0.61 (+15%) in ALB-L and −0.42 W m−2
(−21%) in ALB-H for the clear-sky case and the all-sky forc-ing change from −0.13 in BB-M to −0.18 (+39%) in ALB-L
and −0.06 W m−2(−54,%) in ALB-H (Table 7 and Fig. 7).
The difference of clear-sky and all-sky anthropogenic direct aerosol radiative forcings between the ALB-H and ALB-L simulations is shown in Fig. 9. Over large regions, such as East Asia, the differences of the clear-sky TOA anthro-pogenic forcing due to the use of different surface albedo datasets reach up to 2–5 W m−2, locally up to 10 W m−2. The global annual-mean difference in the anthropogenic TOA aerosol radiative forcing between the cases with the upper and the lower bounds of the AeroCom land-surface albedo is 0.20 W m−2(clear-sky) and 0.12 W m−2(all-sky), respec-tively.
4.3 Contribution of aerosol absorption to radiative forcing The difference between the BB-M and TRANS simulations allows one to isolate the effect of aerosol absorption on radia-tive forcing. Unlike studies with absorbing aerosols omitted, this method does not alter the aerosol microphysical state by changing the number of emitted primary particles that can act as seeds for secondary particle growth (Stier et al., 2006a; Pierce and Adams, 2007).
The comparison of the global patterns of short-wave an-thropogenic aerosol radiative forcing in Fig. 7 shows the very similar distribution of negative aerosol radiative
per-TOA Clear-Sky: 0.20 W m
-2 -10 -8 -6 -4 -2 0 2 4 6 8 10 [TOA All-Sky: 0.12 W m
-2 -10 -8 -6 -4 -2 0 2 4 6 8 10 [Fig. 9. Annual-mean difference of clear-sky and all-sky
anthro-pogenic direct aerosol radiative forcings between simulations ap-plying the upper (ALB-H) and lower (ALB-L) bound of the Aero-Com land surface albedos given in Fig. 8.
turbations in the main anthropogenic source regions. How-ever, without aerosol absorption the short-wave TOA forc-ings are universally negative and the positive forcforc-ings over extended regions in BB-M change their sign in TRANS. In the global annual mean, absorption acts to reduce the nega-tive TOA short-wave anthropogenic aerosol forcing of BB-M by 0.26 W m−2for the clear-sky and 0.34 W m−2for the all-sky case, as indicated by the differences between the TRANS and BB-M cases in Table 7.
4.4 Long-wave aerosol radiative effects
The simulated instantaneous year 2000 mean long-wave to-tal aerosol radiative forcings from the BASE simulation are given in Fig. 10 and Table 7. The largest long-wave at-mospheric aerosol net absorption occurs in the high-latitude storm track regions, owing to large sea salt and associated aerosol water burdens, and in the Saharan dust plume. The wind driven sea salt emissions are spatio-temporally corre-lated with storms and the associated clouds and water vapour. As the long-wave radiation in these regions is predominantly attenuated by the water vapour and cloud water, the all-sky
TOA Clear-Sky: 0.37 W m-2 -20 -10 -5 -2 -1 -0.5 -0.2 -0.1 0 0.1 0.2 0.5 1 2 5 10 20 [ TOA All-Sky: 0.21 W m-2 -20 -10 -5 -2 -1 -0.5 -0.2 -0.1 0 0.1 0.2 0.5 1 2 5 10 20 Atmosphere Clear-Sky: 1.33 W m-2 -20 -10 -5 -2 -1 -0.5 -0.2 -0.1 0 0.1 0.2 0.5 1 2 5 10 20 [ Atmosphere All-Sky: 0.72 W m-2 -20 -10 -5 -2 -1 -0.5 -0.2 -0.1 0 0.1 0.2 0.5 1 2 5 10 20
Fig. 10. Year 2000 instantaneous long-wave total aerosol TOA direct radiative forcing and atmospheric absorption from the BASE simulation.
long-wave aerosol absorption in the storm tracks becomes smaller compared to long-wave absorption in the predomi-nantly clear-sky dust plume. Dust storms frequently lift min-eral dust to high altitudes (e.g. Colarco et al., 2003), result-ing in a higher mass fraction of DU at high altitudes than for sea salt (see Fig. 11 in Textor et al., 2006). Owing to the colder temperatures at high altitudes, it follows from Stefan-Boltzmann’s law that less of the absorbed long-wave radi-ation is re-emitted than for low-altitude absorption that ef-fectively re-emits at higher temperatures, similar to the un-derlying surface. Consequently, the long-wave aerosol ra-diative forcing at the TOA shows a maximum in the Sa-haran dust plume, reaching about 2–5 W m−2 in the annual mean. On a monthly mean basis, clear-sky long-wave TOA aerosol radiative forcings in the Saharan dust source region
reach about 10–20 W m−2(not shown), in good agreement
with the satellite-derived estimate by Zhang and Christopher (2003). It needs to be emphasised that the present setup of ECHAM5-HAM does not include the super-coarse modes of mineral dust and sea salt (see Stier et al., 2005) so that the long-wave aerosol radiative effect of natural aerosols could be underestimated. However, owing to the short lifetime of super-coarse particles this effect is probably limited to the source regions.
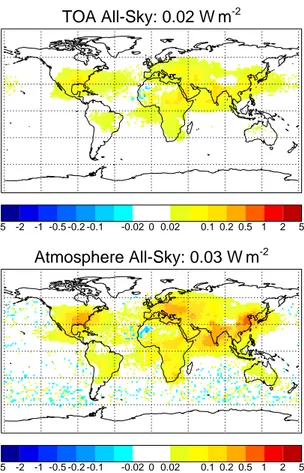
As expected from theory, the simulated annual-mean long-wave anthropogenic aerosol absorption (0.03 W m−2) and TOA radiative forcing (0.02 W m−2) are small (Fig. 11, note
the different scales) compared to the short-wave absorption and radiative forcings. Maxima of anthropogenic absorption and TOA forcing reach about 0.2 and 1 W m−2in the main anthropogenic source regions, respectively.
4.5 Cloud radiative properties considering the effects of aerosol inclusions
Simulated aerosol and aerosol-cloud short-wave absorption optical depths from the simulation with the consideration of interstitial aerosols and black carbon inclusions on the cloud radiative properties CL-INC, the simulation with interstitial in-cloud aerosols but without the black carbon inclusion ef-fect CL-INT, and the simulation with all in-cloud aerosol considered interstitial CL-EXT are given in Fig. 12. While the cloud absorption optical depth, i.e. the absorption optical depth of embedded aerosols, for pure water clouds in CL-INT and CL-EXT is negligible, the consideration of black carbon inclusions for the cloud radiative properties in CL-INC results in an inclusion AAOD of 0.6×10⁻³. The con-sideration of all in-cloud aerosol as interstitial increases the
interstitial AAOD in CL-EXT to 0.3×10⁻³as compared to
0.2×10⁻³in CL-INT and CL-INC.
From the simulated short-wave total aerosol atmospheric absorption differences between CL-INC and CL-INT given in Fig. 13, it is evident that the absorption by BC inclusions results in an all-sky absorption of 0.05 W m−2, with maxima
TOA All-Sky: 0.02 W m
-2-5 -2 -1 -0.5 -0.2 -0.1 -0.02 0 0.02 0.1 0.2 0.5 1 2 5
Atmosphere All-Sky: 0.03 W m
-2-5 -2 -1 -0.5 -0.2 -0.1 -0.02 0 0.02 0.1 0.2 0.5 1 2 5
Fig. 11. Year 2000 instantaneous long-wave anthropogenic aerosol
TOA direct radiative forcing and atmospheric absorption from the BASE simulation.
in regions with high inclusion AAODs. However, the absorp-tion enhancement over the fully externally mixed in-cloud aerosol population trough comparison with the the difference of CL-EXT – CL-INT is very small.
The resulting short-wave TOA total aerosol forcing pertur-bation owing to BC inclusions, shown in Fig. 13 as the dif-ference between CL-INC and CL-INT, is small with a global annual-mean of 0.02 W m−2. The TOA forcing perturbation owing to the consideration of all aerosols as an external mix-ture in CL-EXT as opposed to the case of only the interstitial residual in CL-INT, given as the difference between CL-EXT and CL-INC, shows small positive values in the regions with high AAODs and small negative values over regions with high hydrophilic aerosol burdens. This can be explained by the the fact that the effect of non BC aerosol components, such as sea salt, on the cloud radiative properties is generally considered small and was thus neglected in CL-INT while their effect is included in the fully externally mixed intersti-tial aerosol in CL-EXT. Thus, the enhanced scattering due to interstitial sea salt in CL-EXT results in the small negative forcing perturbation over the oceans.
5 Conclusions
We have presented a comprehensive examination of aerosol absorption with a focus on evaluating the sensitivity of the global distribution of aerosol absorption to key uncertainties in the process representation.
For this purpose we employed the aerosol-climate model ECHAM5-HAM with prognostic representation of the aerosol composition, size-distribution, and mixing-state (Stier et al., 2005) and extended it by:
– Alternative refractive indices for black carbon (Bond
and Bergstrom, 2006) and extended look-up tables of the short-wave aerosol radiative properties covering a wider refractive index range.
– Alternative methods for the calculation of effective
re-fractive indices of internally mixed modes based on the Bruggeman and Maxwell-Garnett effective medium ap-proaches.
– A new look-up table approach for the ECHAM5 cloud
radiative properties, considering the effect of aerosol in-clusions in cloud droplets and ice crystals employing the Maxwell-Garnett effective medium approach.
– A long-wave aerosol radiation module in analogy to the
short-wave look-up table approach.
– A module for the calculation of instantaneous aerosol
forcing.
– Alternative lower- and upper-bound land surface-albedo
datasets derived from the AeroCom aerosol model inter-comparison forcing experiment submissions.
For our investigation of aerosol absorption we performed pairs of present day (2000) and pre-industrial (1750) sim-ulations for BASE: as in Stier et al. (2005), BB-M: up-dated medium absorbing refractive indices from Bond and Bergstrom (2006), BB-H: updated highly absorbing refrac-tive indices from Bond and Bergstrom (2006), BRUG: as BB-M but with Bruggeman (1935) mixing rule for effective refractive indices, ALB-L: as BB-M but employing a lower bound of currently used land-surface albedos derived from AeroCom, ALB-H: as BB-M but employing a higher bound of currently used land-surface albedos derived from Aero-Com, CL-INC: as BB-M but with consideration of aerosol inclusions for cloud radiative properties.
Evaluation of the simulated aerosol absorption optical depth with retrievals from the AERONET sun-photometer network shows for all simulations a good agreement in the large scale global patterns with maxima in the biomass burn-ing regions of Central Africa and South America, in the Sa-haran dust plume, and in regions with high anthropogenic ac-tivities over India and South East Asia. On a regional basis, general and seasonal biases, such as an underestimation of
CL-INC CL-INT CL-EXT Inclusion AAOD: 0.6x10⁻³ 0 0.00001 0.00005 0.0002 0.001 0.005 0.02 0.1 Inclusion AAOD: 0.0x10⁻³ 0 0.00001 0.00005 0.0002 0.001 0.005 0.02 0.1 Inclusion AAOD: 0.0x10⁻³ 0 0.00001 0.00005 0.0002 0.001 0.005 0.02 0.1 Interstitial AAOD: 0.2x10⁻³ 0 0.00001 0.00005 0.0002 0.001 0.005 0.02 0.1 Interstitial AAOD: 0.2x10⁻³ 0 0.00001 0.00005 0.0002 0.001 0.005 0.02 0.1 Interstitial AAOD: 0.3x10⁻³ 0 0.00001 0.00005 0.0002 0.001 0.005 0.02 0.1
Fig. 12. Annual-mean in-cloud broad-band visible (0.25–0.69 µm) aerosol absorption optical depths from the CL-INC, CL-INT, and CL-EXT
simulations, integrated over the cloudy layers of the atmospheric column. Inclusion AAOD: inclusion aerosol AAOD, i.e. cloud absorption optical depth with consideration of black carbon inclusions; Interstitial: interstitial AAOD.
the AAOD at the urban Mexico City and central European sites, and differences among the simulations become evi-dent. The spatio-temporally very inhomogeneous measure-ments do not seem to allow one to derive a global measure of the model performance. However, it becomes clear from the seasonal evaluation at 38 AERONET sites that the update of the BC refractive indices from Hess et al. (1998) to Bond and Bergstrom (2006) significantly improves the previous underestimation of AAOD in the BASE simulation. From this evaluation we conclude that the BB-M and the similar BRUG simulation seem to provide the best representation of the AERONET retrieved AAOD – for the black carbon emis-sions used in all ECHAM5-HAM simulations (Bond et al., 2004). It has to be pointed out that the retrieval of AAOD from AERONET measurements is subject to nonnegligible uncertainty, in particular for low AODs. However, it is ar-guably the most accurate measurement of ambient aerosol absorption available.
From comparison of the BB-M simulation with that simu-lation in which all aerosols are artificially made completely non-absorbing, we calculate that absorption acts to reduce the global annual-mean negative short-wave anthropogenic aerosol forcing of BB-M by 0.26 W m−2(33%) for the clear-sky and 0.34 W m−2(72%) for the all-sky case.
Our results confirm that the basic assumptions about the BC refractive index play a key role for aerosol absorption and radiative forcing; changing it from the widely used values
n=1.75+0.44 i in BASE (Hess et al., 1998) to the medium
absorbing values of n=1.85+0.71 i recommended by Bond and Bergstrom (2006) (values at λ=550 nm) in BB-M al-ters the annual-mean short-wave anthropogenic aerosol forc-ing clear-sky from −0.65 W m−2 to −0.53 W m−2and all-sky from −0.27 to −0.13 W m−2. By comparison, replacing the commonly used volume-weighted mixing for the calcula-tion of the effective refractive indices for the internally mixed modes by the more accurate Bruggeman (1935) mixing rule changes the BB-M forcings only by −0.06 W m−2for clear skies and by −0.05 W m−2for all skies.
The effect of the enhanced aerosol absorption in BB-M, which shows better agreement with the AERONET re-trieved aerosol absorption optical depth than BASE, to fur-ther reduce the negative aerosol radiative forcing is in con-tradiction to some recent, more negative, satellite-based esti-mates of anthropogenic TOA aerosol radiative forcings: Bel-louin et al. (2005) report clear-sky −1.9±0.3 W m−2 and all-sky −0.8±0.1 W m−2; Chung et al. (2005) report clear-sky −1.08 W m−2and all-sky −0.35±0.25 W m−2; Yu et al. (2006) report clear-sky −1.33±0.82 W m−2. It has to be pointed out that the used passive satellite sensors cannot re-trieve aerosols in the presence of clouds, adding to the uncer-tainty of the all-sky satellite estimates.
However, not only uncertainties in the aerosol system it-self affect estimates of aerosol radiative forcing. Other fac-tors in its calculation also contribute to the large diversity in current aerosol forcing estimates. In particular, the surface albedo plays a crucial role as its value determines the sign of


![Fig. 3. ECHAM5-HAM simulated BASE year 2000 mean clear- clear-sky aerosol absorption optical depth [1] at wavelength λ=550 nm, comparison of simulated (red) and AERONET sun-photometer re-trieved (black) clear-sky aerosol absorption optical depth [1] as s](https://thumb-eu.123doks.com/thumbv2/123doknet/14555137.537395/12.892.453.817.74.885/simulated-absorption-wavelength-comparison-simulated-aeronet-photometer-absorption.webp)
![Fig. 5. ECHAM5-HAM simulated BB-H year 2000 mean clear- clear-sky aerosol absorption optical depth [1] at wavelength λ=550 nm, comparison of simulated (red) and AERONET sun-photometer re-trieved (black) clear-sky aerosol absorption optical depth [1] as s](https://thumb-eu.123doks.com/thumbv2/123doknet/14555137.537395/13.892.454.818.65.888/simulated-absorption-wavelength-comparison-simulated-aeronet-photometer-absorption.webp)
![Fig. 7. Simulated year 2000 anthropogenic aerosol short-wave clear-sky atmospheric absorption , all-sky atmospheric absorption, clear-sky TOA forcing, and all-sky TOA forcing [W m − 2 ] for the BASE, BB-M, BB-H, BRUG, ALB-L, ALB-H, and TRANS scenarios](https://thumb-eu.123doks.com/thumbv2/123doknet/14555137.537395/14.892.96.791.109.1004/simulated-anthropogenic-aerosol-atmospheric-absorption-atmospheric-absorption-scenarios.webp)