HAL Id: halshs-01179283
https://halshs.archives-ouvertes.fr/halshs-01179283
Preprint submitted on 22 Jul 2015HAL is a multi-disciplinary open access archive for the deposit and dissemination of sci-entific research documents, whether they are pub-lished or not. The documents may come from teaching and research institutions in France or abroad, or from public or private research centers.
L’archive ouverte pluridisciplinaire HAL, est destinée au dépôt et à la diffusion de documents scientifiques de niveau recherche, publiés ou non, émanant des établissements d’enseignement et de recherche français ou étrangers, des laboratoires publics ou privés.
Sylviane Guillaumont Jeanneney, Ping Hua
To cite this version:
Sylviane Guillaumont Jeanneney, Ping Hua. The impact of Chinese competition on Africa’s manu-facturing. 2015. �halshs-01179283�
C E N T R E D'E T U D E S E T D E R E C H E R C H E S S U R L E D E V E L O P P E M E N T I N T E R N A T I O N A L
The impact of Chinese competition on Africa’s manufacturing
Sylviane GUILLAUMONT JEANNENEY
Ping HUA
Etudes et Documents n° 21
Juillet 2015
CERDI
65 BD. F. MITTERRAND
63000 CLERMONT FERRAND – FRANCE TEL.+33473177400
FAX +33473177428 www.cerdi.org
To cite this document:
Guillaumont Jeanneney S., Hua P. (2015) “The impact of Chinese competition on Africa’s manufacturing”, Etudes et Documents, n° 21, CERDI.
http://cerdi.org/production/show/id/1721/type_production_id/1
SERIE ETUDES ET DOCUMENTS
The authors
Sylviane Guillaumont Jeanneney Professor
Clermont Université, Université d'Auvergne, CNRS, UMR 6587, CERDI, F-63009 Clermont Fd Email : sylviane.guillaumont@udamail.fr
Ping Hua
CNRS Researcher
Clermont Université, Université d'Auvergne, CNRS, UMR 6587, CERDI, F-63009 Clermont Fd Email : ping.hua@udamail.fr
Corresponding author: Ping Hua
Etudes et Documents are available online at: http://www.cerdi.org/ed
Director of Publication: Vianney Dequiedt Editor: Catherine Araujo Bonjean
Publisher: Mariannick Cornec ISSN: 2114 - 7957
Disclaimer:
Etudes et Documents is a working papers series. Working Papers are not refereed, they
constitute research in progress. Responsibility for the contents and opinions expressed in the working papers rests solely with the authors. Comments and suggestions are welcome and should be addressed to the authors.
This work was supported by the LABEX IDGM+ (ANR-10-LABX-14-01) within the program “Investissements d’Avenir” operated by the French National Research Agency (ANR)
Abstract
In this paper, the impact of Chinese competition on Africa’s manufacturing value added is analyzed through a model of manufacturing. Using panel data on 44 African countries covering the period 2000 to 2013, and controlling for the usual determinants of industrialization – such as the size of the domestic market, the quality of infrastructure and governance – we find that exports of manufactured goods by China and other countries to African countries mainly exert a negative effect on African manufacturing, while a moderate real appreciation of African currencies vis-à-vis the renminbi positively influences manufacturing value added, probably due to the reduced cost of imported machine and transport equipment from China (which accounted for 36% of total African imports from China in 2013) and to the reduced price of imported consumption goods increasing the remuneration of poor workers and therefore improving their productivity. However, a strong real appreciation (of more than 33%) instead exerts a negative effect on African’s manufacturing, as traditional theory predicts.
Key words: manufacturing, China, Africa, real exchange rates. JEL codes: E6, F6, O55, L6.
1. Introduction
Industrialization has been the dream for developing countries in order to attain high incomes and to create employment. While many Asian countries have successfully realized this dream, this is far from the case for African countries. The share of the manufacturing value added of African countries1 in the world total increased modestly from 1.5% in 2000 to 1.9% in 2013, while that of Asia increased from 30% to 46%. As Figure 1 shows, African real manufacturing value added (in 2005 US dollars) increased slowly over the period, while its share in real GDP decreased from 12% in 2000 to 10% in 2013.
Figure 1. African real manufacturing added value (MAV) and its share in real GDP
Source: World Bank’s World Development Indicators and authors’ estimations.
1
Only 44 African countries are retained in the calculation because of unavailable data for the rest (data from the World Bank’s World Development Indicators and authors’ estimations; for a detailed explanation, see Section 3).
9 9,5 10 10,5 11 11,5 12 12,5 0 20 40 60 80 100 120 140 2 0 0 0 2 0 0 1 2 0 0 2 2 0 0 3 2 0 0 4 2 0 0 5 2 0 0 6 2 0 0 7 2 0 0 8 2 0 0 9 2 0 1 0 2 0 1 1 2 0 1 2 2 0 1 3 (% ) 20 05 b ill io n U S$ MAV MAV/GDP
There is a sharp contrast between the low rate of growth of Africa’s manufacturing and the rapid growth of China’s exports of manufactured goods to Africa. While the manufacturing added value in real terms (in 2005 US dollars) of 44 African countries rose from $86 billion in 2000 to $133 billion in 2013 (i.e. an annual average growth rate of 3.5%), China’s exports of manufactured goods to Africa increased from $4.4 billion in 2000 to $86.7 billion in 2013 (i.e. an average annual growth rate of 28%). Moreover, the average annual growth rate of China’s exports of manufactured goods to Africa was much higher than that of exports from the rest of the world to Africa (12.9%). China’s share in the global exports of manufactured goods to Africa thus increased from 5% in 2000 to 25% in 2013, with considerable variation across African countries (from a share of 2.7 % in Swaziland to 66% in Togo in 2013).
Is China slowing down Africa’s industrialization through its huge exports of manufactured goods to the continent? This question is all the more relevant as African manufactured goods are principally sold on domestic markets. The share of goods manufactured in Africa that are exported is low on average; in 2010 it ranged from 0.3% in Burundi to 28.7% in Mauritius.2 Therefore, it is likely that competition from foreign suppliers exerts its effects on African manufacturing mostly on domestic markets, rather than on foreign markets.
The aim of this paper is to analyze the different factors that determine the competitiveness of African manufacturing enterprises and to analyze the special role of China. We assume that competition from foreign enterprises exerts pressure on African enterprises through the volume and the diversity of foreign exports as well as their relative prices. The
2 Output and exports of manufactured goods originate from INDSTAT2 UNIDO and UNCTAC STAT, respectively.
rest of the paper presents the model to be estimated, the econometric estimation and finally the results.
2. The model to be estimated
Three types of factors are considered to affect manufacturing in Africa.
1) Structural factors that influence transaction costs. These essentially comprise the level of
infrastructure, landlocked status, the quality of institutions and the size of the domestic market, all of which are essential for explaining the development of the manufacturing sector in Africa (Carey et al., 2007). Their expected effects are positive, except in the case of being landlocked. Special Economic Zones created in African countries by the Chinese government to develop manufacturing activities are also expected to have a positive impact.
2) Foreign competitors. These include (i) competitors in domestic markets, whose extent
can be measured by the volume of manufactured goods imported by African countries from China and from the rest of the world; and (ii) competitors in foreign markets, whose extent can be measured by the volume of exports of manufacturing goods by China and the rest of the world to the world market. Their expected effects are negative. The greater in volume and the more diversified the manufactured goods exported by foreigners to domestic African and foreign markets, the more significant the negative effects on the manufacturing of African countries are likely to be.
3) The relative price of manufactured goods, which can be expressed using real exchange
rates with different trade weights according to the competitors and markets considered. Exonerations of customs duties must also be taken into account, as some African countries belong to customs unions and have signed agreements with the United States (i.e. the African Growth and Opportunity Act, or AGOA) or with the
European Union (i.e. the “Everything but Arms” initiative, or EBA) allowing quota- and tariff-free access to their markets (de Melo, and Portugal-Perez, 2012). The suppression of customs duties by developed countries (in order to make African exports easier) and African customs unions are expected to have positive impacts on manufacturing. However, the impact of real exchange rates is ambiguous.
The traditional view is that a depreciation of the real exchange rate has a positive impact on manufacturing as it improves the competitiveness of local enterprises vis-à-vis their foreign competitors on domestic and foreign markets and may therefore reduce the volume of foreign exports (discussed above). This assumption has been put forward in particular by Rodrick (2008), who advises the governments of low-income countries to systematically undervalue their exchange rates in order to compensate for the handicaps they face due to market failures.
However, some arguments play in the other direction (Guillaumont Jeanneney and Hua, 2011). The first is that the intensification of foreign competition due to a real appreciation of the currency is favorable to the productivity of manufactured firms, as some of these firms are obliged to close their worst-performing factories or even disappear. This is a kind of Schumpeterian “creative destruction” benefiting the best-performing enterprises and seems to be the case, for example, for the Ethiopian shoeindustry (Gebre-Egziabher, 2009; Redi, 2009; Sonobe et al., 2009). The second is that a real appreciation not only implies a rise in domestic prices relative to foreign prices, but also a change in the internal structure of prices or a rise in the price of non-tradable goods vis-à-vis the price of tradable goods. As non-qualified work is a typical non-tradable good, an appreciation of the real exchange rate increases the real remuneration for unskilled workers expressed in tradable goods. One may suppose that this increase would induce an improvement in the efficiency of workers in countries where the wages of unskilled workers are still very low (Guillaumont and
Guillaumont Jeanneney, 1991). As early as 1957, Leibenstein stressed that in developing countries, labor remuneration that is too low might negatively impact workers' health and their working capacity, and he showed that the motivation of workers acts on efficiency – what he referred to as “X-efficiency” (Leibenstein, 1957, 1966). This hypothesis appears relevant to the context of Africa, where workers’ wages are particularly low. The third argument is that a real appreciation reduces the relative cost of imported capital goods and increases wages relative to the cost of capital. This induces more capitalistic production, encourages technological innovations and thus increases labor productivity and manufacturing competiveness. It is certainly possible, therefore, that imports of certain types of manufactured goods – such as machines and transport equipment – are favorable to the manufacturing competiveness of African countries, in contrast to imports of consumption goods. In 2013, the share of Africa’s imports of machines and transport equipment coming from China was 36%.
The real exchange rate issue is all the more important as several African countries have experienced a strong appreciation of their real exchange rates (see Figure 3). The appreciation of the real effective exchange rates of African countries relative to the currencies of their main manufacturing trade partners3 was 21% from 2000 to 2013 (Figure 2). This is higher than their appreciation relative to the renminbi (19%), which is due in turn to the recent appreciation of the renminbi relative to the US dollar since 2011. When considering just the
3The real effective exchange rate of African countries is calculated as a geometric average of the real effective exchange rates of African countries weighted by the trade share of each African country in the total trade of considered African countries. The real effective exchange rate of an individual African country is measured as the geometric average of the real bilateral exchange rates of this African country relative to its main trade partners weighted by the trade share of each partner in the total of all considered trade partners of the country.
period from 2000 to 2010, the real appreciation of African countries’ currencies vis-à-vis the renminbi was particularly high at 52%, compared with the appreciation of 25% relative to the continent’s main trade partners. Indeed, the evolution of the Chinese real effective exchange rate relative to the currencies of African countries has been markedly different from that of its exchange rate relative to the currencies of China’s main trade partners. From 2000 to 2013, the renminbi depreciated by 19% in real terms relative to African trade partners, while it appreciated by 25% relative to China’s own main trade partners (Figure 2).
Figure 2. China’s real effective exchange rate relative to its main trade partners and the real exchange rates of African countries relative to their main trade partners and to China
Source: IMF’s International Financial Statistics and CERDI calculations.
Note: A rise in the curve means a depreciation of the real effective exchange rate of China relative to
its trade partners, an appreciation of the real effective exchange rates of African countries relative to
their trade partners or an appreciation of real exchange rates of African countries relative to China.
0 20 40 60 80 100 120 140 160 2 0 0 0 2 0 0 1 2 0 0 2 2 0 0 3 2 0 0 4 2 0 0 5 2 0 0 6 2 0 0 7 2 0 0 8 2 0 0 9 2 0 1 0 2 0 1 1 2 0 1 2 2 0 1 3 (2 0 0 0 = 1 0 0 )
Africa REER/main trade partners Africa REER/China
The changes in the real exchange rates of individual African countries relative to China exhibit great diversity, as do their exchange rates relative to their other trading partners. Over the period from 2000 to 2013, the currencies of 29 African countries appreciated relative to the renminbi in real terms while those of the rest depreciated, with the two most extreme cases being the real appreciation of the Eritrean nakfa by 8.4% and the real depreciation of the Congolese franc (the currency of the Democratic Republic of Congo) by 7.3% (Figure 3). This diversity allows an econometric estimation of the controversial impact of real exchange rates on African countries’ manufacturing.
Fig. 3. Annual average change of African bilateral real exchange rates relative to the renminbi, 2000-2013 (%)
Note: A positive value means a real appreciation of African currencies relative to the renminbi. Source: Authors’ calculations using data from the IMF’s International Financial Statistics.
In a first equation, we focus on competition from China on African domestic markets, since most manufactured goods produced by African countries are destined for the domestic market. The first equation to be estimated is the following:
-10 -8 -6 -4 -2 0 2 4 6 8 10 C on go D . R . Se yc he lle s M al aw i G am bi a Ta nz an ia Tu ni si a Si er ra L eo ne A lg er ia D jib ou ti M or oc co G ui ne a U ga nd a M au rit iu s G ha na B ur un di R w an da G ab on M au rit an ia M oz am bi qu e So ut h A fr ic a Se ne ga l M ad ag as ca r Eg yp t N ig er C am er oo n Li be ria C ab o V er de M al i G ui ne a-B is sa u C ha d C ot e d' Iv oi re B ur ki na F as o To go C en tra l A fr ic an B en in C om or os C on go R Et hi op ia N ig er ia Su da n Za m bi a K en ya A ng ol a Er itr ea
Equation (1) it fit cit ijt it it it it it
a
a
Inf
a
PC
a
G
a
I
a
Z
a
XC
a
XF
a
ERM
MAV
ln
ln
ln
ln
ln
ln
=
0+
1+
2+
3+
4+
5+
6+
7+
8where MAV represents the added value of manufacturing, Inf captures the level of infrastructure, PC represents private consumption or the size of the domestic market, G represents the quality of institutions or governance, I is a dummy variable for landlocked status, Z is a dummy variable representing Chinese Special Economic Zones created in African countries, XC is China’s exports of manufactured goods to an African country and
XF the exports of manufactured goods from the rest of the world (excluding China) to an
African country, and ERM represents the real effective exchange rates of the African countries relative to their main import partners weighted by the geographical origins of imports of manufactured goods. In order to better capture the special role of China, for each African country ERM is divided into a real bilateral exchange rate relative to China and a real effective exchange rate relative to the country’s other import partners. The indices i, c, f and t represent, respectively, African countries, China, the rest of the word and the years.
In a second equation, the factors of Africa’s export competitiveness are added to the above equation. The resulting second equation is the following:
Equation (2) it fit cit ijt it it it it it
a
a
Inf
a
PC
a
G
a
I
a
Z
a
XC
a
XF
a
ER
MAV
ln
ln
ln
ln
ln
ln
=
0+
1+
2+
3+
4+
5+
6+
7+
8 iit it it fwt cwta
XFW
a
AGOA
a
EBA
a
CU
XCW
a
9ln
+
10ln
+
11+
12+
13+
where XCW and XFW are, respectively, the exports of manufactured goods by China and other countries to the world market, AGOA and EBA are dummy variables with value equal to 1 when African countries participate in customs agreements with the United States or with Europe and 0 otherwise, CU is a dummy variable equal to 1 if African countries belong to a customs union, and ER represents the real effective exchange rates relative to trade partners
now weighted by the destination of exports of manufactured goods as well as the geographical origins of imports. As before, ER is divided into the real exchange rate of African countries relative to their trade partners (excluding China) and the real bilateral exchange rate relative to China.
Three disturbance terms (unobserved individual effects fixed over time, temporal effects and error terms) are added into equations (1) and (2) to be estimated empirically. Recall that the expected signs of all the variables are positive except for exports of China and other countries to Africa or to the rest of the world, and inland that are negative. However, the signs of the real exchange rates are uncertain.
3. Econometric estimation
The econometric analysis of manufacturing added value is applied to the panel data for 44 African countries over the period 2000 to 2013. The beginning year corresponds to the first
China/Africa Cooperation Forum, and the choice of the African countries depends on data
availability. Equatorial Guinea, Libya, Sao Tome & Principe, Somalia and Zimbabwe are excluded because of unavailable data on manufacturing added value. Botswana, Lesotho, Namibia and Swaziland are excluded because of unavailable data on exports of manufactured goods in the CEPII BACI database, which are used to calculate the trade weights in the real effective exchange rates.
The manufacturing added value is the net output of industries belonging to the International Standard Industrial Classification (ISIC) divisions 15-37 after adding up all outputs and subtracting intermediate inputs. The data are in real terms (2005 US dollars) and originate from the World Bank’s World Development Indicators. For Algeria, Chad, D.R. Congo, Guinea-Bissau, Libya and Madagascar, the World Development Indicators give the growth rate of the real manufacturing added value in 2005 dollars, which are converted into
volume by using nominal manufacturing value added in 2005. We note that the data on manufacturing output published by UNIDO are available only for a few countries and for a few years. In any case, manufacturing added value is a better indicator than output because it is net of intermediate inputs.
The level of infrastructure is based on the African infrastructure development index calculated by the African Development Bank (2013), which includes transport, electricity, ICT, water and sanitation. The data end in 2010, and we have assumed that infrastructure levels are the same for 2011, 2012 and 2013. Private consumption is real household expenditure in 2005 US dollars, taken from the United Nations Statistical Division. The quality of institutions is represented by a measure of political stability and the absence of violence/terrorism, one of the six measures of the quality of governance proposed by Kaufmann et al. (2010) and calculated each year by the World Bank.4 The measure has estimated values from -2.5 to 2.5, with a higher value indicating better governance outcomes. Kaufmann et al. (2010) did not report on quality of governance for 2001, which is calculated as the average of the quality of governance between 2000 and 2002. Inland is a dummy variable equal to 1 for landlocked African countries and 0 otherwise. China’s Special Economic Zones (SEZs) in Africa, which are aimed at developing manufacturing activities in African countries, are represented by a dummy variable equal to 1 for the African countries and the years in which an SEZ was created, and 0 for the remaining countries and years. Data on this are drawn from Bräutigam and Tang (2011).
4 Kaufmann et al. (2010) propose six measures of governance quality: voice and accountability, political stability and absence of violence/terrorism, government effectiveness, regulatory quality, rule of law, and control of corruption (for detailed data, see http://info.worldbank.org/governance/wgi/pdf/wgidataset.xls). The results of the estimations are similar for the six measures.
Data on the exports of manufactured goods from China and the rest of the world to Africa and to the world market are obtained from UNCTAD statistics. The various real exchange rates come from CERDI and are calculated using the nominal exchange rates and consumer prices issued by the IMF in its International Financial Statistics. These are weighted by the geographical origin of imports of manufactured goods for the estimation of the first equation, and also by the destination of exports for the second equation, both coming from CEPII’s BACI database (Gaulier and Zignago, 2010).
AGOA is a dummy variable equal to 1 for the years in which those sub-Saharan
African countries that have received AGOA beneficiary status from the United States and 0 for the rest. In 2000, the United States adopted the African Growth and Opportunity Act (AGOA)5 to facilitate the exports of sub-Saharan African countries to the American market by exonerating customs tariffs under some conditions. Approximately 30 countries are AGOA beneficiaries, and the list is revised each year by the United States. Several countries are added and several are excluded each year. EBA is a dummy variable equal to 1 for the 34 Least Developed Countries (LDCs) 6 and 0 for the rest. The Everything but Arms (EBA) initiative, adopted by the European Union on 5 March 2001, has resulted in all imports to the European Union (EU) from the LDCs (as defined by the United Nations) being duty-free and quota-free, with the exception of weapons. We choose to introduce as customs unions the West African Economic and Monetary Union (WAEMU)7 and the Central African Economic
5 See www.agoa.info for details.
6 Angola, Benin, Burkina Faso, Burundi, Cape-Verde, Central African Rep., Chad, Comoros, Congo
Dem Rep, Djibouti, Equatorial Guinea, Eritrea, Ethiopia, Gambia, Guinea, Guinea-Bissau, Lesotho, Liberia, Madagascar, Malawi, Mali, Mauritania, Mozambique, Niger, Rwanda, Sao Tome and Principe, Senegal, Sierra Leone, Somalia, Sudan, Tanzania, Togo, Uganda and Zambia.
and Monetary Community (CAEMC),8 as they are the most complete and efficient customs unions in Africa, and moreover feature a common currency (Carrère, 2004, 2006).
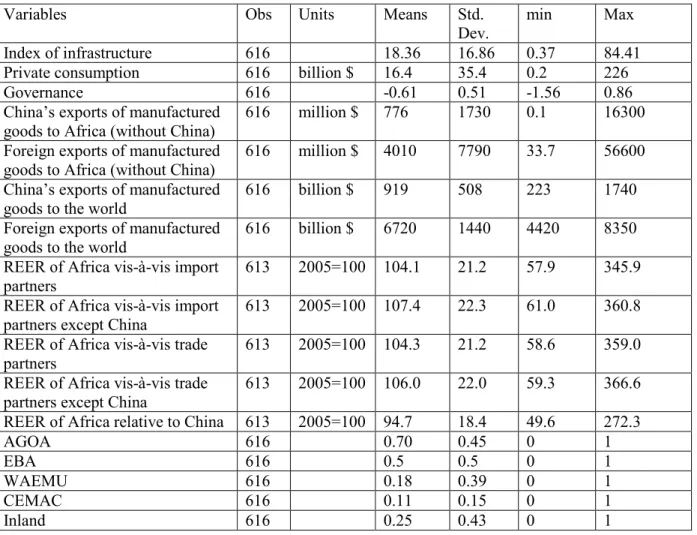
The means and standard deviations of the variables are provided in Table 1 and the definitions and sources of all the variables are presented in Table A1 in the Appendix.
Two econometric methods of panel data analysis are applied to control for unobservable individual heterogeneity (Wooldridge, 2002; Hsiao, 2003; Baltagi, 2005). The fixed effects model uses a within estimator and deals with individual specific effects across African countries by including a dummy variable for each country, but has the weakness that the time-invariant independent variables (such as inland, WAEMU, CAEMC and EBA) are lost from the estimation, and this method retains a risk of endogeneity. Hausman and Taylor’s (1981) estimator overcomes these drawbacks by instrumenting the endogenous variables in a random effects model. In the present estimations, several variables are considered to be endogenous – private consumption of African countries, exports of manufactured goods from China and the rest of the world to Africa and to the world, real exchange rates and China’s Special Economic Zones – but not infrastructure, governance of African countries, WAEMU, CAEMC, AGOA, EBA or inland.
Before performing the econometric regressions in the equations, we need to know if the variables are stationary at an absolute level to avoid fallacious results. Panel data unit root tests (Levin et al., 2002 and Im et al., 2003) are thus applied in which time trend and panel-specific means (fixed effects) options are used; the variables are lagged by one period. The mean of the series across panels is subtracted from the series to mitigate the impact of cross-sectional dependence (Levin et al., 2002). The results reported in Table A2 of the Appendix allow us to reject the null hypothesis that all the panels contain a unit root, so we can accept
the alternative hypothesis that the variables are stationary at an absolute level. Therefore, the estimations of the equations are not spurious.
The econometric results of the two methods are presented in Table 2 for equation (1) and in Table 3 for equation (2). The results of the two econometric methods are very similar. The comments here are focused on the results of the Hausman-Taylor model with time-fixed and country-fixed effects.
The dominant factor of manufacturing added value is the size of the domestic market: a rise of 1% in household consumption increases manufacturing added value by 0.57% (column 6 of Table 2). This result was expected, in particular as production for the local market generally acts as a learning process before exporting. Good infrastructure and good institutions exert significant positive effects on manufacturing. The effects of being landlocked and of China’s Special Economic Zones are not statistically significant, probably due to the facts that the local products are mainly sold in domestic markets and the SEZs are either in their first period of operation or are still under construction (Bräutigam and Tang, 2011).
It seems that exports of manufactured goods from China and the rest of the world to Africa are detrimental to African industrialization, mainly through the competition they create with African manufactured products on the continent’s domestic markets. Their estimated coefficients are -0.04 and -0.06, respectively (column 6, Table 2). The coefficient of China’s exports is lower than that of the rest of the world, probably due to the high share of machine and transport equipment in China’s exports to Africa. However, as the growth of exports of manufactured goods from China to African countries (28%) was more than double the growth of exports from the rest of the world (12.9%) during the period from 2000 to 2013, China’s negative impact on African manufacturing (an annual average rate of decrease of manufacturing added value of -1.12% (-0.04*28%) in African countries) was in fact higher
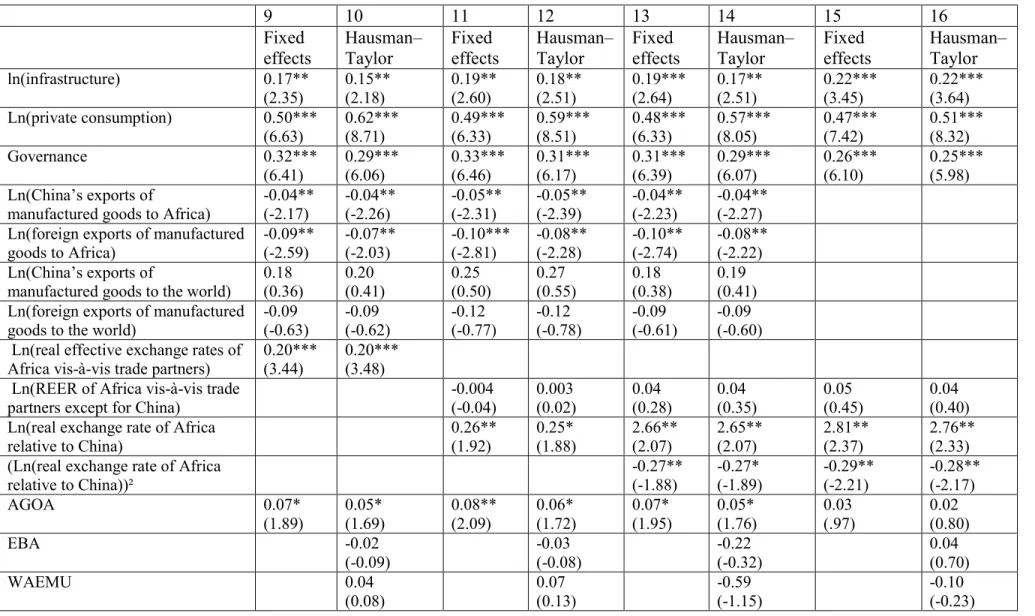
than that of the rest of the world (0.90% (-0.06*12.9%)). In total, foreigners contributed an annual average rate of decrease of -1.92% in African countries, which is somewhat more than half the annual average growth rate of African manufacturing added value during the same period (3.5%). On the other hand, exports from China and the rest of the world to the world market have had no impact on African manufacturing added value, probably due to the weak share of exported goods in manufacturing added value (column 14, Table 3).
In contrast to the traditional view, the appreciation of the real exchange rates of African countries is favorable to manufacturing. This effect seems principally to be due to the appreciation relative to the renminbi (columns 3 to 8, Table 2), which likely reduces the price of current consumption goods more than the appreciation relative to the other foreign currencies. It could also be due to the reduced cost of capital through the imports of machines and transport equipment from China (which made up 36% of total imports from China in 2013). We can imagine that this positive impact of the real exchange rate is decreasing. Indeed, this appears to be the case when the real exchange rate and its square are simultaneously introduced into the regression (see columns 5 and 6 of Table 2). The turning point of the real exchange rate is 133, suggesting that a high appreciation of African currencies (by more than 33% relative to 2005) exerts a negative effect on manufacturing, while a weaker appreciation of the currencies has a positive effect. Moreover, the positive impact of a real appreciation remains even if the exports of manufactured goods from China and the rest of the world to an African country are removed (columns 7 and 8 in Table 2), although a real appreciation of African currencies stimulates African imports from outside and in this way may be detrimental to manufacturing (Guillaumont Jeanneney and Hua, 2015). Finally, among the measures of customs tariff exoneration, only AGOA exerts a positive effect on manufacturing production in Africa.
4. Conclusion
In this paper, we focus on the impacts of Chinese competition on Africa’s manufacturing added value. To this end, we use a panel data of 44 African countries over the period from 2000 to 2013 to estimate a model of manufacturing. We control for the usual determinants of industrialization – such as the size of the domestic market, and the quality of infrastructure and governance – and we confirm that improvements in domestic infrastructure and institutions and the size of the domestic market are very important for African industrialization.
We find that the exports of manufactured goods to Africa by both China and other countries exert a negative effect on African industrialization, while a moderate real appreciation of African currencies vis-à-vis the renminbi influences manufacturing value added positively. We explain the latter effect by the reduced cost of imported machine and transport equipment from China (which accounted for 36% of African total imports from China in 2013) and by the reduced price of imported consumption goods, which raises the remuneration of poor workers and therefore improves their productivity. However, a strong real appreciation that pushes the real exchange rate index beyond 133 (the mean is 97) exerts a negative effect on African’s manufacturing, as predicted by the traditional theory.
African industrialization is still in its first phase in which locally produced manufactured goods are limited and are mainly intended for domestic markets; the continent suffers greatly from import competition coming from China and other foreign countries. Some trade protectionism could therefore be justified. However, a systematic real depreciation of African exchange rates would probably not be appropriate, as it would have a negative impact on the productivity of local firms. On the other hand, and in accordance with the traditional theory, in a second phase of industrialization a real depreciation could be favorable to the exports of manufactured goods by African countries. From this standpoint, the recent
stabilization (since 2010) and then depreciation of the real exchange rates of African countries, particularly in relation to the renminbi, is good news.
In any case, improvements to infrastructure and governance, in which African governments should play a leading role, seem essential for the development of manufacturing of African countries.
References
African Development Bank (2013), “The Africa Infrastructure AIDI Development Index (AIDI)”, AfDB Economic Brief, Abidjan, Côte d'Ivoire (www.afdb.org).
Baltagi, B. (2005), Econometrics Analysis of Panel Data, 3rd ed., Chichester, UK: John Wiley and Sons.
Bräutigam, D. and X. Y. Tang (2011), “African Shenzhen: China’s special economic zones in Africa”, Journal of Modern African Studies 49(1): 27–54.
Carey, K., S. Gupta and U. Jacoby (2007), Sub-Saharan Africa: Forging New Trade Links
with Asia, Washington DC: International Monetary Fund.
Carrère, C. (2004), “African Regional Agreements: Impact on Trade with or without Currency Unions”, Journal of African Economies 13(2): 199-239.
Carrère, C. (2006), “Revisiting the Effects of Regional Trading Agreements on trade flows with Proper Specification of the Gravity Model”, European Economic Review 50(2): 223-247.
Gaulier, G. and S. Zignago (2010), “BACI: International Trade Database at the Product-Level: The 1994-2007 Version”, CEPII Working Paper N° 2010-2, October.
Gebre-Egziabher, T. (2009), “The developmental impact of Asian drivers on Ethiopia with emphasis on small-scale footwear producers”, The World Economy 32(11): 1613– 1637.
Guillaumont, P. and S. Guillaumont Jeanneney (1991), “Exchange Rate Policies and the Social Consequences of Adjustment in Africa”, in A. Chhibber and S. Fischer (eds),
Economic Reform in Sub-Saharan Africa, Washington, DC: The World Bank, 13-24.
Guillaumont Jeanneney, S. and P. Hua (2011), “How Does Real Exchange Rate Influence China’s Labour Productivity?” China Economic Review 22 (4): 628-645.
Guillaumont Jeanneney, S. and P. Hua (2015), “China’s African Financial Engagement, Real Exchange Rates and Trade between China and Africa”, Journal of African Economies 24(1): 1–25.
Hausman, J. A. and W. E. Taylor (1981), “Panel data and unobservable individual effects”,
Econometrica 49(6): 1377–1398.
Hsiao, C. (2003) Analysis of Panel Data, 2nd ed. Cambridge University Press, UK.
Im, K.S., M.H. Pesaran and Y. Shin (2003), “Testing for Unit Roots in Heterogeneous Panels”, Journal of Econometrics 115: 53–74.
Kaufmann, D., A. Kraay and M. Mastruzzi (2010), “The Worldwide Governance Indicators: A Summary of Methodology, Data and Analytical Issues”, World Bank Policy Research Working Paper No. 5430, Washington, DC.
Leibenstein, H. (1957), Economic Backwardness and Economic Growth, New York: Wiley. Leibenstein, H. (1966), “Allocative Efficiency versus X-Efficiency”, American Economic
Review 56(3): 392-415.
Levin, A., C. F. Lin and C.-S.J. Chu (2002), “Unit Root Tests in Panel Data: Asymptotic and Finite-Sample Properties”, Journal of Econometrics 108: 1–24.
de Melo, J. and A. Portugal-Perez (2012), “Preferential Market Access Design: Evidence and Lessons from African Apparel Exports to the US and to the E.U.”, World Bank Policy
Research Working Paper No. 6357, February.
Redi, O. (2009), “From ashes, an industry reborn”, Fortune (Addis Ababa), March 22.
Rodrik, D. (2008), “The Real Exchange Rate and Economic Growth”, Brookings Papers on
Economic Activity 39(2): 365-412.
Sonobe, T., J. E. Akoten and K. Otsuka (2009), “An exploration into the successful development of the leather-shoe industry in Ethiopia”, Review of Development
Wooldridge, J. M. (2002), Econometric Analysis of Cross Section and Panel Data, 2nd ed. Cambridge, MA: MIT Press.
Table 1: Summary of variables
Variables Obs Units Means Std.
Dev. min Max
Index of infrastructure 616 18.36 16.86 0.37 84.41
Private consumption 616 billion $ 16.4 35.4 0.2 226
Governance 616 -0.61 0.51 -1.56 0.86
China’s exports of manufactured
goods to Africa (without China) 616 million $ 776 1730 0.1 16300 Foreign exports of manufactured
goods to Africa (without China) 616 million $ 4010 7790 33.7 56600 China’s exports of manufactured
goods to the world 616 billion $ 919 508 223 1740
Foreign exports of manufactured
goods to the world 616 billion $ 6720 1440 4420 8350
REER of Africa vis-à-vis import
partners 613 2005=100 104.1 21.2 57.9 345.9
REER of Africa vis-à-vis import
partners except China 613 2005=100 107.4 22.3 61.0 360.8 REER of Africa vis-à-vis trade
partners 613 2005=100 104.3 21.2 58.6 359.0
REER of Africa vis-à-vis trade
partners except China 613 2005=100 106.0 22.0 59.3 366.6 REER of Africa relative to China 613 2005=100 94.7 18.4 49.6 272.3
AGOA 616 0.70 0.45 0 1
EBA 616 0.5 0.5 0 1
WAEMU 616 0.18 0.39 0 1
CEMAC 616 0.11 0.15 0 1
Table 2: The determinants of real manufacturing added value of African countries (2005 US dollars), 2000-2013 (equation 1)
1 2 3 4 5 6 7 8
Fixed
effects Hausman–Taylor Fixed effects Hausman–Taylor Fixed effects Hausman–Taylor Fixed effects Hausman–Taylor
ln(infrastructure) 0.17*** (2.81) 0.18*** (3.03) 0.20*** (3.15) 0.16** (2.37) 0.20*** (3.20) 0.21*** (3.41) 0.21*** (3.31) 0.21*** (3.55) Ln(private consumption) 0.56*** (8.87) 0.59*** (9.67) 0.56*** (8.73) 0.61*** (9.08) 0.54*** (8.55) 0.57*** (9.26) 0.49*** (8.13) 0.53*** (8.95) Governance 0.28*** (6.78) 0.27*** (6.67) 0.30*** (7.01) 0.31*** (6.40) 0.28*** (6.74) 0.27*** (6.64) 0.25*** (6.17) 0.25*** (6.08) Inland -0.47 (-1.18) -0.62 (-1.35) -0.47 (-1.15) -0.35 (-0.93)
China’s Special Economic
Zones -0.02 (-0.34) -0.01 (-0.25) -0.04 (-0.67) (-0.16) -0.01 -0.04 (-0.68) -0.03 (-0.99) 0.01 (0.14) 0.01 (0.21) Ln(China’s exports of
manufactured goods to Africa) -0.04** (-2.33) -0.04** (-2.37) -0.05*** (-2.76) -0.04** (-2.30) -0.04** (-2.33) -0.04** (-2.37) Ln(foreign exports of
manufactured goods to Africa) -0.07** (-2.19) -0.06** (-2.00) -0.07** (-2.19) -0.07** (-2.16) -0.07*** (-2.29) -0.06** (-2.12) Ln(REER of Africa relative to
import partners) 0.19*** (3.67) 0.17*** (3.66) Ln(REER of Africa relative to
its import partners except China)
-0.05
(-0.42) 0.35 (0.73) 0.03 (0.24) 0.02 (0.21) 0.05 (0.41) 0.04 (0.36) Ln(REER of Africa relative to
China) 0.29** (2.46) 0.26** (1.97) 2.70** (2.33) 2.64** (2.29) 3.00** (2.58) 2.93** (2.53)
(Ln(REER of Africa relative to
China))² -0.27** (-2.15) -0.27** (-2.10) -0.31** (-2.42) -0.30** (-3.37)
R² 0.51 0.54 0.53 0.53
Number of observation 613 613 613 613 613 613 613 613
Number of countries 44 44 44 44 44 44 44 44
Country-fixed effects yes yes yes yes yes yes yes yes
Table 3: The determinants of real manufacturing added value of African countries (2005 US dollars), 2000-2013, in an augmented model with competitors on foreign markets (equation 2)
9 10 11 12 13 14 15 16
Fixed
effects Hausman–Taylor Fixed effects Hausman–Taylor Fixed effects Hausman–Taylor Fixed effects Hausman–Taylor
ln(infrastructure) 0.17** (2.35) 0.15** (2.18) 0.19** (2.60) 0.18** (2.51) 0.19*** (2.64) 0.17** (2.51) 0.22*** (3.45) 0.22*** (3.64) Ln(private consumption) 0.50*** (6.63) 0.62*** (8.71) 0.49*** (6.33) 0.59*** (8.51) 0.48*** (6.33) 0.57*** (8.05) 0.47*** (7.42) 0.51*** (8.32) Governance 0.32*** (6.41) 0.29*** (6.06) 0.33*** (6.46) 0.31*** (6.17) 0.31*** (6.39) 0.29*** (6.07) 0.26*** (6.10) 0.25*** (5.98) Ln(China’s exports of
manufactured goods to Africa) -0.04** (-2.17) -0.04** (-2.26) -0.05** (-2.31) -0.05** (-2.39) -0.04** (-2.23) -0.04** (-2.27) Ln(foreign exports of manufactured
goods to Africa) -0.09** (-2.59) -0.07** (-2.03) -0.10*** (-2.81) -0.08** (-2.28) -0.10** (-2.74) -0.08** (-2.22) Ln(China’s exports of
manufactured goods to the world) 0.18 (0.36) 0.20 (0.41) 0.25 (0.50) 0.27 (0.55) 0.18 (0.38) 0.19 (0.41) Ln(foreign exports of manufactured
goods to the world) -0.09 (-0.63) -0.09 (-0.62) -0.12 (-0.77) -0.12 (-0.78) -0.09 (-0.61) -0.09 (-0.60) Ln(real effective exchange rates of
Africa vis-à-vis trade partners) 0.20*** (3.44) 0.20*** (3.48) Ln(REER of Africa vis-à-vis trade
partners except for China) -0.004 (-0.04) 0.003 (0.02) 0.04 (0.28) 0.04 (0.35) 0.05 (0.45) 0.04 (0.40)
Ln(real exchange rate of Africa
relative to China) 0.26** (1.92) 0.25* (1.88) 2.66** (2.07) 2.65** (2.07) 2.81** (2.37) 2.76** (2.33)
(Ln(real exchange rate of Africa
relative to China))² -0.27** (-1.88) -0.27* (-1.89) -0.29** (-2.21) -0.28** (-2.17) AGOA 0.07* (1.89) 0.05* (1.69) 0.08** (2.09) 0.06* (1.72) 0.07* (1.95) 0.05* (1.76) 0.03 (.97) 0.02 (0.80) EBA -0.02 (-0.09) -0.03 (-0.08) -0.22 (-0.32) 0.04 (0.70) WAEMU 0.04 (0.08) 0.07 (0.13) -0.59 (-1.15) -0.10 (-0.23)
CEMAC -0.49 (-0.78) -0.17 (-0.24) 0.03 (0.06) -0.59 (-1.10) Inland -0.58 (-1.16) -0.69 (-1.35) -0.53 (-0.83) -0.34 (-0.89) R² 0.51 0.52 0.52 0.53 Number of observation 613 613 613 613 613 613 613 613 Number of countries 44 44 44 44 44 44 44 44
Country-fixed effects yes yes yes yes yes yes yes yes
Appendix Table A1: Definitions and sources of variables
Name of variables Calculation methods Sources
Real manufacturing added value Real manufacturing value added of African countries (2005 US$) World Bank World Development
Indicators
Infrastructure A composite indicator of transport, roads and telecommunication in
Africa African Development Bank
Private consumption Household consumption expenditure in 2005 $ United Nation Statistics Division
Governance Political stability in African countries calculated by Kaufmann et al.
(2010) World Bank
Landlocked countries Dummy variable equal to 1 for landlocked African countries Authors’ identification
China’s bilateral exports of manufactured
goods to African countries China’s exports of manufactured goods to African countries divided by the import unit values of the last ones (2005=100) UN Comtrade UN UNCTAD stat Foreign real exports of manufactured
goods to African countries Exports of manufactured goods of the world (except China) to African countries divided by import unit values of the last ones (2005=100) UN Comtrade UN UNCTAD stat China’s exports of manufactured goods to
the world China’s exports of manufactured goods to the world except the considered African country divided by its export unit values (2005=100)
UN Comtrade UN UNCTAD stat Foreign exports of manufactured goods to
the world Foreign exports of manufactured goods (except China) to the world except the considered African country divided by world export unit values (2005=100)
UN Comtrade UN UNCTAD stat Real effective exchange rates of Africa
relative to import partners Real effective exchange rates of African countries relative to import partners Calculated by CERDI using data from the IMF’s International Financial Statistics
Real effective exchange rates of Africa
relative to import partners except China Real effective exchange rates of African countries relative to import partners except China Calculated by CERDI using data from the IMF’s International Financial Statistics
Real effective exchange rates of Africa
relative to trade partners Real effective exchange rates of African countries relative to their trade partners Calculated by CERDI using the data from the IMF’s International Financial Statistics
Real effective exchange rates of Africa
relative to trade partners except China Real effective exchange rates of African countries relative to trade partners except China Calculated by CERDI using data from the IMF’s International Financial Statistics
countries versus China deflated by relative consumer prices between African countries and
China Statistics
AGOA Dummy variable equal to 1 for African countries benefiting customs
exonerations to the American market Agoa.info
EBA Dummy variable equal to 1 for 30 African countries having the status
of Least Developed Countries China’s Special Economic Zones in
African countries Dummy variable equal to 1 if a Chinese SEZ exists in African countries (Mauritius, Niger and Zambia since 2006, Algeria, Egypt, Ethiopia and Nigeria since 2007) and 0 otherwise
Bräutigam and Tang (2011)
WAEMU Dummy variable equal to 1 for Benin, Burkina Faso, Côte d’Ivoire,
Guinea-Bissau, Mali, Niger, Senegal, Togo
CAEMC Dummy variable equal to 1 for Cameroon, Chad, the Central African
Appendix 2. Results of panel data unit root tests
Variables Levin-Lin-Chu unit root
test*
Im-Pesaran-Shin unit root test*
African manufacturing value added 0.0000 0.0000
Infrastructure 0.0000 0.1645
private consumption 0.0000 0.0000
Governance 0.0000 0.0000
China’s exports of manufactured goods to Africa 0.0000 0.0000
Foreign exports of manufactured goods to Africa 0.0010 0.0000
China’s exports of manufactured goods to the world 0.0004 0.0158
Foreign exports of manufactured goods to the world 0.0000 0.0048
REER of Africa vis-à-vis import partners 0.0027 0.0092
REER of Africa vis-à-vis import partners except China 0.0065 0.0073
REER of Africa vis-à-vis trade partners 0.0080 0.0149
REER of Africa vis-à-vis trade partners except China 0.0031 0.0132
REER of Africa relative to China 0.0021 0.0088


![Risiko- & [und] Schutzfaktoren der psychischen Gesundheit humanitärer Einsatzhelfer : eine systematische Literaturübersicht](data:image/gif;base64,R0lGODlhAQABAIAAAP///wAAACH5BAEAAAAALAAAAAABAAEAAAICRAEAOw==)