HAL Id: hal-02911804
https://hal.inrae.fr/hal-02911804
Submitted on 4 Mar 2021
HAL is a multi-disciplinary open access
archive for the deposit and dissemination of
sci-entific research documents, whether they are
pub-lished or not. The documents may come from
teaching and research institutions in France or
abroad, or from public or private research centers.
L’archive ouverte pluridisciplinaire HAL, est
destinée au dépôt et à la diffusion de documents
scientifiques de niveau recherche, publiés ou non,
émanant des établissements d’enseignement et de
recherche français ou étrangers, des laboratoires
publics ou privés.
Distributed under a Creative Commons Attribution| 4.0 International License
Comparing ultrafiltration and equilibrium dialysis to
measure unbound plasma dolutegravir concentrations
based on a design of experiment approach
David Metsu, Thomas Lanot, François Fraissinet, Didier Concordet,
Véronique Gayrard-Troy, Manon Averseng, Alice Ressault, Guillaume
Martin-Blondel, Thierry Levade, Frédéric Février, et al.
To cite this version:
David Metsu, Thomas Lanot, François Fraissinet, Didier Concordet, Véronique Gayrard-Troy, et al..
Comparing ultrafiltration and equilibrium dialysis to measure unbound plasma dolutegravir
concen-trations based on a design of experiment approach. Scientific Reports, Nature Publishing Group,
2020, 10 (1), �10.1038/s41598-020-69102-y�. �hal-02911804�
Comparing ultrafiltration
and equilibrium dialysis to measure
unbound plasma dolutegravir
concentrations based on a design
of experiment approach
David Metsu
1,2, Thomas Lanot
1, François Fraissinet
1, Didier Concordet
3, Véronique Gayrard
4,
Manon Averseng
1, Alice Ressault
1, Guillaume Martin‑Blondel
5,6, Thierry Levade
7,8,
Frédéric Février
9, Etienne Chatelut
2,10, Pierre Delobel
5,6& Peggy Gandia
1,3,11* Dolutegravir therapeutic drug monitoring (tDM) could be improved by measuring the unbound dolutegravir plasma concentration (Cu), particularly in patients experiencing virological failure or toxicity despite achieving appropriate DTG total plasma concentrations. Equilibrium dialysis (ED) is the gold standard to measure Cu, but ED is time consuming, precluding its use in clinical practice. In contrast, ultrafiltration is applicable to TDM, but is sensitive to numerous analytical conditions. In order to evaluate measurements of Cu by ultrafiltration, ultrafiltration conditions were validated by comparison with ED. DTG concentrations were measured by LC–MS/MS. Three ultrafiltration factors (temperature, duration and relative centrifugal force [RCF]) were evaluated and compared to ED (25/37 °C), using a design of experiment strategy. Temperature was found to influence Cu results by eD (p = 0.036) and UF (p = 0.002) when results were analysed with ANOVA. Relative centrifugal force (2000 g) and time (20 min) interacted to influence Cu (p = 0.006), while individually they did not influence Cu (p = 0.88 and p = 0.42 for RCF and time). Ultrafiltration conditions which yielded the most comparable results to ED were 37 °C, 1000 g for 20 min. Ultrafiltration results greatly depended on analytical conditions, confirming the need to validate the method by comparison with ED in order to correctly interpret DTG Cu.Dolutegravir (DTG) is an efficient and well-tolerated antiretroviral currently used in antiretroviral therapeu-tic strategies1,2. Clinical studies have confirmed that the efficacy of DTG depends on drug plasma exposure
(concentrations)3,4 and several efficacy-related targets have been proposed5,6. However, virological failures have
been reported despite total concentrations (Ct) deemed to be efficient and close to the values recorded in HIV patients without virological failure5–7. Furthermore, the toxic neuro-psychiatric events described in a general HIV
population cannot be explained by differences in DTG Ct8. Thus, therapeutic drug monitoring (TDM) which is
open
1Department of Pharmacokinetics and Toxicology, Toulouse University Hospital, Toulouse, France. 2INSERM, CRCT, Toulouse University, UPS, Toulouse, France. 3INTHERES, INRA, ENVT, Toulouse University, Toulouse, France. 4Toxalim, Toulouse University, INRA, ENVT, Toulouse, France. 5Department of Infectious Diseases, University Hospital of Toulouse, Toulouse, France. 6Inserm U1043 - CNRS UMR 5282, Toulouse-Purpan Pathophysiology Center, 31173 Toulouse Cedex, France. 7Department of Biochemistry, Toulouse University Hospital, Toulouse, France. 8INSERM UMR1037, CRCT (Cancer Research Centre of Toulouse), Toulouse University, UPS, Toulouse, France. 9Department of Laboratory Medicine, GCS Ingres-Quercy, Montauban Hospital, Montauban, France. 10Institut Claudius-Regaud, IUCT-Oncopole, Toulouse, France. 11Laboratoire de Pharmacocinétique Et Toxicologie (Pharmacokinetics and Toxicology Laboratory), Centre Hospitalo-Universitaire Purpan (Purpan University Medical Centre), 330 avenue de Grande-Bretagne, 31059 Toulouse, France. *email: gandia.p@chu-toulouse.fr
2 Scientific RepoRtS | (2020) 10:12265 | https://doi.org/10.1038/s41598-020-69102-y
www.nature.com/scientificreports/
currently based on Ct, reveals some limitations, and an alternative pharmacokinetic marker of exposure may be of interest in order to improve DTG-based strategies.
Dolutegravir (MW 419 g mol−1) is highly bound to plasma proteins (> 99%), binding mainly to albumin and,
to a lesser extent, to the alpha-1-acid glycoprotein9. The amount of unbound DTG which is able to diffuse into
tissues and across the cell membrane is relatively low10. It can therefore be assumed that any variation in the low
amount of the unbound DTG form, which may not be detected by measuring the total plasma concentration of the drug, could explain the variability in pharmacodynamic effects such as virological failures or neuro-psychic events. Consequently, inter-individual variability of exposure to unbound DTG exposure (concentration) may explain differences in efficacy and/or toxicity to a greater extent than the total DTG concentration.
Before evaluating the pharmacokinetic/pharmacodynamic (PK/PD) relationship, it is particularly impor-tant to validate the method used to determine unbound DTG exposure (concentrations). Indeed, the unbound DTG concentration is directly related to the target virological concentration which yields DTG efficacy in the HIV compartment11. Equilibrium dialysis (ED) and ultrafiltration (UF) are the two main methods available to
measure the concentration of the unboundDTG form. Because (1) non-specific binding (NSB) is low and (2) the unbound form is evaluated at binding equilibrium (BE), ED is considered the gold standard for evaluating concentrations of the unbound form of a drug12,13. However, this technique is time-consuming to perform and is
not suitable for clinical trials or routine hospital laboratories12,13. In contrast, UF is a rapid, convenient method,
that can be used to process many samples12,13. To date, UF is increasingly used to measure unbound exposure.
However, despite high NSB and known analytical interferences, many authors still apply previously published UF technical conditions without validating these against ED14,15.
The aims of the current study were (1) to compare the characteristics of ED and UF approaches to explore DTG unbound exposures and (2) to determine the analytical conditions which validate the UF method when compared to ED.
Materials and methods
LC–MS/MS technique.
Unbound and total dolutegravir concentrations were measured by a liquid chro-matography—tandem mass spectrometry (LC–MS/MS) method which has been previously described16. Briefly,this method involves adding 200 µL of a precipitating reagent containing a deuterated internal standard to 50 µL of plasma, dialysate or ultrafiltrate prior to the LC–MS/MS analysis (ABSciex API-4500). Calibrator con-centrations ranged between 50–10,000 ng/mL and 0.5–100 ng/mL for total and unbound DTG, respectively. Additional details about this LC–MS/MS method and performance are described in a previous study16. Briefly,
inter-day and intra-day assays for unbound and total DTG concentrations (coefficient of variation) ranged from 1.28% to 7.09% for precision and from − 2.00 to + 13.87% for accuracy16. Precision and accuracy results, for both
unbound and total concentrations, are detailed in supplemental data 1.Inter-day assays were performed over five different days (n = 15 samples for each corresponding quality control concentration) and intra-day assays were performed on five repeat samples for each corresponding quality control concentration.
Sample preparation.
Total DTG quality-control (QC) samples were prepared by diluting known concen-trations of the working solution in plasma to yield final theoretical concenconcen-trations of 150, 1,500 and 7,500 ng/ mL. For the unbound DTG QC, known concentrations of working samples were diluted in Sorensen buffer to yield final theoretical concentrations of 1.5, 15, and 75 ng/mL. More information on sample preparation is avail-able in an earlier published study16.Measuring unbound DTG concentrations in plasma.
Equilibrium dialysis. Equilibrium dialysis wasperformed in 1 mL Teflon cells using the Dianorm apparatus (Diachema AG, Zurich, Switzerland) with equilib-rium achieved through Visking Dialysis Tubing membrane (molecular mass cut-off: 12,000-14000 Da, Medicell Membranes Ltd, London, UK). A 1 mL plasma aliquot was dialysed against 1 mL of Sorensen phosphate buffer (pH 7.4), in a chamber set to a nominal and controlled temperature of 37 °C and rotated at 12 rpm for 4 h (the Sorensen buffer preparation protocol is described in supplemental data 2). The resulting plasma and buffer dialysates were then promptly recovered from the Teflon cells and analysed by LC–MS/MS. Fifty microliters of dialysate was diluted with 200 µL of mobile phase containing 1 ng/mL of DTG-d4. Fifty microliters were injected into the LC–MS/MS system. Following dialysis, the remaining plasma was extracted with 200 µL of methanol containing DTG-d4 and then diluted in water (a fifth dilution). Analytical validation of DTG unbound fraction (fu, calculated as the ratio of unbound substance on total concentration; fu = Cu/Ct) through ED is described in detail in a previous study and summarised in a supplemental figure (supplemental data 3)16.
Ultrafiltration. Unbound-DTG determined using UF was measured in parallel to ED (on the same day). Prior
to plasma UF, filters were pre-washed at 20 °C with LC–MS grade water for 20 min at 2000 g, according to the manufacturer’s recommendations. Five hundred microliters of either a DTG spiked sample or patient plasma was incubated in a Centrifree (Millipore, Billerica, MA), with a molecular weight cut-off of 30,000 Da. The optimal UF conditions (temperature, time and relative centrifugal force [RCF]) were selected based on results from the reference method (ED at 37 °C). After UF, DTG was extracted from the plasma ultrafiltrate as previ-ously described for the ED dialysate in the corresponding ED section above (see supplemental figure from sup-plemental data 3).
Equilibrium dialysis vs. ultrafiltration. Plasma samples used to compare both methods were spiked with 1 mg/L
of DTG, which approximates concentration usually observed7. Following plasma spiking, samples were stored at
37 °C). We used a complete design of experiment (DOE) approach to predict the experimental conditions which would yield the most comparable readings between ED and UF. This procedure is useful to identify the level of interference from independent factors, such as temperature or from the interaction of two or more factors, such as time of centrifugation versus temperature17. The influence of three such analytical factors on UF results was
evaluated. Two levels were studied for each factor: temperature (25 and 37 °C), RCF (1,000 and 2000 g) and cen-trifugation time (10 and 20 min). Eight different operating conditions were used to study these three parameters simultaneously, using five repeats per condition (refer to Table 1). The five repeats have been performed during a same assay. The sequence of analysis of the 8 UF conditions was randomised. In order to investigate the source of interferences on unbound DTG values, volume of ultrafiltration (Vuf) was determined, as described in
‘Ultra-filtration method evaluation headings’. Results from UF were compared to ED results at 37 °C.
The choice of the optimal UF conditions adopted was primarily based on results of statistical analyses (no statistically significant difference between UF and ED at 37 °C) and low dispersion of the results under the same condition (based on the coefficient of variation and 95% confidence intervals).
The data was compared to results obtained with ED at 37 °C, which was considered as the reference value, in accordance to previously published suggestions12.
Comparison of dialysate and ultrafiltrate matrix. As the same extraction procedure was applied to dialysate
and ultrafiltrate samples, both matrices were compared. For that purpose, blank ultrafiltrates and dialysates were spiked with 1.5 and 75 ng/mL of DTG, respectively and extracted. The final DTG concentrations measured were subsequently compared.
Ultrafiltration method evaluation. The precision and accuracy of UF was determined using two kinds of
sam-ples (spiked and patient plasma samsam-ples). Inter-day assays were performed on spiked and patient samsam-ples on four different days, both by UF and ED (as reference method). The ratio of UF/ED fu (RUF/ED) was calculated for each
sample. The accuracy, defined as (mean RUF/ED − 1) × 100, and the precision, defined as (SD/mean RUF/ED) × 100
(SD = RUF/ED standard deviation), were calculated. To date, there is no official guideline to evaluate accuracy/
precision of the ultrafiltration method. A consortium of pharmaceutical companies recommends a precision fu CV < 30%. Based on FDA bioanalytical guidelines (for analytical procedures), a value of 100 + /− 20% was used as a criterion for accuracy. The accuracy of UF results was evaluated in relation to ED, which is the reference method to evaluate fu. It should be noted that the assumption of concordance between fu ED 37 °C/in vivo has not been verified using current procedures.
To evaluate DTG NSB, a LC/MS grade water solution was spiked with DTG at 1 mg/L and then serially diluted to yield samples of: 0.1, 0.01 and 0.001 mg/L. The dolutegravir concentration was measured in five replicate sam-ples of each of these individual dilutions. Assays were performed at 25 and 37 °C in parallel. Non-specific binding was calculated as follows: NSB(%) = (1 − ultrafiltrate concentration/initial concentration) × 100. The weight of the ultrafiltrate obtained was used to calculate Vuf. The density of the ultrafiltrate was extrapolated by comparison
to the weight of 100 µL Vuf which did not contain any DTG.
In order to achieve Vuf lower than 50% of the initial plasma volume12, a short-duration (five minutes) UF
assay was evaluated, independently of the DOE assays. Five plasma samples were each spiked with 1 or 0.1 mg/L of DTG. Ultrafiltration was then performed on five repeats of each of these concentrations at the following two conditions: (1) “short-duration” UF (37 °C, 1000 g, 5 min) and (2) UF condition providing comparable results to ED 37 °C (37 °C, 1,000 g, 20 min). Vuf was predicted according to the same method previously described. Both
total and unbound DTG concentrations were measured.
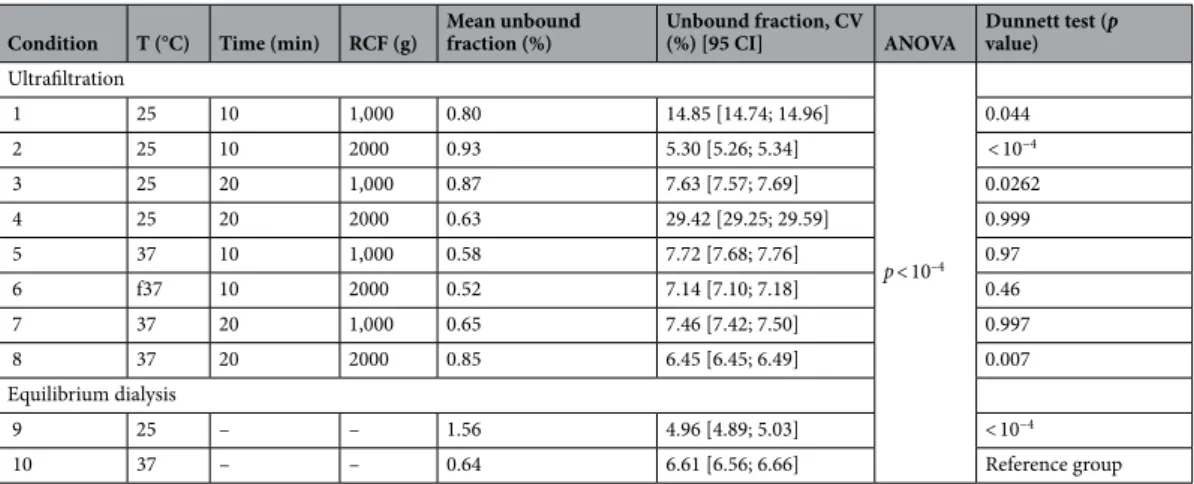
Table 1. Design of experiment comparing 8 conditions of ultrafiltration and 2 conditions of equilibrium
dialysis for n = 5 samples each. CV coefficient of variation, ANOVA analysis of variance, min minutes; g gravitational constant, T temperature, CI95 confidence interval, RCF relative centrifugal force.
Condition T (°C) Time (min) RCF (g) Mean unbound fraction (%) Unbound fraction, CV (%) [95 CI] ANOVA Dunnett test (p value) Ultrafiltration p < 10–4 1 25 10 1,000 0.80 14.85 [14.74; 14.96] 0.044 2 25 10 2000 0.93 5.30 [5.26; 5.34] < 10−4 3 25 20 1,000 0.87 7.63 [7.57; 7.69] 0.0262 4 25 20 2000 0.63 29.42 [29.25; 29.59] 0.999 5 37 10 1,000 0.58 7.72 [7.68; 7.76] 0.97 6 f37 10 2000 0.52 7.14 [7.10; 7.18] 0.46 7 37 20 1,000 0.65 7.46 [7.42; 7.50] 0.997 8 37 20 2000 0.85 6.45 [6.45; 6.49] 0.007 Equilibrium dialysis 9 25 – – 1.56 4.96 [4.89; 5.03] < 10−4 10 37 – – 0.64 6.61 [6.56; 6.66] Reference group
4 Scientific RepoRtS | (2020) 10:12265 | https://doi.org/10.1038/s41598-020-69102-y
www.nature.com/scientificreports/
Influence of confounding parameters on fu results. In order to explore the effect of a first freeze/thaw cycle on
DTG/protein binding, assays were conducted on five DTG TDM samples. We evaluated any changes in pH, before and after thawing. A pH meter from Siemens RapidPOINT® 500 controller was used to measure pH. Unbound DTG concentrations were measured using the following UF protocol (37 °C, 1,000 g during 20 min; comparable to ED results).
Temperature (25/37 °C) is a parameter that may disrupt drug binding to plasma proteins12, as it is the case for
calcium (Ca) binding to albumin18. This is particularly significant as a binding interaction (chelation) between
Ca and DTG has been previously described19. In order to explain variations of DTG fu in ED according to
temperature, pH and ionised Ca were measured on paired plasma samples (n = 5) at 25 and 37 °C. Plasma meas-urements were performed on the Siemens RapidPOINT® 500 controller. Sample temperature was maintained at 37 °C with a device routinely used for the determination of serum cryoglobulins. Ionised Ca is defined as free Ca which is able to bind to DTG.
Equilibrium dialysis and ultrafiltration of HIV patient samples. Once the conditions for achieving similar
results between UF and ED were identified for spiked plasma, they were applied to HIV patient samples (n = 16). Immediately after being received at the laboratory, blood samples were centrifuged at 2000 g, + 20 °C for 15 min then the plasma was aliquoted and stored at − 20 °C until required for analysis.
Moreover, since samples (for analysis in a routine hospital laboratory) may not always contain the volume required (500 µl) to perform UF, the unbound form was also determined on duplicate 250 and 500 μL HIV patient plasma samples (n = 5). Assays for both volumes were performed in parallel on the same day.
This was a non-interventional study which did not require any additional procedures to be performed. Dolutegravir TDM and data collection were part of routine patient care. For these reasons, no Institutional Review Board or Ethics Committee approval was required, in accordance with French legislation governing biomedical research20,21.
Statistical analysis.
Analysis of variance (ANOVA) and a normality test were performed. Where the ANOVA test was statistically significant, Dunnett’s test was subsequently performed in order to identify a poten-tial interaction. Results were expressed as median InterQuartileRange[25%;75%] and 95% confidence intervals). Whenever possible, results were associated with a paired t test and expressed as the mean and standard deviation (m ± sd). The relationship between two quantitative variables was assessed using Pearson’s correlation test. The level of significance was set at p < 0.05. Statistical analyses were performed with the R software (3.5.1)22.Results
equilibrium dialysis vs. ultrafiltration.
Results of the full design of experiment (DOE) analysis, com-paring ED and UF are presented in Table 1. Similar results were obtained with an UF of 20 min at 1,000 g and at 37 °C (condition 7). In addition to the statistical outcome, this condition has also been chosen to stress the similarity of the result with ED at 37 °C and the low variability between results.Temperature variations yielded statistically different free fraction (fu) results for both ED (m = 1.56% IQR[1.48;1.57] and m = 0.64% IQR[0.61;0.65], for ED at 25 and 37 °C, respectively; p = 0.036) and UF (m = 0.88% IQR[0.77;0.91] and m = 0.61% IQR[0.55;0.75] as well as for UF at 25 and 37 °C, respectively; p = 0.002), regard-less of duration and RCF.
A comparison of UF temperatures revealed statistically significant differences in Vuf (m = 274 ± 28.2 µL and m = 298 ± 38.8 µL for UF at 25 °C and 37 °C, respectively; p = 0.036).
Furthermore, regardless of temperature conditions, the interaction of RCF (2000 g) and duration (20 min) of UF resulted in statistically different fu, compared to other conditions (p = 0.006 and < 10–4, at 25 and 37 °C,
respectively) (Table 1). Ultrafiltrate volumes were higher in UF conditions performed at 2000 g and for 20 min, compared to the Vuf of other conditions (Table 2). However, when RCF and duration of centrifugation were
ana-lysed independently, no significant differences were observed in either Vuf (p = 0.588 for centrifugation time 10 vs.
20 min and p = 0.882 for RCF 1,000 vs. 2000 g) and fu results (p = 0.42 for centrifugation time 10 vs. 20 min and
Table 2. Results of mean ultrafiltrate volume under different temperature conditions. ANOVA analysis of
variance, g gravitational constant, CV coefficient of variation..
Condition Temperature Volume (µL) mean; CV (%) ANOVA Dunnett test (p value)
1 (1,000 g 10 min) 25 252; 6.3
p = 0.006
0.00916
2 (1,000 g 20 min) 25 264; 9.9 0.03541
3 (2,000 g 10 min) 25 265; 13.1 0.03593
4 (2,000 g 20 min) 25 316; 11.3 Reference group
5 (1,000 g 10 min) 37 257; 6.1
p < 10−4 < 0.001
6 (1,000 g 20 min) 37 289; 7.7 0.0210
7 (2,000 g 10 min) 37 296; 17.0 0.0421
p = 0.88 for RCF 1,000 vs. 2000 g). In this instance, combined variations of duration and RCF (2000 g for 20 min)
influenced Vuf and therefore the unbound fraction result, whereas individually, those conditions had no imapct.
In condition 8, the Vuf was higher compared to the other conditions (at both 25 and 37 °C; p = 10−4; Dunnet’s
test with condition 8 as reference, p < 0.05; for condition 4, only a trend was observed with a mean difference of m = 0,035 CI95 = 0.053).
Comparison of dialysate and ultrafiltrate matrix.
Analytical extraction of DTG from the dialysate or ultrafiltrate was comparable for both low DTG spiked (m = 1.70 ± 0.05 ng/mL and m = 1.78 ± 0.03 ng/ mL for dialysate and ultrafiltrate; p = 0.095) and high DTG concentrations (m = 80.83 ± 1.36 ng/mL and m = 81.93 ± 2.84 ng/mL for dialysate and ultrafiltrate; p = 0.578).Ultrafiltration method evaluation.
Accuracy and precision of UF method were 121.5% and 27.2%. Results revealed NSB ranging from 0.1% to 8.2% over the range of concentrations tested. NSB were compa-rable regardless of DTG concentration and/or temperature (p = 0.317).Five minutes UF led to lower Vuf than a UF duration of 20 min (m = 224.5 mL IQR[212.5; 239.4] and
m = 385.3 mL IQR[368.7; 417.3] for 5 min and 20 min respectively; p < 10−4). While a decrease in V uf and a
shorter duration of UF was associated with higher fu (fu m = 2.32% IQR[2.19; 2.45] and m = 1.83% IQR[1.71; 1.90] for 5 min and 20 min respectively; p < 10−4). The relative V
uf and fu increase, from 5 to 20 min-conditions,
was 43 and 21%, respectively. The variation of fu over time, with the same temperature and RCF condition, was not linear. Between 5 and 20 min, fu decreases and between 10 and 20 min, fu increases (results detailed Table 1; comparison of results from conditions 5 and 7, p = 0.036).
Influence of confounding parameters on fu results.
An increase in pH was observed after one freeze/thaw cycle (proportion of pH increase m = 6.28% IQR[3.71; 8.61]; pH level m = 7.45 IQR[7.35; 7.55] and m = 7.92 IQR[7.75; 8.15], before and after thawing, respectively ; for pH level, mean and standard deviation of differences m = 0.47 sd = 0.28; p = 0.006). Unbound DTG concentrations measured before freezing ranged from 6.62 to 42.00 µg/L and remained unchanged after thawing (mean of relative differences m = 0.023; paired t-testp = 0.586).
At 25 °C pH was significantly lower, compared to measurements made at 37 °C (=+ 0.7% IQR[+ 0.5; + 0.8] for median pH increase; m = 7.53 IQR[7.45; 7.54] and m = 7.57 IQR[7.49; 7.60] for median pH in plasma at 25 °C and 37 °C respectively; p = 0.001 paired samples t-test).
Associated to lower pH, ionised Ca was significantly increased at 25 °C, compared to measurements made at 37 °C (m = −7.4% IQR[− 8.5; − 6.5] for median ionised Ca decrease ; m = 1.07 mM IQR[1.06; 1.11] mM and m = 1.00 mM IQR[0.98; 1.04] for median ionised concentration in plasma at 25 °C and 37 °C respectively;
p = 0.003 paired samples t-test).
Equilibrium dialysis and ultrafiltration on HIV patient samples.
The patient dosage regimen was only based on 50 mg once a day. The seventh condition (following UF conditions: 37 °C with settled centrifu-gation at 1,000 g for 20 min) was then applied to HIV patient samples. Free fraction results did not differ sta-tistically between UF (37 °C, 20 min and 1,000 g) and ED (37 °C) (m = 0.44 ± 0.06% and m = 0.47 ± 0.22% for ED and UF, respectively; p = 0.685). Comparison of 250 and 500 µL plasma volumes for UF did not reveal any statistically significant differences between fu results (m = 0.52 ± 0.09% and m = 0.60 ± 0.13% for 250 and 500 µL, respectively; p = 0.895, t-paired test). No relationship (p = 0.661) was observed between fu and Ct (range of Ct: 0.8 to 6 mg/L).Discussion
In our study, the two most commonly performed techniques for studying protein-drug binding were used and compared to determine the free DTG concentration. Equilibrium dialysis was used as the gold standard12,13 to
evaluate and set the temperature, RCF and duration of centrifugation for UF.
Out of the three test parameters, temperature is the parameter most likely to influence fu results determined by UF12,23–31. However, because temperature could also modify the BE26, UF and ED were both compared in our
study at two different temperatures, namely 25 and 37 °C. Since it allows approximation of the in-vivo condition, 37 °C is therefore considered as the reference temperature12. Consequently, 37 °C was the temperature selected
for UF. Even if condition 4 (25 °C) provided results similar to those obtained with ED at 37 °C, this condition was rejected because (1) the temperature was not within the physiological range (37 °C), (2) the Vuf was > 60% of
initial plasma volume (i.e. it could create a disruption in BE during UF12) and (3) this condition was associated
with greater analytical variability.
Surprisingly and contrary to previous observations27,31,32 and results from our study (ED assays),
increas-ing the temperature (from 25 to 37 °C) resulted in lower fu. Temperature is a parameter which conditions pH level and may thereby interfere with substance/protein BE12. In our study, pH fluctuations were not found to
affect DTG binding. The increase in ionised Ca at 25 °C, compared to 37 °C may have altered the DTG/protein BE and consequently fu. Indeed, DTG like tigecycline33 chelates divalent cations (i.e. Ca, Mg, etc.). It may be
hypothesised, that the increase in Ca in vitro may increase the amount of Ca bound to DTG. Consequently, DTG/protein BE is disrupted and the concentration of DTG-bound to protein is reduced. As the ED membrane between plasma/buffer compartments is permeable to DTG-Ca, this complex is also found in the buffer com-partment. A new BE is achieved and the same amount of DTG/Ca is recovered on both sides of the membrane. The decrease in bound DTG associated with the increase of DTG in the buffer compartment may explain that fu at 25 °C is higher compared to 37 °C. In addition to the indirect effect observed in ED, temperature also
6 Scientific RepoRtS | (2020) 10:12265 | https://doi.org/10.1038/s41598-020-69102-y
www.nature.com/scientificreports/
affected the UF process. This effect was particularly noticeable with conditions 4 and 8 (2000 g/20 min at 25 and 37 °C, respectively; higher fu at 37 °C compared to 25 °C). Indeed, unexpected effects of temperature on fu at those “extreme” conditions of UF were observed (fu decreased at 25 °C and increased at 37 °C) compared to other UF conditions and ED. As neither pH, ionised Ca, nor NSB, could explain these results, temperature may have a direct influence on the UF process. According to Poiseuille’s law and as illustrated by Cinar et al.34 with
blood plasma, fluid viscosity decreases with increasing temperature. At 25 °C, condition 4 ("extreme" condition 2000 g/20 min) led to a larger Vuf compared to other conditions at the same temperature (1, 2 and 3). One can
assume, as observed with 5/20 min UF assays, that such an increase in Vuf resulted in diluting the DTG contained
in the ultrafiltrate. The fu decrease observed with condition 4, compared to other conditions, could therefore be explained by dilution of the ultrafiltrate. Conversely, at 37 °C, plasma viscosity is lowered and could explain even higher Vuf at condition 8 (2000 g 20 min), compared to the other conditions (both 25 and 37 °C). This Vuf
greatly exceeded 50% of the initial plasma volume. The effect of such extreme UF on the BE is currently not well understood12. A disruption in DTG/protein BE could occur at condition 8, leading to an increased amount of
DTG in the ultrafiltrate. As a result, the DTG fu also increases, as observed in our assays.
Besides temperature, RCF/duration interaction, which were poorly evaluated25,27–29,31, or a short duration
(5 min) resulted in an increase of both fu and Vuf. Vuf has been suggested as an indirect flag of the effect of
UF on DTG/protein BE12. However, only sparse information is available relating to fu variations for V
uf > 50%
(comparing with the initial plasma volume) and only high Vuf (> 80%) should be associated with BE disruption.
Moreover, fluctuations in duration did not consistently have the same effect on Vuf and fu. Thus, variations of Vuf/
fu observed with DTG are comparable to those reported by Di et al.28 with vancomycin. These authors attributed
this result to a BE disruption. Such a hypothesis is however not consistent with our results. Indeed, we found that fu decreased between 5 and 20 min while it increased between 10 and 20 min (at 1,000 g and 37 °C in both cases). The non-linear variation of fu over UF duration would therefore imply at least two processes (i.e. at first, a passage of unbound DTG with a high amount of DTG into the primary ultrafiltrate, subsequently followed by the passage of plasma ultrafiltrate, diluting the final ultrafiltrate). However, such results have never been described before and this mechanistic approach, as described in previous articles, is poorly compatible with BE from a thermodynamic point of view (BE reached within microseconds)35. Thus, no UF marker (e.g. V
uf)
predict-ing the conditions leadpredict-ing to identical results as ED at 37 °C for whole substances, has been identified to date. Even if the concordance of fu from ED and in vivo cannot be verified, ED is considered to be the gold standard to determine fu. Thus, for an accurate interpretation of unbound DTG concentration results, an experimental comparison of UF vs ED appears to be essential. The predicted effects of temperature, RCF and UF duration on fu results are summarised in Figure S1.
Based on these results, UF conditions were set at 37 °C, for 10 min at 2000 g. Besides, as the effects of some conditions, such as high pH observed during prolonged sample storage, were not explored in this study, it is recommended to use fresh plasma to study DTG fu. To complete results from DTG spiked samples, unbound forms from HIV patient plasma samples were also measured by both ED at 37 °C and UF at pre-defined condi-tions. Patient results validated UF to confirmed determination of the unbound form of DTG by UF. Moreover, two volumes (250 and 500 µL) were evaluated and validated for routine use of low volume samples.
The extraction procedure with the spiked dialysate buffer or ultrafiltrate did not reveal any interference from the solution matrices. This validation was necessary since their composition was relatively different, in particular the dialysate. Sorensen buffer mainly comprises a phosphate buffer whereas UF is a plasma ultrafiltrate, which therefore has a lower phosphate content36. However, this validation method is not described in the few articles
comparing the two techniques30 although phosphate buffer could be a major limiting factor for LC–MS
tech-niques due to an ion-suppression phenomenon37. In addition, in our method validation process, the first freeze/
thaw cycle led to an increase in plasma pH. However, such an increase did not impair DTG/protein binding, in contrast to previous observations12,33. Non-specific binding of our UF method could be considered low, so there
is no need to integrate a correction of the fu result38. This result could be attributed to the weak lipophilicity
profile of DTG9,35. This result was comparable to that observed with our dialysis technique16. Moreover, NSB
were consistent, regardless temperature (25 °C or 37 °C) and/or DTG concentration. Conditions used during UF allowed accurate determination of fu, compared to ED results obtained when applying recommendations from pharmaceutical company consortium (precision CV < 30%)39.
Despite promising results from our DOE analysis, our study did have some limitations. Indeed, we did not explore the effect of higher total DTG concentrations on UF results. However, since (1) fu results did not vary with total concentrations in HIV patient samples and (2) albumin physiological levels (close to 650 µM)12 are
more than 50 times higher than the DTG total concentration (9.58 µM for the maximal concentration gener-ally observed, close to 4 mg/L)7, protein-binding saturation at the standard DTG concentration is unlikely.
Unfortunately, this result is not as powerful as performing a DOE evaluation and this interpretation should be considered with caution. Another limitation of our study was the evaluation of only two levels for each of the factors examined (temperature, RCF and duration). This approach does not allow the identification of non-linear relationships between parameters (e.g. temperature) and response (fu result), because results from only two levels per factor in a DOE cannot be extrapolated outside of the study conditions.
To date, few data are available on DTG unbound forms in HIV patients. Using an ED technique, at the same temperature, Imaz et al.11, found median fu values similar to ours (0.46% vs. 0.44%). In contrast, the Letendre
et al.14 study which does not describe any device or analytical procedure used, observed a higher fu compared
to Imaz et al.11 and our results (fu = 0.70% at the sixteenth week). Higher fu values from the Letendre et al.14
study were mainly driven by higher unbound concentration values compared to our results and results from Imaz et al.11, while their Ct values were comparable to our results. The discrepancy between published results is
similar to that observed in our study between ED and UF without set conditions. This difference raises the issue of an appropriate interpretation of the unbound form of DTG. Indeed, unbound concentrations were measured
and used (1) to explain DTG tissue diffusion (e.g. CSF and genital organs) and/or (2) to evaluate drug efficacy by comparing an unbound concentration to an in vitro inhibitory concentration (typically IC50)11,14. As a
conse-quence, if the unbound concentration is over-estimated, particularly if using an UF method, the truly effective concentration (unbound) in an anatomical compartment could be misinterpreted. This misreading could intro-duce a bias in the PK-PD analysis and therefore in the selection of dosing regimen for antiretroviral strategies. While unbound concentrations have been deemed effective concentrations, PK/PD study is still confined to a relationship between total concentration and viral load, both in terms of kinetics of decrease3 or rebound
of viral load during virological failure5. This lack of interest in the unbound drug form mainly stems from
pre-analytical and analytical constraints. Indeed, the measurement of unbound concentration requires a more technically intensive bioanalytical approach than determining total concentrations12. Where studies require the
unbound concentration to be measured, the most convenient method, namely UF13 is predominantly chosen
for the analysis. From an organisational point of view, this method is easy and quick to use. But, as stressed in our study, UF may exhibit several analytical disadvantages in the form of ultrafiltration issues involving set UF conditions or NSB12. As has been recommended by several authors12,13,40,41, it is imperative to validate UF
condi-tions versus ED at 37 °C for each individual drug investigated. Many studies have to date explored the unbound form of ARVs, but technical procedures used to measure unbound concentrations are not always described and only a few of these studies compared UF to ED13. The lack of validation of the UF procedure may potentially
introduce a bias when interpreting results or when making comparisons with previously published data. Despite a call from Boffito et al.42, guidelines on the bioanalytical validation of unbound drug measurements, such as
those established by the FDA or EMEA for total drug concentrations43,44, still remain to be established.
Recom-mendations should therefore focus on deficiencies which preclude standardised evaluation of unbound forms. This could be the first step in furthering PK-PD studies based on the pharmacologically active form of a drug.
conclusion
Our study defines pre-analytical and analytical conditions which facilitate a more uniform measurement of free DTG concentrations between UF and ED. Temperature, duration and RCF were identified as interfering factors, thereby highlighting the merits of simultaneously validating UF and ED protocols for the investigation of individual drugs.
Received: 28 September 2018; Accepted: 30 June 2020
References
1. U.S. Department of Health and Human Services. Guidelines for the Use of Antiretroviral Agents in Adults and Adolescents Living
with HIV. https ://aidsi nfo.nih.gov/conte ntfil es/lvgui delin es/adult andad olesc entgl .pdf. (2018).
2. European AIDS Clinical Society. EACS Guidelines. https ://www.eacso ciety .org/files /guide lines _9.0-engli sh.pdf. (2017). 3. Min, S. et al. Antiviral activity, safety, and pharmacokinetics/pharmacodynamics of dolutegravir as 10-day monotherapy in
HIV-1-infected adults. AIDS Lond. Engl. 25, 1737–1745 (2011).
4. Song, I. et al. 16th International workshop on clinical pharmacology of HIV and hepatitis therapy.
Pharmacokinetic-Pharmacody-namic Modeling & Simulation of the Virologic Response of Dolutegravir in HIV-Infected Patients with Integrase Inhibitor Resistant Virus, https ://www.natap .org/2015/Pharm /Pharm _11.htm (2015)
5. Katlama, C. et al. Dolutegravir as monotherapy in HIV-1-infected individuals with suppressed HIV viraemia. J. Antimicrob.
Chemother. 71, 2646–2650 (2016).
6. Song, I., Chen, S., Piscitelli, S. & Min, S. Pharmacokinetics (PK) and PK-pharmacodynamic (PD) relationship of dolutegravir (DTG)
in int grase inhibitor (INI)-Naïve subjects. https ://www.natap .org/2013/ICAAC /ICAAC _77.htm (2013).
7. Zhang, J. et al. Population pharmacokinetics of dolutegravir in HIV-infected treatment-naive patients. Br. J. Clin. Pharmacol. 80, 502–514 (2015).
8. Elliot, E. R. et al. Increased dolutegravir peak concentrations in people living with HIV aged 60 and over and analysis of sleep quality and cognition. Clin. Infect. Dis. https ://doi.org/10.1093/cid/ciy42 6 (2018).
9. Cottrell, M. L., Hadzic, T. & Kashuba, A. D. M. Clinical pharmacokinetic, pharmacodynamic and drug-interaction profile of the integrase inhibitor dolutegravir. Clin. Pharmacokinet. 52, 981–994 (2013).
10. Rowland, M., Tozer, T. & Rowland, M. Clinical Pharmacokinetics and Pharmacodynamics (Wolters Kluwer Health/Lippincott William & Wilkins, 2011).
11. Imaz, A. et al. HIV-1-RNA decay and dolutegravir concentrations in semen of patients starting a first antiretroviral regimen. J.
Infect. Dis. 214, 1512–1519 (2016).
12. Nilsson, L. B. The bioanalytical challenge of determining unbound concentration and protein binding for drugs. Bioanalysis. 5, 3033–3050 (2013).
13. Illamola, S. M., Hirt, D., Tréluyer, J. M., Urien, S. & Benaboud, S. Challenges regarding analysis of unbound fraction of highly bound protein antiretroviral drugs in several biological matrices: Lack of harmonisation and guidelines. Drug. Discov. Today. 20, 466–474 (2015).
14. Letendre, S. L. et al. ING116070: A study of the pharmacokinetics and antiviral activity of dolutegravir in cerebrospinal fluid in HIV-1-infected, antiretroviral therapy-naive subjects. Clin. Infect. Dis. Off. Publ. Infect. Dis. Soc. Am. 59, 1032–1037 (2014). 15. Pain, J. B. et al. Pharmacokinetics of dolutegravir in a premature neonate after HIV treatment intensification during pregnancy.
Antimicrob. Agents Chemother. 59, 3660–3662 (2015).
16. Metsu, D. et al. Determination of dolutegravir’s unbound fraction in human plasma using validated equilibrium dialysis and LC-MS/MS methods. Clin. Chim. Acta. 479, 56–65 (2018).
17. Ebrahimi-Najafabadi, H., Leardi, R. & Jalali-Heravi, M. Experimental design in analytical chemistry—part I: Theory. J AOAC Int. 97, 3–11 (2014).
18. Heining, M. P., Band, D. M. & Linton, R. A. The effect of temperature on plasma ionized calcium measured in whole blood in vitro.
Scand. J. Clin. Lab. Invest. 43, 709–714 (1983).
19. Song, I., Borland, J., Arya, N., Wynne, B. & Piscitelli, S. Pharmacokinetics of dolutegravir when administered with mineral sup-plements in healthy adult subjects. J. Clin. Pharmacol. 55, 490–496 (2015).
8 Scientific RepoRtS | (2020) 10:12265 | https://doi.org/10.1038/s41598-020-69102-y
www.nature.com/scientificreports/
21. Code de la santé publique - Article L1121-2. Code Santé Publique.
22. R Core Team. R: A Language and Environment for Statistical Computing. R Foundation for Statistical Computing. https ://www. gbif.org/tool/81287 /r-a-langu age-and-envir onmen t-for-stati stica l-compu ting (2015).
23. Kodama, H. et al. Effect of temperature on serum protein binding characteristics of phenytoin in monotherapy paediatric patients with epilepsy. J. Clin. Pharm. Ther. 26, 175–179 (2001).
24. Jung, D., Mayersohn, M. & Perrier, D. The, “ultra-free” ultrafiltration technique compared with equilibrium dialysis for determina-tion of unbound thiopental concentradetermina-tions in serum. Clin. Chem. 27, 166–168 (1981).
25. Kratzer, A., Kees, F. & Dorn, C. Unbound fraction of fluconazole and linezolid in human plasma as determined by ultrafiltration: Impact of membrane type. J. Chromatogr. B Anal. Technol. Biomed. Life Sci. 1039, 74–78 (2016).
26. Lunde, P. K., Rane, A., Yaffe, S. J., Lund, L. & Sjöqvist, F. Plasma protein binding of diphenylhydantoin in man; interaction with other drugs and the effect of temperature and plasma dilution. Clin. Pharmacol. Ther. 11, 846–855 (1970).
27. Du, P. et al. Development and validation of an ultrafiltration–UPLC–MS/MS method for rapid quantification of unbound docetaxel in human plasma. J. Chromatogr. B Anal. Technol. Biomed. Life Sci. 967, 28–35 (2014).
28. Li, X. et al. Determination of the free and total concentrations of vancomycin by two-dimensional liquid chromatography and its application in elderly patients. J. Chromatogr. B Anal. Technol. Biomed. Life Sci. 969, 181–189 (2014).
29. Kratzer, A., Liebchen, U., Schleibinger, M., Kees, M. G. & Kees, F. Determination of free vancomycin, ceftriaxone, cefazolin and ertapenem in plasma by ultrafiltration: Impact of experimental conditions. J. Chromatogr. B Anal. Technol. Biomed. Life. Sci. 961, 97–102 (2014).
30. Stove, V. et al. Measuring unbound versus total vancomycin concentrations in serum and plasma: Methodological issues and relevance. Ther. Drug Monit. 37, 180–187 (2015).
31. Kees, M. G., Wicha, S. G., Seefeld, A., Kees, F. & Kloft, C. Unbound fraction of vancomycin in intensive care unit patients. J. Clin.
Pharmacol. 54, 318–323 (2014).
32. Liebchen, U. et al. Unbound fraction of ertapenem in intensive care unit patients. J. Antimicrob. Chemother. 69, 3108–3111 (2014). 33. Dorn, C. et al. Impact of experimental variables on the protein binding of tigecycline in human plasma as determined by
ultrafil-tration. J. Pharm. Sci. 107, 739–744 (2018).
34. Cinar, Y., Senyol, A. M. & Duman, K. Blood viscosity and blood pressure: Role of temperature and hyperglycemia. Am. J. Hypertens. 14, 433–438 (2001).
35. Berezhkovskiy, L. M. On the temperature dependence of the unbound drug fraction in plasma: Ultrafiltration method may con-siderably underestimate the true value for highly bound drugs. Drug Discov. Ther. 2, 74–76 (2008).
36. Rifai, N. & Horvath, A. R. Tietz Textbook of Clinical Chemistry and Molecular Diagnostics (Elsevier, Amsterdam, 2017). 37. Matuszewski, B. K., Constanzer, M. L. & Chavez-Eng, C. M. Strategies for the assessment of matrix effect in quantitative
bioana-lytical methods based on HPLC-MS/MS. Anal. Chem. 75, 3019–3030 (2003).
38. Lee, K. J. et al. Modulation of nonspecific binding in ultrafiltration protein binding studies. Pharm. Res. 20, 1015–1021 (2003). 39. Di, L. et al. Industry perspective on contemporary protein-binding methodologies: Considerations for regulatory drug–drug
interaction and related guidelines on highly bound drugs. J. Pharm. Sci. 106, 3442–3452 (2017).
40. Zhang, F., Xue, J., Shao, J. & Jia, L. Compilation of 222 drugs’ plasma protein binding data and guidance for study designs. Drug
Discov. Today 17, 475–485 (2012).
41. Vuignier, K., Schappler, J., Veuthey, J. L., Carrupt, P. A. & Martel, S. Drug-protein binding: A critical review of analytical tools.
Anal. Bioanal. Chem. 398, 53–66 (2010).
42. Boffito, M. et al. Protein binding in antiretroviral therapies. AIDS Res. Hum. Retroviruses 19, 825–835 (2003).
43. FDA. Bioanalytical Method Validation Guidance for Industry. https ://www.fda.gov/downl oads/Drugs /Guida nce/ucm07 0107.pdf
(2018).
44. EMA. Guideline on bioanalytical method validation. https ://www.ema.europ a.eu/docs/en_GB/docum ent_libra ry/Scien tific _guide line/2011/08/WC500 10968 6.pdf (2018).
Author contributions
D.M., D.C. and P.G. devised and designed the study. D.M. and M.A. performed the experiments. G.M-B., T.L. and F.F. contributed technical support. D.M., F.F. and A.R. drafted the initial manuscript. T.L., V.G., E.C., P.D. and P.G. reviewed and revised the final manuscript. All of the authors approved the final manuscript submitted.
competing interests
The authors declare no competing interests.
Additional information
Supplementary information is available for this paper at https ://doi.org/10.1038/s4159 8-020-69102 -y.
Correspondence and requests for materials should be addressed to P.G. Reprints and permissions information is available at www.nature.com/reprints.
Publisher’s note Springer Nature remains neutral with regard to jurisdictional claims in published maps and
institutional affiliations.
Open Access This article is licensed under a Creative Commons Attribution 4.0 International
License, which permits use, sharing, adaptation, distribution and reproduction in any medium or format, as long as you give appropriate credit to the original author(s) and the source, provide a link to the Creative Commons license, and indicate if changes were made. The images or other third party material in this article are included in the article’s Creative Commons license, unless indicated otherwise in a credit line to the material. If material is not included in the article’s Creative Commons license and your intended use is not permitted by statutory regulation or exceeds the permitted use, you will need to obtain permission directly from the copyright holder. To view a copy of this license, visit http://creat iveco mmons .org/licen ses/by/4.0/.