Variations of stress directions in the western Alpine arc
E. Eva and S. Solarino*
Dipartimento di Scienze della T erra, University of Genova, V iale Benedetto V, 5 Genova, Italy. E-mail: [email protected]
Accepted 1998 June 5. Received 1998 May 6; in original form 1997 September 5
S U M M A R Y
The western Alpine arc originated during the Cretaceous orogenesis as a consequence of the continental collision between the European and Adriatic plates. The distribution of forces acting in this sector of the Alps is still somewhat uncertain. In the past, some efforts have been made to map the distribution of P and T axes but it is known that these can be substantially different from the principal stress directions.
In recent work, we presented a first attempt to determine the directions of s1 and s3, which we could compute only for a ‘local’ regime at the level of the magnitude of the larger events that occurred in the area. To obtain the stress orientation, we applied the technique developed by Gephart and Forsyth to invert fault plane solutions.
In this work we present the results of a detailed analysis performed on a larger area, applying the same methodology. A total of 86 earthquakes with magnitudes ranging from 2.5 to 5.3 has been used for inversion. The results confirm the impossibility of defining, within the available data, a regional stress field. In fact, different local behaviours have been demonstrated in four subregions. For the first subregion, namely the northern part of the western Alps, the inversion of 28 earthquakes, resulting in a misfit of 5.9°, revealed a distensive regime orientated N–S. For the second subregion, the outer part of the western Alps, the inversion of 16 earthquakes led to a misfit of 5.3° for a distensive E–W orientated regime. In the inner part of the chain, an opposite result was obtained by the inversion of 14 earthquakes, confirmed by a misfit of 4.7°. Finally, the region of the Ligurian Sea revealed an almost horizontal NW–SE orientated s1, whereas s3 is NE–SW orientated with a dip of around 30°–40°. The inversion for this subarea was carried out on a data set of 28 earthquakes and characterized by a misfit of 7.1°. The uncertainty of the stress axis orientation (90 per cent confidence limits) is, on average for all inversions, around 40°.
Key words: fault plane solutions (FPS), seismotectonics, stress distribution.
the western Alps, seismic activity, consistent and of low
magni-I N T R O D U C T magni-I O N
tude, is mainly concentrated around the border between France Since the early 1980s, the western Alpine arc has undergone a and Italy. In this area, seismicity seems to be organized into thorough seismic monitoring. The aim was to improve the two branches that clearly reflect the tectonic sketch, being understanding of this sector of the Alps, which originated almost coincident, within the location errors, with the Penninic during the Cretaceous orogenesis as a consequence of the front and the border of the Penninic unit and the Po plain. continental collision between the European and Adriatic plates. The external crystalline massifs appear as aseismic units and The development in the last decade of a large number of the seismic activity is concentrated along their margin. In the recording instruments and the increased accuracy of earth- Ligurian Sea, seismicity is mainly located at the western side quake locations have evidenced the main trend of seismicity at the foot of the continental margin, although a
seismic-for this area (Fig. 1) (Eva et al. 1990). swarm-like activity affects the inland region.
In the Swiss sector of the studied area, seismicity is mainly The recognition of these seismic behaviours is very important located in the Valais region, where very strong earthquakes for the definition of subareas of homogeneous characteristics, have occurred in the past (Mayer-Rosa & Mueller 1979). In as emphasized in the following.
Although the tectonic aspects of the formation and evolution of the orogen and the associated seismicity are now fairly well
* Now at: Institut fu¨r Geophysik, ETH Ho¨nggerberg, CH-8093 Zu¨rich,
47
Sub-Alpine front
Penninic front Sesia zone
45 46 44 10 9 8 7 6 Provencal Dauphine Helvetic units Penninic units External Crystalline Massifs
Jura belt Sub-Alpine
molasse Austroalpine
units
Ligurian
units Faults Thrust front
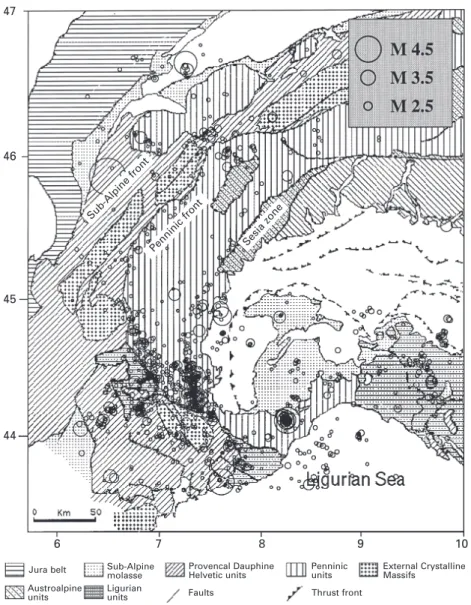
Figure 1. Seismicity from 1983 to 1996 in the western Alpine arc. Events have magnitude>2.5; Erh, Erz <5 km. The distribution of earthquakes
reflects well the tectonic structure of the area (Eva et al. 1997).
consequence, the distribution of the P and T axes of the focal the magnitudes of events do not exceed 5.3 (except for two events in the Ligurian Sea, estimated to be 6.0), we can only mechanisms are still somewhat confused. Previous studies
evidenced a great variability of the P and T axes: a progressive determine local regimes for the different subareas and subsets into which the western sector of the Alps and the Ligurian Sea rotation of the P axis roughly perpendicular to the chain was
proposed by Fre´chet (1978) and Me´nard (1988), while the can be divided.
This work represents a more detailed evaluation of the priority of transcurrent and transpressive solutions was the
main feature of the western Alps according to Pavoni (1986). various stress regimes acting in a wider area of the western Alps. Through the results we can confirm, as stated by Rebai The knowledge that the distribution of P and T axes can
differ greatly from that of the principal stress directions leads et al. (1992), that variations of stress directions are present in the western Alpine arc and that we have defined exactly us to realize that even if we were able to clear up any doubt
about the behaviour of the P and T axes, this could not be their orientations. Determination of the changes of the stress tensor over this area and their comparison with the available considered as providing a conclusive account of the distribution
of stresses affecting this sector of the Alps. information on local tectonics are the main goals of our
investigation. In recent work (Eva et al. 1997) we presented our first
attempt at computing the stress tensor orientation by the inversion of fault plane solutions for the southwestern Alpine
D ATA C O L L E C T I O N
sector. In that study we came to the conclusion that, as the
scale of geodynamic processes under investigation is controlled The development in the last two decades of several seismic networks [in France, Renass (Strasbourg), Sismalp (Grenoble) by the range of magnitudes of the events used (Rebai, Philip
& Taboada 1992), we could not compute a ‘regional’ stress and LDG (Paris); in Switzerland, ETH (Zu¨rich); and in Italy, IGG (Genoa) and ING (Rome)] over the whole area under behaviour but only a local regime. We add here that, because
study allowed us to compute high-quality focal mechanisms 1980–1997, except for a few cases of older suitable events. They were selected on the basis of the restrictive criteria of a down to a magnitude of 2.5 for the principal events.
The fault plane solutions were compiled into a database magnitude>2.5, a minimum of 20 polarities and a reasonable azimuthal coverage of stations (gap <70°). The DISTER made from directly computed focal solutions and focal
solu-tions taken from the literature. Both groups of solusolu-tions solutions selected for stress inversion show fault parameter uncertainties not greater than 15–20°.
include focal mechanisms computed using the first-motion technique. In particular, computed focal solutions were obtained by means of the code (Reasenberg &
M E T H O D A N D A N A LY S I S
Oppenheimer 1985), which searches for the double-couple fault
plane solution that best fits a given set of observed first-motion To compute the stress inversion from the focal solutions, we applied the method of Gephart & Forsyth (Gephart & Forsyth polarities for an earthquake.
The choice of including in our database focal solutions taken 1984; Gephart 1990a,b). This methodology is well known and a complete description is beyond the scope of this work. from the literature is useful to complete the data set, although
some problems may arise from this option. In fact, it is not Briefly, under the basic assumption that the deviatoric stress tensor is uniform over a given rock volume and time interval, directly possible to estimate a quality factor for these events,
and thus a selection among the available published mechanisms this method inverts the parameters of the focal mechanisms of earthquakes to compute the orientations of the main stress is necessary as a prerequisite for their usage. This selection
and weighting of solutions was performed by evaluating all axess1, s2 and s3, which are estimated together with the value of the R parameter [=(s2−s1)/(s3−s1)]. The program finds available information: the polarity distribution on the focal
sphere, estimates of quality parameters, and the network the solution corresponding to a minimum average misfit (F ), regarded as the discrepancy between the stress tensor and the configuration used for hypocentre and focal-mechanism
computations. observations (fault plane solutions). The misfit of a single focal
mechanism is defined as the minimum rotation about any Out of the 86 solutions used, with a local magnitude ranging
between 2.5 and 5.3, 44 were taken from the literature (grey- arbitrary axis that brings one of the nodal planes and its slip vector into an orientation that is consistent with the stress shaded) (Fre´chet & Pavoni 1979; Be´thoux et al. 1988;
Deverchere et al. 1991; Madeddu, Be´thoux & Stephan 1996; model.
The value of the minimum average misfit, together with the Maurer 1997; Menard 1988; Nicolas, Santoire & Delpech
1990). The uncertainties of the fault parameters for these events confidence limits of the solution, computed by a statistical procedure described by Parker & McNutt (1980) and Gephart were evaluated and found not to exceed, in general, about 20°.
The remaining 42 focal mechanisms were taken from those & Forsyth (1984), gives an a posteriori estimation of the quality of the results and provides a guide to decide whether the area computed at DISTER (Dipartimento di Scienze della Terra,
University of Genoa) for events occurring in the period considered is in a homogeneous stress field. In fact, the
confidence limits of the solution generally tend to become In a first attempt, we divided the studied area into three subsectors (Zone A: south Valais and northwestern Italy; Zone larger for increasing stress heterogeneity and can also be an
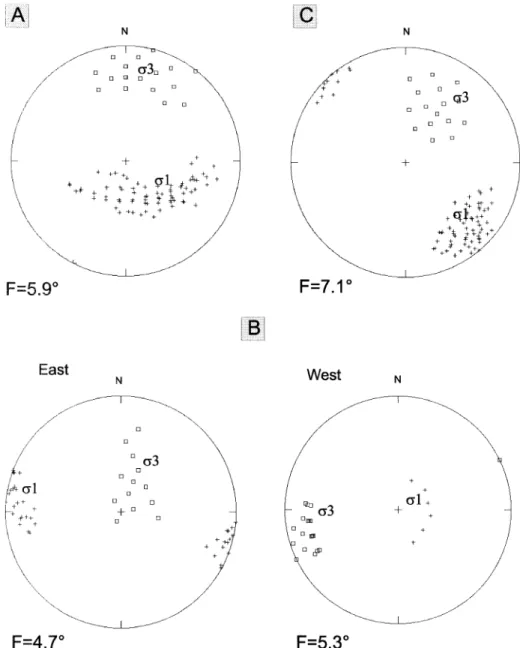
important a posteriori indicator of the suitability for stress B: southwestern Alps; Zone C: western Ligurian Sea) (Figs 2–4). In the following, we describe results obtained from the inversion of the FPS data set.
According to Wyss et al. (1992) and Lu, Wyss & Pulpan inversion of fault plane solutions for the various subdivisions. (1997), F-values not larger than 3°, 6° and 8° are related to
errors of 5°, 10° and 15°, respectively, in the focal-mechanism
R E S U LT S O F I N V E R S I O N
parameters. The errors in the focal-mechanism parameters in our FPS data set are estimated to be of the order of 15–20°,
Zone A
so F-values not exceeding 8° are assumed as a condition of a
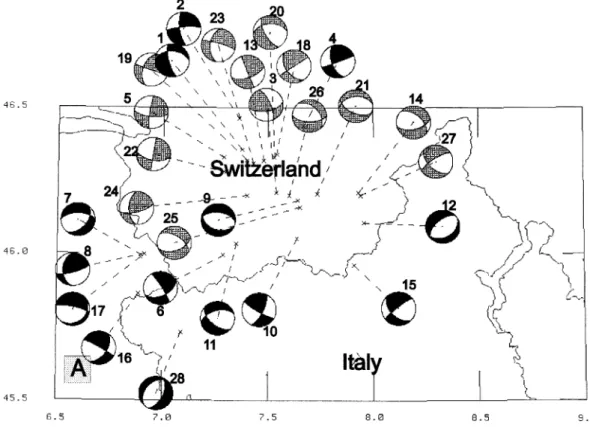
homogeneous stress tensor in the present study. For zone A (Fig. 2) we used 28 focal solutions, of which 14
were taken from the literature (Nicolas et al. 1990; Maurer As the scale of the geodynamic processes under investigation
is controlled by the magnitude range of the events used, it is 1997) and 14 were computed at DISTER (Table 1). The quality of the focal solutions is fair and we estimate the uncertainty very important to consider areas where the stress field is
homogeneous. Defining subsectors where the stress is hypothes- of the positions of the nodal planes as 15°–20°. The stress inversion gave meaningful results for the analysed area. The ized to be homogeneous is a sort of ‘trial and error’ technique
based on several a priori and a posteriori criteria. Although F-value (5.92°), taking into account the results of Wyss et al. (1992) and Lu et al. (1997), indicates that the stress can be there is no real rule, some important parameters can influence
the initial choice, but can be disclaimed or confirmed after an considered uniform and the 90 per cent and 50 per cent confidence limits of the solutions indicate very constrained inversion run. Among the a priori parameters there are the
structural pattern and the seismicity and focal-solution distri- solutions. Fig. 5 evidences an almost verticals1 and a nearly horizontal NNW–SSEs3. The R-value (0.3) indicates that in butions; the a posteriori parameters are linked to the results
of computation and depend on the value of F (averaged both volumes the amplitude of s2 lies in the middle of the range defined by the amplitudes ofs1 and s3.
minimum misfit) and of the confidence limits.
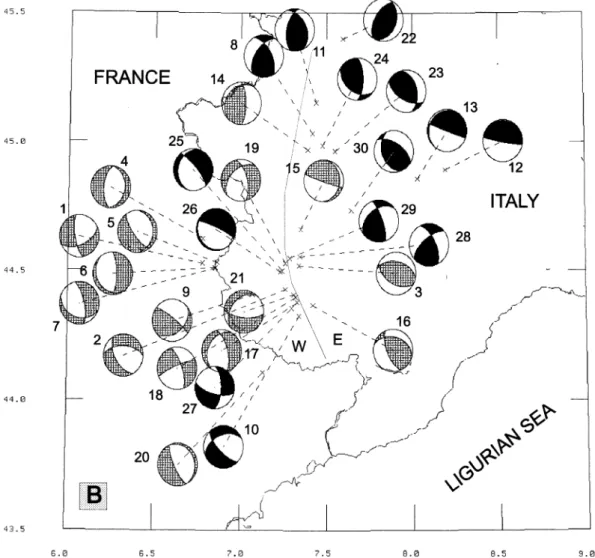
Figure 3. Focal solutions for zone B (30 events). After a first attempt, this sector was subdivided into two subzones, east ( E) and west (W) [see text or Eva et al. (1997) for details].
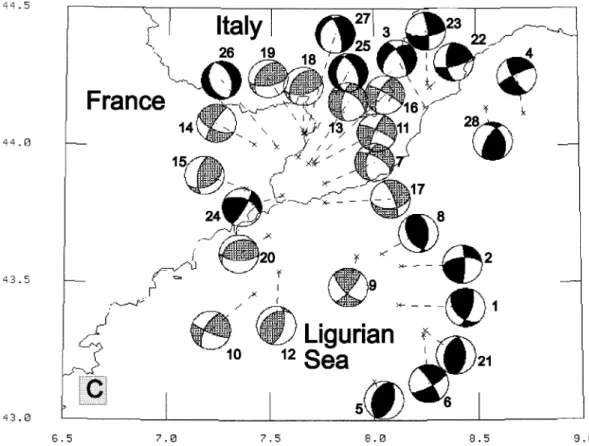
Figure 4. Focal solutions for zone C (28 events).
F-value of 7.1°, which represents a homogeneous stress in the
Zone B
area, and the 90 per cent and 50 per cent confidence limits (Fig. 5) show solutions that are not scattered, with the principal For zone B (Fig. 3), in the first attempt, the entire set of fault
plane solutions, composed of 16 focal mechanisms taken from axes ofs1 and s3 orientated NW–SE almost horizontally, and NE–SW with a dip of around 30°–40°, respectively.
the literature and 14 computed at DISTER (Table 2), was inverted for stress. The fairly large value of misfit (F=13.4°) showed that no uniform stress distribution could explain the
D I S C U SS I O N
whole set of data. The data set was therefore subdivided into
two parts, one consisting of the earthquakes of the external The stress inversion results, reported in summary in Fig. 6, appear to be in agreement with the geodynamic information (west) side of the southwestern Alpine chain, and the other
consisting of the earthquakes of the inner (east) side (Eva et al. available for the study area. The structural pattern of the northwestern Alps is supposed to be the product of the 1997). In these two sectors, the focal mechanisms indicate
different deformation styles. Reverse mechanisms prevail in the interaction between Adria and Europe (see for example Steck & Hunziker 1994). The anti-clockwise rotation of the Adriatic eastern part (labelled E in Fig. 3), in contrast to normal
faulting to the west ( labelled W in the same figure). The stress indenter relative to Europe produces a force system trending E–W in the Po plain and N–S in the northern part of the inversion gave meaningful results for both the western and the
eastern zone. Fig. 5 shows the orientations of the maximum western Alps. This force system causes crustal shortening, thrusting, an accretionary wedge of soft crust in the front of and minimum compressive stress (s1 and s3) for the two areas
and also displays the 90 per cent confidence limits of the the northwestern Alpine belt and strong uplift along the crest of the chain (Bernoulli, Heitzmann & Zingg 1990; Doglioni solutions. The F-values (7.5° and 5.4° for the western and
eastern zones, respectively) indicate that the stress can be 1992, 1993). In the areas A and B the uplift is high.
The earthquakes used for stress inversion were located in assumed to be uniform in the corresponding volumes. Fig. 5
shows a high-dips3 and a nearly horizontal E–W s1 in the the depth range 0–10 km for zone A. The fairly low misfit value obtained (F=5.92°) indicates stress homogeneity. The east, and reveals thats1 is almost vertical in the west, where
s3 is E–W orientated with a dip of approximately 0°–20°. 90 per cent confidence limit of the solution is fairly small and shows, in particular, a satisfactory level of constraint on the orientations of the principal axes of stress: a high-dip s1 is
Zone C
found. The R-values (0.3) indicate that the s2 amplitude is nearly equidistant from thes1 and s3 values.
The last sector (Fig. 4) is the area of the western Ligurian
region and the western Ligurian Sea. For this area we took The stress inversion results, together with the hypocentre distribution, give further support to local geodynamic models into account 28 focal mechanisms, of which half were taken
T able 1. Locations and focal-mechanism parameters for the 28 events in zone A. No. Date and time Lat. Long. Depth Mag. Plane A Plane B P Axis T Axis W Source of data Az Dip Az Dip Az Dip Az Dip 1 651024 1215 56.50 46N21.36 7E22.62 10.00 4.40 165 75 92 42 115 45 226 20 1 DISTER 2 67 324 1737 46N27.72 7E21.78 10.00 4.30 265 80 171 70 130 21 37 7 1 DISTER 3 680708 0545 34.90 46N12.60 7E32.40 5.00 4.00 79 58 156 70 30 8 294 38 1 Nicolas, Santoire & Delpech 1990 4 70 818 425 31.7 46N26.22 7E40.14 10.00 4.20 160 60 69 88 119 19 20 22 1 DISTER 5 810926 1354 46.10 46N19.80 7E17.40 5.00 4.40 189 83 96 67 321 11 55 21 1 Nicolas, Santoire & Delpech 1990 6 850104 1657 37.41 45N59.71 7E17.24 10.00 3.20 65 50 149 82 279 33 23 21 2 DISTER 7 850525 1039 57.08 45N59.94 6E54.78 4.00 3.00 75 75 182 42 136 20 25 45 2 DISTER 8 860117 7 5 30.60 45N59.27 6E53.71 3.00 3.40 50 20 102 77 211 55 359 31 2 DISTER 9 860119 654 36.17 46N10.98 7E38.40 6.00 3.00 110 40 97 51 143 82 13 5 2 DISTER 10 860215 143 6.55 46N 3.06 7E38.26 6.00 3.60 120 80 26 70 252 7 345 21 2 DISTER 11 860226 13 7 16.85 46N 2.01 7E20.99 8.00 2.90 130 55 254 51 99 58 193 2 2 DISTER 12 860609 1758 38.94 46N 6.38 7E57.47 10.00 2.60 60 35 228 56 113 78 323 10 2 DISTER 13 861009 1009 54.00 46N19.20 7E28.80 5.00 3.40 69 61 159 91 290 21 28 19 2 Maurer et al. 1997 14 870322 136 46.00 46N12.60 7E55.80 10.00 2.60 131 51 76 55 286 59 193 2 2 Maurer et al. 1997 15 870530 1945 18.90 45N57.68 7E54.52 9.00 2.70 135 50 231 82 101 33 357 21 2 DISTER 16 880611 2244 45.82 45N51.67 6E53.16 8.00 3.40 120 85 34 50 249 31 354 23 2 DISTER 17 880804 1035 58.77 45N59.69 6E53.87 3.00 2.40 40 45 270 57 234 62 337 7 2 DISTER 18 890107 229 41.00 46N20.40 7E32.40 8.00 3.80 145 50 236 89 108 28 3 26 2 Maurer et al. 1997 19 890930 441 2.00 46N19.20 7E24.00 8.00 3.80 200 50 109 89 162 26 57 28 2 Maurer et al. 1997 20 900428 2224 56.00 46N19.80 7E31.80 4.00 2.50 266 46 150 66 107 52 212 12 2 Maurer et al. 1997 21 900511 816 22.00 46N12.30 7E44.00 6.00 2.80 263 40 115 55 77 72 191 8 2 Maurer et al. 1997 22 900603 1927 26.00 46N16.80 7E18.00 2.00 2.40 100 60 189 91 321 21 59 20 2 Maurer et al. 1997 23 900726 1230 14.00 46N18.60 7E25.80 6.00 2.40 187 50 105 80 154 35 50 19 2 Maurer et al. 1997 24 900831 1057 6.00 46N12.00 7E24.00 9.00 2.50 181 53 75 70 132 11 32 42 2 Maurer et al. 1997 25 900925 519 1.00 46N09.60 7E39.00 8.00 2.80 70 50 124 55 273 60 8 3 2 Maurer et al. 1997 26 901217 2334 45.00 46N12.00 7E36.00 8.00 2.40 139 41 91 60 312 63 201 10 2 Maurer et al. 1997 27 910907 1809 21.00 46N12.00 7E56.40 11.00 2.70 135 55 237 74 101 37 2 12 2 Maurer et al. 1997 28 950421 1819 31.14 45N43.89 7E 5.20 3.00 2.90 25 55 222 36 261 77 122 9 1 DISTER
Figure 5. Summary of 90 per cent confidence limits computed for results of inversion runs.
deriving from the Adria–Europe interaction, and producing vertical direction (minimum) is smaller than in the N–S direc-tion (intermediate), in agreement with the E–W thrusting secondary tensional effects at very shallow depths. According
to Molnar & Lyon-Caen (1988), one of the forces that opposes assumed for the same volume by local geodynamic models (Bernoulli et al. 1990; Doglioni 1992, 1993).
the push of two plates is gravity. Potential energy is thus
stored in each column of rock, while the elevation of the chain The stress inversion results reported in Fig. 6 and Table 4 appear to be in agreement with the geodynamic uplift associ-increases to a mean value related to the force at which the
plates are pushed together. When the maximum elevation is ated with the regional-scale thrusting process, which has reactivated, as normal faults, pre-existing shallow structures reached, convergence continues but the crest of the chain can
locally undergo crustal extension. (Labaume et al. 1989). For the Ligurian Sea subzone, the
results of inversion show a rotation of the principal stress axes These effects are confirmed also by the results obtained for
zone B, where the R-values (0.5 and 0.6 for the western and with respect to the western Alps and correspond to an area with a NW–SE compressive trend. This compressive regime eastern parts, respectively) (Table 4) indicate that in both
volumes the s2 amplitude lies in the middle of the range can be associated with the closing direction of the Ligurian Sea (Re´hault & Be´thoux 1984).
defined by the s1 and s3 amplitudes. Thus, in the west the stress in the E–W direction (minimum compressive stress) is significantly smaller than in the N–S direction (an intermediate
C O N C L U S I O N S
stress), in agreement with the preferentially N–S trend of the
normal fault systems present in this specific volume (Labaume, Stress inversion from 86 earthquake fault plane solutions of the western Alps (depth<25 km) shows different orientations Ritz & Philip 1989). Similarly, in the east, the stress in the
T able 2. Locations and focal-mechanism parameters for the 30 events in zone B. No. Date and time Lat. Long. Depth Mag. Plane A Plane B P Axis T Axis W Source of data Az Dip Az Dip Az Dip Az Dip 1 590405 1048 0.00 44N31.80 6E46.80 0.00 5.3 170 72 66 54 34 39 295 11 2 Me ´nard 1988 2 710201 1226 6.20 44N25.80 7E15.60 2.00 4.3 150 55 92 53 120 56 211 1 2 Nicolas et al. 1990 3 770206 1601 2.70 44N31.20 7E20.40 10.00 4.0 120 48 102 43 202 2 97 81 2 Me ´nard 1988 4 770916 1827 0.00 44N37.45 6E47.09 3.10 2.5 6 29 186 61 96 74 276 16 1 F re´ chet & Pavoni 1979 5 770923 0241 0.00 44N31.96 6E51.96 2.00 2.5 0 22 145 72 36 61 245 26 1 F re´ chet & Pavoni 1979 6 780930 0913 0.00 44N30.75 6E51.24 5.90 2.5 0 74 145 19 285 60 81 28 1 F re´ chet & Pavoni 1979 7 780930 0941 0.00 44N30.65 6E51.46 7.70 2.5 167 70 111 33 293 57 57 20 1 F re´ chet & Pavoni 1979 8 800105 1431 29.90 45N 2.04 7E25.14 4.00 4.8 215 55 151 58 92 2 185 51 1 DISTER 9 801010 2142 52.10 44N24.60 7E04.20 5.00 4.2 128 80 51 39 9 25 254 42 2 Nicolas, Santoire & Delpech 1990 10 810104 0409 0.00 44N19.68 7E20.46 5.00 3.5 135 70 247 44 88 49 197 15 1 DISTER 11 810208 0430 10.50 45N 9.12 7E26.34 5.00 4.4 155 40 192 56 266 9 153 69 1 DISTER 12 820805 1654 0.00 44N53.52 8E11.46 5.00 3.7 100 85 100 5 190 40 10 50 2 DISTER 13 820806 1328 35.20 44N51.42 8E 1.68 10.00 4.4 30 45 260 57 224 62 327 7 2 DISTER 14 830906 2243 18.40 44N58.20 7E23.40 5.00 3.8 0 72 221 23 102 26 248 60 2 Nicolas, Santoire & Delpech 1990 15 840112 0824 46.40 44N39.60 7E21.00 10.00 3.6 5 20 108 85 215 37 358 46 1 Be ´thoux et al. 1988 16 850221 1800 34.50 44N22.20 7E25.20 14.00 3.2 157 65 105 37 227 15 108 60 1 Be ´thoux et al. 1988 17 860117 1848 03.90 44N22.80 7E19.80 10.00 3.3 210 33 165 65 219 63 92 17 2 Be ´thoux et al. 1988 18 860311 0746 37.80 44N24.00 7E19.20 5.00 3.6 247 79 161 69 203 23 295 7 2 Be ´thoux et al. 1988 19 860717 0735 34.10 44N31.80 7E15.60 1.00 3.2 225 45 166 63 207 55 102 10 2 Be ´thoux et al. 1988 20 860818 1137 11.90 44N06.60 7E07.80 6.00 3.2 155 75 155 15 65 60 245 30 2 Be ´thoux et al. 1988 21 870615 2127 18.10 44N24.60 7E18.60 10.00 3.3 222 35 96 67 44 58 166 18 2 Be ´thoux et al. 1988 22 870703 1046 57.03 45N23.94 7E35.73 3.00 3.7 20 35 212 56 297 10 147 78 2 DISTER 23 900211 0700 37.78 44N57.90 7E32.84 16.00 4.2 120 55 165 45 231 6 333 65 1 DISTER 24 900211 0707 47.81 44N59.23 7E28.54 24.00 2.7 0 65 126 38 69 15 313 59 1 DISTER 25 921027 0312 31.60 44N30.11 7E14.57 8.71 2.9 140 75 195 25 205 56 66 27 1 DISTER 26 921111 059 53.35 44N29.87 7E13.96 8.56 2.6 145 10 115 81 199 53 29 36 1 DISTER 27 930315 2343 29.63 44N21.55 7E17.86 13.94 4.3 105 65 1 63 324 38 233 1 1 DISTER 28 940120 0659 14.36 44N33.67 7E20.28 4.84 4.7 220 75 147 42 281 20 170 45 1 DISTER 29 940120 0705 42.99 44N32.84 7E16.82 14.09 4.3 160 75 237 51 104 15 207 39 1 DISTER 30 950304 0158 13.81 44N44.05 7E38.67 25.12 4.3 160 40 123 56 56 9 162 69 1 DISTER
T able 3. Locations and focal-mechanism parameters for the 28 events in zone C. No. Date and time Lat. Long. Depth Mag. Plane A Plane B P Axis T Axis W Source of data Az Dip Az Dip Az Dip Az Dip 1 630719 0544 00.00 43N25.20 8E 7.20 8.00 6.00 20 65 137 46 82 11 338 52 1 DISTER 2 630727 0557 00.00 43N33.60 8E 7.80 14.00 6.00 0 80 264 61 129 13 226 28 1 DISTER 3 701230 0220 00.00 44N08.28 8E15.18 5.00 4.00 224 52 330 70 193 42 93 11 1 DISTER 4 710925 1034 00.00 44N 7.02 8E43.80 5.00 4.20 150 75 243 80 107 18 16 4 1 DISTER 5 810105 0810 00.00 43N 8.46 8E00.00 10.00 3.60 20 50 200 40 110 5 290 85 1 DISTER 6 810422 0426 20.60 43N18.78 8E14.16 2.00 4.60 60 75 147 80 283 18 14 4 1 DISTER 7 831204 1734 51.90 43N51.60 7E45.60 1.00 3.50 190 54 120 65 160 46 63 6 1 Bethoux et al. 1988 8 851004 1317 21.53 43N36.24 8E 2.30 15.00 4.10 150 45 177 48 74 2 337 76 1 DISTER 9 851005 1558 40.60 43N37.20 8E02.40 16.00 3.10 40 77 135 70 88 5 356 24 1 Be ´thoux et al. 1988 10 860501 0028 02.10 43N27.60 7E25.20 10.00 3.90 208 64 112 78 162 10 67 27 1 Be ´thoux et al. 1988 11 861020 2029 11.30 43N55.80 7E42.60 2.00 3.00 203 79 115 79 159 16 69 0 1 Be ´thoux et al. 1988 12 891226 1959 59.10 43N32.40 7E32.40 10.00 4.50 15 60 231 36 119 13 244 68 1 Be ´thoux et al. 1988 13 900702 1842 00.00 43N56.00 7E41.00 2.00 2.70 190 63 122 53 152 48 248 6 1 Deverchere et al. 1991 14 900809 1916 57.61 44N00.00 7E25.20 6.00 3.2 116 60 212 80 78 29 341 13 1 Madeddu, Be ´thoux & Stephan 1997 15 900908 0831 22.91 43N50.40 7E22.80 11.00 2.7 60 40 190 62 301 12 53 61 1 Madeddu, Be ´thoux & Stephan 1997 16 901002 0206 24.12 43N56.40 7E42.60 11.00 2.9 300 80 205 64 165 26 70 11 1 Madeddu, Be ´thoux & Stephan 1997 17 910205 0906 10.39 43N47.40 7E45.60 8.00 3.0 339 75 83 48 296 40 37 17 1 Madeddu, Be ´thoux & Stephan 1997 18 910219 1533 00.00 44N02.60 7E39.50 7.00 2.9 215 40 77 58 149 10 36 66 1 Madeddu, Be ´thoux & Stephan 1997 19 910225 1130 11.80 44N02.90 7E39.60 4.00 3.3 215 40 80 59 151 10 38 64 1 Madeddu, Be ´thoux & Stephan 1997 20 910628 2348 48.00 43N40.20 7E29.40 5.00 2.9 92 62 237 33 169 15 38 68 1 Madeddu, Be ´thoux & Stephan 1997 21 920921 1237 04.03 43N19.67 8E14.67 19.70 3.00 0 50 195 41 97 5 217 81 2 DISTER 22 930717 1035 00.60 44N13.29 8E15.15 7.80 4.50 165 65 71 81 120 11 25 24 2 DISTER 23 930717 1108 23.17 44N13.64 8E15.74 8.90 3.70 85 70 172 81 307 21 40 7 1 DISTER 24 950421 0802 57.48 43N48.93 7E33.38 4.00 4.30 30 80 112 51 155 19 259 35 2 DISTER 25 960926 2137 36.70 43N57.37 7E37.84 7.20 2.70 187 40 335 55 194 72 79 8 1 DISTER 26 961017 1521 38.80 43N59.72 7E31.72 10.50 3.20 160 40 34 50 250 85 70 5 1 DISTER 27 961124 0027 08.10 44N02.67 7E40.07 2.60 3.50 184 20 344 71 226 59 89 23 1 DISTER 28 961125 1947 23.20 44N08.34 8E32.79 3.00 3.80 335 40 212 66 278 14 165 58 1 DISTER
Figure 6. Distribution of stress orientations in western Alpine arc for subzones A, B and C as derived from the present work. All earthquakes 1983–1996 are shown.
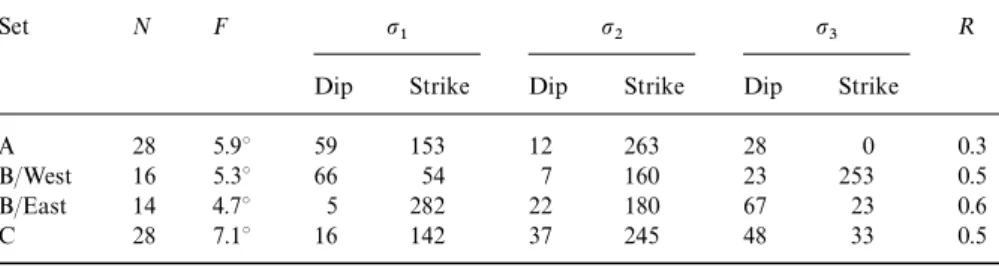
Table 4. Summary of results of inversion runs. For the meaning of B/East and B/West, see text. N is the number of focal solutions used for inversion, F is the misfit and R=(s2−s1)/(s3−s1).
Set N F s1 s2 s3 R
Dip Strike Dip Strike Dip Strike
A 28 5.9° 59 153 12 263 28 0 0.3
B/West 16 5.3° 66 54 7 160 23 253 0.5
B/East 14 4.7° 5 282 22 180 67 23 0.6
C 28 7.1° 16 142 37 245 48 33 0.5
of the principal stress axes (s1 and s3) for the various subzones during the orogenesis (Molnar & Lyon-Caen 1988) is respon-sible for a local distensive stress regime accompanied by into which we divided the area. These orientations are
charac-terized by slight to significant deviations from the expected shallow earthquakes. In the northern part (zone A), the stress orientation is rotated by almost 90° with respect to the compressional force due to the collision between the Adriatic
and European plates. Several local stress fields are super- southern sector as a consequence of the bending of the Alpine chain.
imposed on, or partly derived from, this more regional
compressive force. For the southern zone (zone B), the availability of a greater
number of events allowed us to perform two inversions, one In both the northern and the southern sectors of the western
Gephart, J.W., 1990a. Stress and the direction of the slip on fault
regime, and one performed with deeper events, showing a
plane, T ectonics, 9, 845–858.
compressive E–W-orientated stress field.
Gephart, J.W., 1990b. FMSI: a Fortran program for inverting fault/
In the case of the Ligurian Sea, the stress regime can be
slickenside and earthquake focal mechanism data to obtain the
considered as the consequence of the collision between the
regional stress tensor, Comp. Geosci., 16, 953–989.
African and European plates along a N–S direction, and has
Gephart, J.W. & Forsyth, W.D., 1984. An improved method for
the same properties of that of western Europe (Mueller et al. determining the regional stress tensor using earthquake focal mech-1992). In this sense, the general behaviour of the Ligurian Sea anism data: applications to the San Fernando earthquake sequence, should be considered independently from the Alpine chain. J. geophys. Res., 89, 9305–9320.
Compression in the Ligurian Sea could also be responsible for Labaume, P., Ritz, J.F. & Philip, H., 1989. Failles normales recentes dans les Alpes sud-occidentales: leurs relations avec la tectonique
the triggering of the reactivation of the complex system of
compressive, C. R. Acad. Sci. Paris, 308, Serie II, 1553–1560.
faults in the Nice arc and for the seismicity of the northern
Lu, Z., Wyss, M. & Pulpan, H., 1997. Details of stress directions in
margin of the Ligurian Sea.
the Alaska Subduction Zone from fault plane solutions, J. geophys. Res., 102, 5385–5402.
Madeddu, B., Be´thoux, N. & Ste´phan, J.F., 1996. Champ de contrainte A C K N O W L E D G M E N T S
post-pliocene et de´formations re´centes dans les Alpes sud-occidentales, Bull. Soc. ge´ol. France, 167, 797–810.
We are indebted to Herve´ Philip and two anonymous reviewers,
Maurer, H., Burkhard, M., Deichmann, N. & Green, A.G., 1997. Active
who improved the manuscript with their valuable suggestions.
tectonism in the Western Swiss Alps, T erra Nova, 9, 91–94. Mayer-Rosa, D. & Mueller, S., 1979. Studies of seismicity and selected
focal mechanisms in Switzerland, Schweiz. min. petrogr. Mit., 59, R E F E R E N C E S
127–132.
Menard, G., 1988. Structure et cine´matique d’une chaine de collision— Bernoulli, D., Heitzmann, P. & Zingg, A., 1990. Central and southern
Alps in southern Switzerland. Tectonic evolution and first results of Les Alpes occidentales et centrales, T hesis, Universite´ J. Fourier, Grenoble.
reflection seismics, in Deep Structure of the Alps, pp. 289–302, ed.
Roure F., Heitzmann P. & Polino R., Me´m. Soc. ge´ol. Fr., Paris, Molnar, P. & Lyon-Caen, H., 1988. Some simple physical aspects of the support, structure, and evolution of mountain belts, Geol. Soc. 156; Me´m. Soc. ge´ol. Suisse, Zu¨rich, 1; Vol. spec. Soc. Geol. It.,
Roma, 1. Am. Spec. Pap., 218, 179–207.
Mueller, B., Zoback, M.L., Fuchs, K., Mastin, L., Gregersen, S., Pavoni, Be´thoux, N., Cattaneo, M., Delpech, P.Y., Eva, C. & Rehault, J.P.,
1988. Me´canismes au foyers des se´ismes en mer ligure et dans le N., Stephansson, O. & Ljunggren, C., 1992. Regional patterns of tectonic stress in Europe, J. geophys. Res., 97, 11 783–11 803. Sud des Alpes occidentales: re´sultats et interpre´tation, C. R. Acad.
Sci. Paris, 307, 71–78. Nicolas, M., Santoire, J.P. & Delpech, P.Y., 1990. Intraplate seismicity: new seismotectonic data in Western Europe, T ectonophysics, 179, Deverchere, J., Be´thoux, N., Hello, Y., Loaut, R. & Eva, C., 1991.
De´ploiement d’un re´seau de sismographes sous-marins et terrestres 27–53.
Parker, R.L. & McNutt, M.K., 1980. Statistics for the one norm misfit en domaine Ligure (Me´diterrane´e): campagne SISBALIG I, C. R.
Acad. Sci. Paris, 313, Serie II, 1023–1030. measure, J. geophys. Res., 85, 4429–4430.
Pavoni, N., 1986. Regularities in the pattern of major fault zones of Doglioni, C., 1992. Main differences between thrust belts, T erra Nova,
4, 152–164. the earth and the origin of arcs, in T he origin of arcs, pp. 63–68, ed.
Wezel, F.C., Elsevier, Amsterdam. Doglioni, C., 1993. Some remarks on the origin of foredeeps.
T ectonophysics, 228, 1–20. Reasenberg, P. & Oppenheimer, D.H., 1985. FPFIT, Fortran computer program for calculating and displaying earthquake fault-plane solu-Eva, C., Augliera, P., Cattaneo, M. & Giglia, G., 1990. Some
consider-ations on seismotectonics of northwestern Italy, in T he European tions, USGS Open File Rept, 85–739.
Rebai, S., Philip, H. & Taboada, A., 1992. Modern tectonic stress field Geotraverse: Integrative Studies, pp. 289–296, eds R. Freeman, P.
Giese and S. Mueller, European Science Foundation, Strasbourg. in the Mediterranean region: evidence for variation in stress direc-tions at different scales, Geophys. J. Int., 110, 106–140.
Eva, E., Solarino, S., Eva, C. & Neri, G., 1997. Stress tensor orientation
derived from fault plane solutions in the southwestern Alps, Rehault, J.P. & Be´thoux, N., 1984. Earthquake relocation in the Ligurian sea (Western Mediterranean): geological interpretation, J. geophys. Res., 102, 8171–8185.
Fre´chet, J., 1978. Sismicite´ du sud-est de la France, et une nouvelle Mar. Geol., 55, 429–445.
Steck, A. & Hunziker, J., 1994. The Tertiary structural and thermal me´thode de zonage sismique, PhD T hesis, University of Science,
Technology and Medicine, Grenoble. evolution of the Central Alps—compressional and extensional struc-tures in an orogenic belt, T ectonophysics, 238, 229–254.
Fre´chet, J. & Pavoni, N., 1979. Etude de la sismicite´ de la Zone
brianc¸onnaise entre Pelvoux et Argentera (Alpes Occidentales) a` Wyss, M., Liang, B., Tanigawa, W.R. & Wu, X., 1992. Comparison of orientations of stress and strain tensors based on fault plane l’aide d’un re´seau de stations portables, Eclogae geol. Helv., 72/3,