Sintering characteristics of nanocrystalline TiO2—A study
combining small angle neutron scattering and nitrogen
absorption-BET
W. Wagner
Paul Scherrer Institute, CH-5232 Villigen, PSI, Switzerland
R. S. Averback and H. Hahna>
Department of Materials Science and Engineering and Materials Research Laboratory, University of Illinois at Urbana-Champaign, 1304 West Green Street, Urbana, Illinois 61801
W. Petry
Institute Laue Langevin, 156X, F-38042, Grenoble, France A. Wiedenmann
Hahn Meitner Institute, Glienicker Str. 100, D-l000, Berlin 39, Germany
(Received 11 February 1991; accepted 4 June 1991)
Small angle neutron scattering (SANS) was employed to characterize the pore structure of nanophase TiO2 ceramic materials compacted at different temperatures. Nanophase
samples, produced by inert gas condensation, were compacted at 25, 290, 413, and 550 °C using a pressure of « 1 GPa. The pore size distribution of the sample compacted at room temperature was very broad, with sizes ranging from s«3-30 nm and pores comprising 38% of the sample volume. Compaction at 290 and 413 °C reduced the pore volume to 25% and 20%, respectively, by eliminating pores at both the small and large ends of the distribution. Compaction at 550 °C resulted in a pore volume that was less than 8%. Complications in the SANS analysis arising from the scattering from grain boundaries are discussed. The results from SANS are compared with those derived from nitrogen absorption, BET, measurements.
I. INTRODUCTION
The structures of nanophase materials are unique since grain boundaries comprise a significant fraction of the total volume of the material. It is not surprising, therefore, that the properties of nanophase materials are often very different from those of their counterpart polycrystalline materials having larger grain sizes. In nanophase ceramics, sinterability and mechanical properties are of particular interest since it has been reported that densification, diffusional creep, and superplastic behavior are possible at low temperatures.1^
Small grain sizes, however, are not the only important microstructural features in nanophase ceramics that have a strong influence on mechanical properties; flaws, such as residual porosity, also affect these properties.5 We
have previously studied the microstructure of nanophase ( « - ) TiC>2 during sintering using a variety of techniques: gravimetry (using Archimede's principle), BET nitrogen absorption, scanning electron microscopy, and x-ray diffraction.6 Although this investigation provided an
overview of the microstructural development in n—TiO2
during sintering, a detailed understanding of the pore structure and its evolution in nanophase ceramics is
a'Now at Rutgers, The State University of New Jersey, Piscataway, New Jersey 08855.
still lacking. This work was initiated to evaluate the efficacy of small angle neutron scattering (SANS) for this purpose as well as to characterize better the structure of these materials. In polycrystalline samples with larger grain sizes, SANS has proved to be a powerful technique for quantitatively determining the distribution of void or precipitate sizes and for following the kinetics of their evolution.7 Nanocrystalline materials,
however, pose special problems for SANS since the length scale of the microstructural fluctuations that give rise to scattering from pores is approximately the same as that from the grain boundaries, preventing unambiguous determination of either distribution. In this study, BET, x-ray diffraction, and gravimetry were used to complement the SANS measurements to test how well the pore size distribution could be specified.
II. EXPERIMENTAL PROCEDURES
The samples employed for these experiments were produced using a three-step process; this has been de-scribed elsewhere.4'6-8 Since the microstructures of our
samples are very sensitive to the way that they are prepared, we outline here the more cogent aspects of this process. First, Ti particles are produced by vaporizing Ti metal from a resistive W boat into an ambient helium atmosphere at a pressure of 2 mbar. This method, i.e.,
W. Wagner ef al.: Sintering characteristics of nanocrystalline TiO2
inert gas condensation, yields Ti particles that have a diameter of ralO nm. The particles are carried in the He convection current to a cold shroud, where they loosely adhere. The He gas is then removed from the chamber and replaced with O2 gas. The Ti particles
undergo rapid oxidation and usually glow red, indicating that they momentarily reach temperatures over «800 °C. The powder is nearly fully oxidized during this "burn-ing" with the average composition becoming TiOi.8.6
Since the powder is sparsely distributed over the cold shroud, agglomeration is limited. The oxidized powders are subsequently removed from the cold shroud and collected, in vacua, in a powder press where they are lightly compacted and further oxidized at 350 °C in a partial pressure of O2 of «300 mbar. In the final step
of the process, the samples are highly compacted using the same oxygen ambient but under an applied pressure of «1.0 GPa at the specified temperature. It was shown previously1'6 that the density of the unsintered compacted
powder depends strongly on the compaction temperature in the temperature range 25-550 °C, but that the grain size does not. Accordingly, specimens were produced at different compaction temperatures to provide samples of similar grain size but different volume fractions of porosity. Table I lists the preparation conditions and the physical characteristics of the samples.
The samples were characterized using gravimetry, BET, x-ray diffraction, and SANS. The x-ray diffraction patterns indicated that all of the samples had the rutile structure, which is the equilibrium phase of TiO2. The
relative densities of the samples are listed in Table I; they derive from BET or gravimetry measurements, de-pending on whether they had open or closed porosity (samples A and B were assumed to have open porosity; sample D was known, from BET, to have closed poros-ity; and sample C was assumed to have a mixture of open and closed porosity, and therefore its density was obtained from an average of the two methods. These values will be compared with the SANS results and evaluated below.
III. BET RESULTS
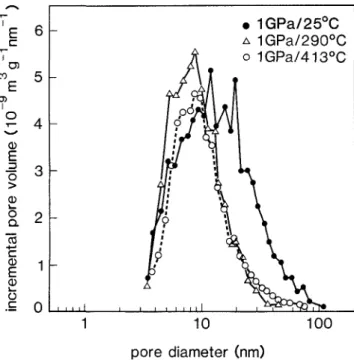
The BET results for the pore size distributions are shown in Fig. 1, where the incremental pore volume
E i — 3 0 n Q. tL To -4-<
1
1
b •E 0 • 1GPa/25°C A 1GPa/290°C o 1GPa/413°C 1 10 100 pore diameter (nm)FIG. 1. Pore size distribution in nanocrystalline T1O2 after com-paction at different temperatures as determined by BET.
is plotted as a function of pore diameter. The sample compacted at 550 °C is not shown as no open porosity was detectable. The pore-size distribution of the sample compacted at 25 °C shows features similar to those reported earlier,6 a rather broad distribution of sizes
with the full width at half maximum extending from « 4 to 30 nm. The distribution changes significantly when the compaction is performed at 290 °C rather than at room temperature. The fractional pore volume is reduced from 0.38 to 0.25, and a substantial reduction in the number of large pores is observed. When the compaction temperature is raised further, to 413 °C, the additional changes are rather small; the pore volume is reduced an additional « 5 % , with this reduction occurring at the expense of the smaller pores.
IV. SMALL ANGLE NEUTRON SCATTERING
The SANS measurements were carried out at the Dll-instrument of the Institute Laue Langevin, Greno-ble, France.9 The neutron wavelength, A, was 0.70 nm
and the specimen-to-detector distance was 1.2, 7.0,
TABLE I. Physical characteristics of the nanocrystalline TiO2 samples.
Specimen A B C D Temp. RT 290 °C 413 °C 550 °C Preparation Pressure 1.05 GPa 1.05 GPa 1.05 GPa 1.05 GPa Time 1.25 h 18 h 5.5 h 7 h Macroscopic density, p/po 0.62 0.75 0.80 0.92 Grain (nm) 14.8 11.5 10.6 12.5 Thickness (mm) 0.561 0.268 0.218 0.240 BET density 62% 75% 76% Dense
W. Wagner et al.: Sintering characteristics of nanocrystalline TiO2
and 35 m, covering a range in momentum transfer, Q,
of 1.3 x 1 0 "2 < Q/nm'1 < 2.5. Q = (4TT/A) sin 0/2,
where 0 is the scattering angle. All measurements were performed at room temperature, with the specimen in air, mounted behind a circular Cd aperture of 3 mm diameter.
The intensity data were corrected for background scattering, transmission factors, and specimen geometry. Variations in the acceptance of different elements of the area sensitive detector were corrected by normalizing to a water spectrum. The two-dimensional data did not show radial anisotropy around the central beam, and therefore it was averaged for equal radial positions of the detector. Absolute values of the differential scattering cross section, da(Q)/dVL, in units of barn/sr per TiO2
-molecule were determined by referring to the averaged incoherent scattering of a water specimen.
The SANS scattering intensities for the specimen compacted at room temperature and for those compacted at higher temperatures are plotted in Fig. 2 as a function of scattering vector, Q. Double logarithmic scales are employed since the data extend over several decades. Compared to the specimen compacted at 25 °C, the scattering from samples compacted at elevated temper-atures, which have many fewer pores, is significantly reduced, showing that a large contribution of the SANS scattering does, indeed, derive from pores. The SANS data for the sample compacted at 413 °C are found almost coincident with the data for the sample compacted at 290 °C. It seems that this difference in compac-tion temperature did not yield an appreciable difference in the pore microstructure. This is consistent with the BET data.
After sintering at 1 GPa and 550 °C, the measured SANS intensity is lowest. The BET measurements indi-cate that no open porosity remained after this treatment. In addition, the macroscopic density of 92%, relative to bulk rutile, suggests that most of the porosity has been removed from this specimen. However, what fraction of the 8% excess volume is due to residual closed porosity, and what fraction to grain boundaries, cannot be determined from our measurements. Nevertheless, as a working hypothesis, the SANS scattering from this specimen was assumed to originate totally from structural inhomogeneities of the nanoscale material, i.e., grains, grain boundaries, and surface roughness; accord-ingly, the scattering from this sample was taken as a reference for subtracting the scattering contribution from those same sources in the other specimens. Although the assumption that the reference sample is free of porosity cannot be fully justified from the measurements, it should be noted that the SANS intensity derived from this sample, and used for subtraction, comprises only a small fraction of the intensity attributed to pores in the other samples.
SANS data evaluation
A quantitative evaluation of the SANS data was carried out using the standard procedure of calculating
dcr(Q)/d£l, on the basis of a modeled microstructure.
Our model included contributions from the following scattering structures:
(i) Large heterogeneities (d > 500 nm), e.g., sur-face roughness or internal macroscopic structures. These are characterized by a Q~4-dependent scattering at small Q, as described by Porod's law
da
o(Q)/dn =
1 - 4 (1)where P is the Porod constant. For all of the nanocrys-talline specimens in this study, Porod's constant was P = (0.9 ± 0.2) x 10~2 barn nm"4. The Porod constant
is not of direct interest here, nor does it influence the results; nevertheless, it is included in the SANS model for completeness.
(ii) Grains of bulk rutile TiO2-material, surrounded
by interfacial regions (grain boundaries) of reduced density. This contribution is denoted as dcri(Q)/d£l.
(iii) Pores and cavities. This contribution is denoted
as da
2(Q)/dn.
Interference effects are neglected in this model (the scattering curves do not show any indication that they are significant), so that the three contributions to the scattering intensity can be treated independently, i.e.,
For dan(Q) / dQ,(n — 1, 2), an ansatz for poly disperse arrays of scattering particles was used
d(Tn(Q)
dn
(1 - qfjAbf
n
F
2(Q, R)V{R) N
n(R) dR
(3) Q is the volume occupied by a TiCVmolecule in bulkrutile (Q = 0.0311 nm3), and (Ab)2 is the average neu-tron scattering contrast of bulk rutile against vacuum
[(Ab)2 — 0.668 barn/sr]. The factor (1-q)2 accounts for a finite intermediate density in the interfacial regions; q is the ratio of interfacial to bulk rutile densities. For pores or cavities, q = 0.
Generalized for voids and grains, the single parti-cle scattering function F(Q,R) is approximated by the structure function for spheres of radius R,
F(x) H—^-(sin x — x cos x) (4)
with x — QR. Deviations from a spherical shape become convoluted with the size distribution and therefore would not significantly disturb the model assumptions. V(R)
W. Wagner et al.: Sintering characteristics of nanocrystalline TiO2 0) - 2 -1 0 log (Q/nm~1) -1 0 log (Q/nm~1)
FIG. 2. SANS intensity data of nanocrystalline TiO2, in units of barn/sr per TiC>2 molecule, after compaction at room temperature and elevated temperatures, as indicated. The solid curves are modeled structure functions fitted to the data. Contributions following Eq. (1) (dash-dotted lines) and Eq. (3) (dashed curves) are separately extrapolated.
is the particle volume, and N(R)dR is the incremental volume fraction of particles in the size interval between
R and R + dR.
N(R) describes the size distribution of the
scat-tering particles, yielding the average size and average volume. In addition, integration over N(R) yields the total volume fraction of the scattering particles, i.e.,
2R0, 4R0, and 8R0, with all having the same width, a, but different amplitudes A^\
* { l o gJR / ( i ?0x 2f c-1) }2
^—' 2o2
fe=l
= J
^ ( i ? ) rfi? (5)The model structure function, Eq. (2), was fit to the data by means of an interactive trial and error procedure, varying the parameter P, and the distribution functions
N(R). Attempts to parametrize the N(R) functions
re-vealed that the underlying size distributions of scattering particles were extremely broad. A suitable fit of the data could be obtained using a linear combination of four log-normal functions for N(R), centered at positions Ro,
The best fits for dcr(Q)/d£l derived from our scat-tering model are plotted in Fig. 2 as solid curves. The SANS data are shown for comparison. It should be noticed that the model curves describe the measured scattering curves rather well over more than two decades in Q, and over more than four decades in the scat-tering intensity, da(Q)/dfl. The deviations at large
Q occur from neglecting the incoherent scattering of
TiO2, (rfcr/rifi)inc = 0.235 barn/sr, and possibly also
from incoherent scattering of resorbed hydrogen in the specimens, (da/dQ)inc — 12.7 barn/sr per H2-molecule.
H2-resorption to an amount of 1-3 at. % has recently
W. Wagner et al.: Sintering characteristics of nanocrystalline TiO2
of states measurements.10 Small-scale structure (diameter
< 0.6 nm), which is not considered in the model, is another possible source of the deviations.
The distribution function resulting from the fitting procedure for the specimen compacted at 550 °C is plot-ted in Fig. 3. As noplot-ted above, it was assumed that this specimen does not contain significant residual porosity. The curve in Fig. 3, therefore, yields (1 - q^N^R). The function exhibits a broad distribution in size, ranging from %3 to ?s40 nm. If we assume that the scale of this density fluctuation represents the size of the particles, then a particle diameter of 24.4 nm is deduced. This value is almost twice as large as the average grain diameter determined from the x-ray measurement using the Scherrer equation. We tentatively attribute this difference to the formation of low energy boundaries with high densities. These could form during the initial rapid oxidation treatment, prior to compaction, when the neighboring grains are not constrained from rotating. It would be interesting to learn if the average grain bound-ary density of nanophase ceramics was indeed a function of the method of synthesis. The rather uncontrolled method of "burning" employed here, unfortunately, is not conducive to such systematic studies.
As a matter of principle, the fraction of interfacial density q, cf. Eq. (3), cannot be separated from the amplitude of the distribution function on the basis of the SANS measurements. However, a relation between volume fraction and interfacial density can be obtained: Integration over the distribution function of Fig. 3 yields,
with consideration of Eq. (5):
(i - q)2fP = 6.6 x io- 2 (7)
A second relation between q and fp can be derived using the macroscopic density of 0.92^0) where p0 is the rutile density (cf. Table I):
fpPo + (1 - fP)qp0 = 0.92po (8)
In the way Eq. (8) is written, fp denotes the volume fraction of the bulk rutile grains and (1 - fp) the fraction of interfacial regions. Combining Eqs. (7) and (8) yields
q = 0.70 and (1 - fp) = 0.27 (9) which signifies an interfacial density of 70% of the bulk rutile density, covering 27% of the specimen volume. Although these values are reasonable and provide confi-dence in the assumptions of the model, they can be taken only as crude estimates in view of the uncertainties in the interpretation of N(R) andfp in a highly dense system where "particles" and "matrix" cannot unambiguously be identified as such.
For the evaluation of the pore contribution to the scattering, it is assumed that the same type of structure as described by (1 — q2)Ni(R) for the specimen treated at 550 °C is present in all specimens investigated, regard-less of their foregoing treatment. The evaluation of the differences then results in the pore volume distributions shown in Fig. 4. The ordinate scale was converted to units of m3/(g-nm) in order to facilitate direct
compari-son with the BET results shown in Fig. 1.
E c CO I 6 - nano TlOv 5 -m DC Q UJ N 1 CO 0 iGPa/550°C 100 grain diameter (nm)
FIG. 3. Size distribution of scattering objects (grains and grain bound-aries) in the specimen after compaction at 550 °C, derived from the related SANS results shown in Fig. 2.
E c CD J3 O > CD O o. "re -t—i a> CD o c 6 5 4 3 2 -1 0 \ \ 1GPa/25°C 1GPa/290°C 1GPa/413°C \ \ 10 pore diameter (nm) 100
FIG. 4. Pore size distribution in nanocrystalline T1O2 after com-paction at room temperature and at elevated temperatures, as indicated, derived from the related SANS results shown in Fig. 2.
W. Wagner ef al.: Sintering characteristics of nanocrystalline TiO2
In general, the results of the two techniques are in good quantitative agreement in regards to both the size distribution and the absolute magnitude of N(R). This agreement suggests that both methods, in principle, are suitable for a quantitative analysis of pore size, volume distribution, and volume fraction.
On a finer scale, clear differences are observed between the BET and SANS results. For the specimen compacted at room temperature, a significant volume fraction of pores with diameters between 2 and 8 nm are detected by SANS, but not by BET. Most likely these pores are enclosed and inaccessible to nitrogen ad-sorption or condensation. A fraction of these small pores survives compaction at 290 °C, but they are completely removed during compaction at 413 °C. The removal of these pores during compaction and sintering at low temperatures is expected since small pores have the highest sintering rates.11
On the large pore-size side of the distribution, a tail in the specimen compacted at 25 °C is detected by both techniques; it extends to about 100 nm in diameter, while the average pore diameter is 21 nm. Compaction at either 290 °C or 413 °C removes a major portion of this coarse porosity, presumably by grain boundary sliding processes that are thermally activated. The pores that survive these compactions have a comparatively narrow size distribution, extending from about 4 to 20 nm in diameter, with the average at 14 nm instead of 21 nm, after the initial preparation.
Table II summarizes the results of average size and pore volume12 fraction; it also provides a comparison of
the different methods applied. The values quantitatively document the above-mentioned similarities and differ-ences. For example, they show that the portion of closed porosity in the sample compacted at room temperature amounts to a volume fraction of about 10%, i.e., one-third of the total porosity. Consequently, the density of this sample is rather less than that deduced from BET and listed in Table I. When the results of SANS and BET are in close agreement, it is evident that the pore structure is open. It signifies that all pores larger than 8 nm in diameter in the as-prepared specimen, and essentially all
pores surviving compaction at 290 °C and 413 °C, are either at the surface or completely interconnected.
V. SUMMARY
In summary, these experiments have demonstrated that SANS can be employed for quantitative measure-ment of the pore size distribution in ultra-fine-grained ceramic materials and that it provides complementary information to that obtained by BET and gravimetry. An important element in our evaluation of the SANS results, however, was the subtraction of the background scattering from grain boundaries and surface roughness. This was possible in this study by using a reference sample that had a similar grain boundary structure as the test samples, but little residual porosity.
ACKNOWLEDGMENTS
The authors are grateful to H. J. Hofler for help in preparing the specimens and for his comments on the manuscript. The work was supported at The University of Illinois by the United States Department of Energy, Office of Basic Energy Sciences, DEFG02-91ER45439.
REFERENCES
1. R. S. Averback, H.J. Hofler, H. Hahn, and J. C. Logas, Acta Metall. et Materiala (in press).
2. H. Hahn, J. Logas, H. J. Hofler, P. Kurath, and R. S. Averback, in
Superplasticity in Metals, Ceramics, and Intermetallics, edited by
M. J. Mayo, M. Kobayoshi, and J. Wadsworth (Mater. Res. Soc. Symp. Proc. 196, Pittsburgh, PA, 1990), p. 71.
3. H. Karch, R. Birringer, and H. Gleiter, Nature 330, 556 (1987). 4. R. W. Siegel, R. Ramasamy, H. Hahn, Li Zongquan, Lu Ting, and
R. Gronsky, J. Mater. Res. 3, 1367 (1988).
5. H. J. Hofler and R. S. Averback, Scripta Metall. et Materiala 24, 2401 (1990).
6. H. Hahn, J. Logas, and R.S. Averback, J. Mater. Res. 5, 609 (1990).
7. G. Kostorz, Mater. Sci. Forum 27/28, 325 (1988).
8. R. Birringer, U. Herr, and H. Gleiter, Trans. Jpn. Inst. Met. 27 (suppl.), 43 (1986).
9. K. Ibel, J. Appl. Cryst. 9, 296 (1976). 10. W. Petry, unpublished research.
11. R.J. Brook, Proc. Brit. Ceram. Soc. 32, 7 (1982).
12. The pore volume was deduced from the equation, 0.92/9o x ( l - /p) + 0 . 0 0 p o /P = 0.62p0
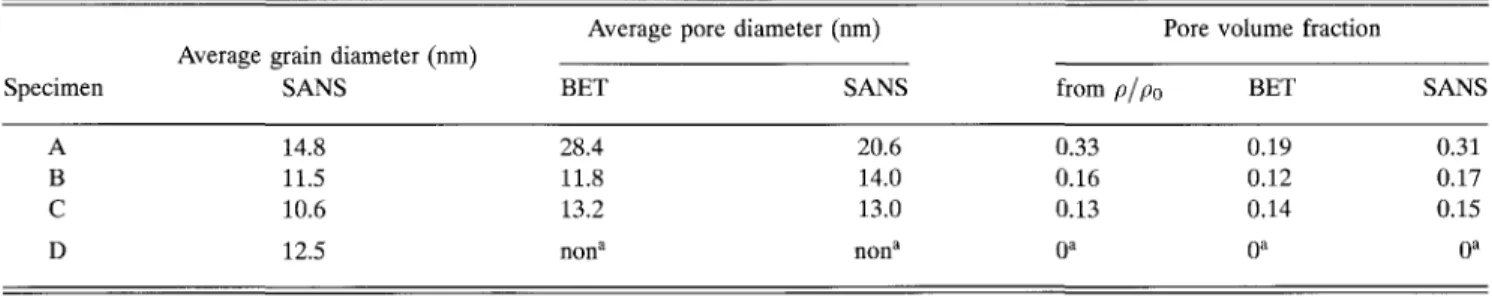
-TABLE II. Results on average size (diameter at average volume) of grains and pores and pore volume fraction, derived from BET, SANS, and macroscopic density p/po, as indicated (specimen denomination as in Table I).
Specimen
Average grain diameter (nm) SANS
Average pore diameter (nm)
BET SANS
Pore volume fraction
from p/p0 BET SANS
A B C D 14.8 11.5 10.6 12.5 28.4 11.8 13.2 nona 20.6 14.0 13.0 nona 0.33 0.16 0.13 0a 0.19 0.12 0.14 0a 0.31 0.17 0.15 0a aAssumed.