617
Published by Oxford University Press DOI: 10.1093/annhyg/mef081
Development and Validation of a New Bitumen Fume
Generation System which Generates Polycyclic
Aromatic Hydrocarbon Concentrations Proportional to
Fume Concentrations
S. BINET
1*, P. BONNET
1, H. BRANDT
2, M. CASTEGNARO
3, P. DELSAUT
1,
J. F. FABRIES
1, C. K. HUYNH
4, M. LAFONTAINE
1, G. MOREL
1, H. NUNGE
1,
B. RIHN
1, T. VU DUC
4and R. WROBEL
1*Author to whom correspondence should be addressed. Tel: +33-383-50-20-30; fax: +33-383-50-20-96; e-mail: [email protected]
1Institut National de Recherche et de Sécurité, Avenue de Bourgogne, F-54501 Vandoeuvre Cedex,
France; 2Consultant, Z. Jansestraat 46-2e, 1097 CN Amsterdam, The Netherlands; 3Consultant,
F-07240 Les Collanges, France; 4Institut Universitaire Romand de Santé au Travail, Lausanne,
Switzerland
Received 25 February 2002; in final form 12 June 2002
Bitumen fumes emitted during road paving and roofing contain polycyclic aromatic compounds (PACs) of potential health concern. Little information is available for an experi-mental device devoted to inhalation experiments with animals exposed to bitumen fumes, and in all studies the systems were never validated for a range of fume concentrations, which prohibited their use for toxicological concentration–effect studies. Therefore, the purpose of this study was to validate a new experimental device able to generate bitumen fumes at different total particulate matter (TPM) concentrations with a linear correlation between TPM and the concentrations of different PACs, thus allowing toxicological dose–response studies with fumes representative of those in the field. Atmosphere samples collected from an animal exposure chamber allowed the determination of TPM, toluene soluble matter, polycyclic aromatic hydro-carbons (PAHs) and semi-volatiles. The particulate size distributions were determined in order to assess the deposition pattern in the respiratory tract. The temperature of 170°C was chosen by analogy with the upper range of the temperature used during paving operations. The temperature of the air passing over the fume emission area was regulated to 20°C and stirring of the heated bitumen was restricted to 90 r.p.m. The data show that the objective of develop-ing a static fume generation system that reproducibly produces fumes in the inhalation chamber for specified target concentrations (TPM) were successful. The within-day variation coefficients for TPM were between 2.5 and 6.1%. The day-to-day variations for TPM concen-tration were between 4.1 and 5.8%. The concenconcen-trations of the 4–5 ring PAHs and the polycyclic aromatic sulphur heterocycles were proportional to the TPM concentration. The 2 and 3 ring PAH concentrations showed a deviation from proportionality with the TPM, probably due to their re-evaporation during sampling. The mass median aerodynamic diameter of airborne particles varied from 1.4 µm at a fume concentration of 5 mg/m3 to 3.2 µm at 100 mg/m3. In conclusion, this equipment was suitable for nose-only inhalation studies in the 5–100 mg/m3 range of TPM. Bitumen fumes were generated with a good reproducibility under well-control-led conditions. Finally, the PAH profiles from atmospheric samples were in good agreement with those measured during road paving.
Keywords: bitumen fumes; inhalation equipment; polycyclic aromatic hydrocarbons/analysis
INTRODUCTION
Bitumen fumes emitted during road paving and roofing contain polycyclic aromatic hydrocarbons (PAHs). The two principal routes of worker exposure
to bitumen fumes are skin deposition and inhalation. Although levels of exposure of workers to these fumes are generally low, they are of potential concern, because laboratory generated bitumen fume condensates have been found to be carcinogenic in mouse skin painting tests (Thayer et al., 1981; Sivak
et al., 1989). More recently, DNA adducts in skin,
lung and lymphocytes were found in rats after skin painting with undiluted bitumen fume condensates (Genevois et al., 1996). PAHs [for example, benzo[a]pyrene (B[a]P) or 3-methylcholanthrene] generally administered to animals by the oral or intra-peritoneal routes were shown to have toxic effects on reproductive function (MacKenzie and Angevine, 1981), the cardiovascular system (Penn et al., 1981; Paigen et al., 1985), the bone marrow (Legraverend
et al., 1983), the immune system (Hardin et al., 1992)
and the liver (Armstrong and Bonser, 1950); for a review see IARC (1983).
Little information is available for an experimental device devoted to inhalation experiments with animals exposed to bitumen fumes. Two inhalation studies have been carried out to evaluate the toxic effects of bitumen fumes on the lungs (Hueper and Payne, 1960; Simmers, 1964). However, the fumes were poorly characterized in terms of composition and never in terms of particle size. A recent study described a new inhalation system comprising a generation system and an inhalation chamber (Bonnet et al., 2000; Brandt et al., 2000) validated for fumes at 5 mg/m3. However, in all these studies
the systems were never validated for a range of fume concentrations, which prohibited their use for toxico-logical concentration–effect studies. Recently, the National Toxicology Program (NTP, 1999) recog-nized the lack of concentration–response and time course data and the necessity of developing a bitumen fume generator for inhalation studies. A laboratory bitumen fume generator described by Brandt and De Groot (1999) produces bitumen fumes that are representative of those workers in the field are exposed to. However, because it produces only milligram amounts of bitumen fume condensates it is not suitable to be connected to an animal exposure chamber.
In personal exposure studies in paving or indoor mastic laying, the PAH concentrations measured in the condensed bitumen fumes were found to be inde-pendent of the total fume exposure in terms of benzene soluble matter (BSM) or total particulate matter (TPM) (see for example Brandt et al., 1993, for exposures at the 1 mg/m3 TPM level; Brandt et
al., 2000, for exposures in the range 6–25 mg/m3).
This means that the concentration of individual PAHs linearly relates to the particulate exposure measured as BSM.
The purpose of this study was to validate an experimental device able to generate different
bitumen fume concentrations with a linear correlation between PAH concentration and TPM values, thus allowing toxicological dose–response studies with fumes representative of those in the field. This equip-ment was tested by collecting atmospheric samples from the animal exposure chamber using a glassfibre filter followed by a XAD-2 resin. The glassfibre filter allowed the measurement of the aerosol phase, including the determinations of TPM, BSM as toluene soluble matter and polycyclic aromatic compounds (PACs). The XAD-2 resin allowed meas-urement of the gas phase, including the determination of semi-volatiles (2 ring, most of the 3 ring and some of the 4 ring PACs) which were not retained on the glass filter. The particulate size distributions were determined according to the method of Horton et al. (1992), in order to assess the deposition pattern in the respiratory tract.
MATERIALS AND METHODS
Product
A 1200 kg batch of bitumen (50/70 pen, Venezuelan origin) was used for this experiment.
Bitumen fume generator
All the information concerning the shape and dimensions of the bitumen fume generator is given in Fig. 1. The fume generator comprised a 10 l bitumen vessel and a fume chamber. The bitumen vessel was heated to the desired temperature (170°C) by an electric hot plate. For temperature control, two calibrated probes were arrayed inside the bitumen vessel, one for temperature regulation and one for actual temperature measurement. The bottom of the fume chamber was perforated at the dimensions of the bitumen vessel diameter. When bitumen fumes were generated the upper rim of the vessel was at the same level as the bottom of the fume chamber. A detail of the adjustment of the bitumen vessel in the fume chamber is given in Fig. 2. Each desired concentration in the exposure chamber was obtained by choosing an aluminium tube with a different inside diameter (5.0, 17.0 and 23.3 cm), corres-ponding to evaporation areas of 19.6, 227 and 426 cm2.
This defines the area from which the fume is emitted (emission area). As soon as the temperature reached ∼170°C an electric stirrer was started in order to obtain a uniform mixture within the bitumen vessel during the generation period; the stirrer was regulated at a constant rate (90 r.p.m.). A stainless steel stirring rod passed through the top of the chamber via a gas tight seal. The rod extremity, submerged in the hot bitumen, was equipped with a thin stainless steel blade (240 × 60 mm) perforated with 12 holes (each 14 mm diameter). After starting the stirrer, the compressed air (filtered through an Ultrafilter Gmbh filter, model PEG.0006; Ultrafilter Int., Germany)
was admitted into the fume chamber at a flow rate of 23 l/min: 20 l dry air and 3 l water-saturated air in order to obtain an ∼40% relative humidity in the animal exposure chamber. Before entering the fume chamber this air was regulated to 20°C by passing through two glass heaters connected to a cryothermo-static water bath. This filtered and conditioned air flowed horizontally through the fume chamber at a distance of 350 mm from the bitumen surface. Bitumen emissions were then introduced into the inhalation chamber (a thermometer also measured the temperature in the fume chamber).
Inhalation chambers
Two identical inhalation chambers were used for this experiment (Bonnet et al., 2000). The first, connected to the bitumen fume chamber, was placed inside a hood for safety reasons. The second was placed outside the hood and was devoted to exposure of control animals to filtered air. During the expo-sure, the temperature of the chambers was 25 ± 2°C and the relative humidity was 40 ± 5%. In order to prevent leakage of test fumes, a negative pressure of ∼6 mm water was maintained in the exposure chamber by extracting air with a fan at a constant speed. Each chamber, made of stainless steel with a glass door, had an internal volume of 37 l. The 23 l/min air flow containing the bitumen fumes was
introduced at the top of the chamber and exhausted at the bottom. The air exhaust was linked to a series of cleaning devices before being released into the main exhaust pipe. The door included several ports for atmosphere sampling and for connecting the pleth-ysmographs used for nose-only exposures (rats or mice).
Sampling and analysis of the atmosphere in the inhalation chamber
In order to validate the equipment, atmospheric samples were collected in the breathing zone of animals. Analyses were performed by two labora-tories: INRS (Vandoeuvre, France) and IST (Institut Universitaire Romand de Santé au Travail, Lausanne, Switzerland). Filter analysis included quantitative determination of TPM, soluble matter (BSM), B[a]P and other PACs (IST only). Analyses of the XAD-2 resins included quantitative determination of semi-volatile and semi-volatile PACs.
Particulates were collected by drawing air through a 37 mm pre-weighed glass filter (Whatmann) at a rate of 1 l/min. Each filter was fitted in a standard 37 mm closed-face cassette (Millipore). The vapour and semi-volatile phases were collected on a XAD-2 adsorption tube placed in series with the filter cas-sette. Sampling volumes depended on TPM concen-trations.
Stability of the emission over time
In the exposure chamber the stability of the emis-sion over time was followed by analysis of TPM and B[a]P and by monitoring the variations in aerosol mass concentration with a Hund™ photometer.
The TPM measurements were performed by weighing filters on a 10 µg accuracy electronic balance (Sartorius MC 210S; Goettingen, Germany) before and immediately after sampling, as previously described (Bonnet et al., 2000). This fast weighing allowed a regular control of stability during the daily 6 h generation period.
The B[a]P analysis by INRS was performed using the working principle described in Simon et al. (2000), but with some modifications. The filter was extracted twice with 4 ml of methanol for 15 min in an ultrasonic bath. Then the extract was directly injected into a liquid chromatographic switching system equipped with three pre-columns (two diol
Nucleosil 5 µm, one polyNO2 Polygosil 5 µm;
Macherey Nagel) and one analytical Si-C18 column
(Chromasil; Ekanobel). Detection was carried out with a Shimadzu RF 551 fluorimeter set to 365 nm for excitation and 420 nm for emission.
A Hund™ data photometer (Helmut Hund GmbH, Wetzlar, Germany) monitored the aerosol concentra-tion in the exposure chamber by measuring the light scattered by airborne particles inside the sensing volume of the instrument (Görner et al., 1995). It was also used to determine the optimal time to start the inhalation exposure.
Determination of the particle size distribution
The particle size distribution was investigated according to Fabries et al. (2000). Briefly, two instru-ments, positioned near the inhalation chamber, were used: a quartz crystal microbalance (QCM) impactor (model 3000; California Measurements, Sierra Madre, CA) and an Aerosizer® particle size analyser
(Amherst Process Instruments Inc., Hadley, MA). The QCM impactor was a 10 stage cascade impactor that used coated piezoelectric quartz crystal col-Fig. 2. Details of the adjustment of the bitumen vessel in the fume chamber.
lection substrates. The sampling time was limited to 10 s at 5 mg/m3 and 5 s only at high aerosol
concen-trations (50 and 100 mg/m3). The sampling time for
each measurement sequence was fixed to 2 min with the Aerosizer.
Analysis of PAHs and sulphur heterocycles (PASHs)
PAH profiles and PASHs in raw bitumen and in bitumen fumes were determined by IST with GC-MS further to a multistep sample treatment and automatic clean-up procedure, essentially based on the method described by Vu Duc et al. (1995). Briefly, the internal standard, indeno[1,2-c,d]fluoranthene, was added to 0.1–0.3 g raw bitumen or to bitumen fume filter samples obtained by extracting the filter by sonication twice with 25 ml of toluene for 10 min. The evaporated extract was submitted to a liquid– liquid partition between cyclohexane and dimethyl
formamide:H2O according to the procedure of
Grimmer (1972) and Grimmer et al. (1983), before elution of the cyclohexane extract on a SiO2 micro-column. The eluent was filtered on 0.45 µm Acrodisc filters, evaporated to ∼200 µl and fractionated by HPLC. The clean-up phase was performed as an automatic process. The PAHs fraction of interest, which also contained PASHs, was separated on a capillary column and analysed by GC ion trap MS using the single ion storage mode for optimized sensitivity. For raw bitumen, a double liquid–liquid partition was found necessary to reduce the aliphatic hydrocarbon background to achieve the sensitivity required for some PAHs.
The identification of PAHs and PASHs was made by comparison of the spectrum of the unknown peak with that of a standard compound at the same reten-tion time. Quantificareten-tion was made relative to the respective calibration curves between compounds of interest and the internal standard. The performance of the method has been assessed in inter-laboratory comparisons and certifications of reference materials (European Commission, 1994).
Quality assurance was according to procedures described in standard EN 45000, for which the labora-tory is accredited.
The semi-volatiles PAHs (SV-PAHs) were deter-mined after separate desorption of the two distinct parts of the XAD-2 with 4 ml of CS2 by sonication for 30 min. One microlitre of the combined filtered solution was adjusted to 5 ml and then injected into a GC column and quantified by ion trap MS. Standard reference compounds were used for comparisons of respective spectra.
RESULTS
Operating parameters of the fume generator and resultant TPM concentrations in the exposure chamber
Emission areas used to obtain different TPM concentrations in the exposure chamber and the temperatures measured in the different components of the exposure system are given in Table 1. Three emission areas were studied: 19.6, 227 and 426 cm2.
When using 19.6 cm2, the volume sampled was 180 l
and the TPM concentration varied between 5.45 and 6.6 mg/m3. When using 227 cm2, the volume
sampled was 80 l and the TPM concentration varied from 50.4 to 56.6 mg/m3. When using 426 cm2, the
volume sampled was 40 l and the TPM concentration varied from 88.8 to 106.9 mg/m3. The within-day
variation coefficients for TPM were between 2.5 and 6.1% and the day-to-day variations for TPM concen-tration were between 4.1 and 5.8% (from raw data, not shown). The temperatures corresponded to the means of the temperatures measured every 15 min over 6 h/day. Results showed that the bitumen temperature was well regulated and that the fume
chamber temperature increased from ∼50 to 63°C
between 5 and 100 mg/m3 target TPM. The variations
in temperature in the inhalation chamber were very small (<1.4°C).
Analytical results of some TPM and the corres-ponding BSM and B[a]P are given in Table 2. The ratio BSM/TPM ranged from 73 to 83%.
Figure 3 shows a typical Hund™ record for a target
TPM concentration of 100 mg/m3. The instrument
was mainly used to check the stability of aerosol concentration, but not to accurately monitor this parameter. The reason is that the signal measured by
Table 1. Operating parameters of the fume generation system (data from INRS and IST) Aluminium tube inside diameter (cm) Emission area (cm2) TPM (mg/m 3)
(mean ± SD) Bitumen temperature (°C) (mean ± SD) Fume chamber temperature (°C) (mean ± SD) Exposure chamber temperature (°C) (mean ± SD) 5 19.6 6.18 ± 0.35 (n = 8) 169.4 ± 0.65 (n = 120) 50.1 ± 0.69 (n = 120) 24.9 ± 1.08 (n = 120) Range 5.45–6.60 168.0–171.0 48.5–51.4 22.2–27.0 17 227 53.6 ± 2.19 (n = 16) 169.2 ± 0.48 (n = 120) 59.6 ± 0.74 (n = 120) 25.3 ± 1.23 (n = 120) Range 50.4–56.6 168.0–170.0 58.5–61.5 22.0–27.7 23.3 426 97.7 ± 5.63 (n = 47) 169.8 ± 0.64 (n = 230) 63.4 ± 0.62 (n = 230) 26.3 ± 0.85 (n = 230) Range 88.8–106.9 168.0–171.5 61.0–68.0 23.5–29.0
the photometer depends not only on aerosol concen-tration but also on particle size distribution. The accurate measurement of aerosol concentration is performed by sampling the aerosol on glassfibre filters and direct weighing. The concentration was stabilized 120 min after the beginning of the experi-ment (t = 0) and was maintained within a range of
88.8–91.5 mg/m3. A peak concentration was
observed at t = 90–120 min, corresponding to an integrated concentration measured by sampling at 117 mg/m3.
Assessment of particle size distribution
The particle size distribution in the exposure
cham-bers was measured at 5, 50 and 100 mg/m3 TPM
concentrations. Both techniques, QCM and Aero-sizer®, gave similar results. Figure 4 shows that the
mass median aerodynamic diameter (MMAD) of par-ticles increased with fume concentration: the average
MMAD value was 1.4 µm at 5 mg/m3, 2.6 µm at
50 mg/m3 and 3.2 µm at 100 mg/m3. The average
value of geometric standard deviation, calculated from the percentiles 15.87, 50 and 84.13% of the cumulative mass distribution, was 1.6 according to QCM measurements and 1.3 for the Aerosizer, cor-responding to a weakly polydisperse aerosol.
The particle size distribution did not show any significant intra-day variation after a stabilization period of 120 min.
Determination of PACs on the filters and XAD-2 resins
Table 3 presents the concentrations of the PAHs and PASHs analysed on the filter, on the XAD-2 cart-ridge and the corresponding total concentration. The PASHs have been presented as a separate group, allowing a comparison of the PASHs and of the PAHs with TPM concentrations.
PAHs with 4–5 rings and PASHs. When the mean
TPM concentration increased by a factor of 8.5 (from
Table 2. Analytical results of TPM, BSM and B[a]P (all data from IST)
TPM (mg/m3) BSM (mg/m3) B[a]P (ng/m3) Mean ± SD 6.30 ± 0.22 (n = 3) 4.6 ± 0.46 (n = 3) 36.3 ± 3.21 (n = 3) Range 6.05–6.45 4.10–5.0 34.0–40.0 Mean ± SD 53.5 ± 2.72 (n = 6) 42.7 ± 2.02 (n = 6) 140 ± 15.6 (n = 6) Range 50.4–56.6 41–46.6 114–157 Mean ± SD 98.7 ± 6.12 (n = 17) 82.4 ± 4.89 (n = 17) 198 ± 50.4 (n = 17) Range 88.8–106.9 76–93 147–299
6.3 to 53.5 mg/m3) the mean sum of 4–5 ring PAHs
increased by a factor of 6.7 and the mean sum of 3–4 ring PASHs increased by a factor of 7.9. When the mean TPM concentration increased by a factor of 15.7 (from 6.3 to 98.7 mg/m3) the mean sum of 4–5
ring PAHs increased by a factor of 14.5 and the mean sum of PASHs increased by a factor of 19.7. There-fore, we can conclude that there is good agreement between the increase in 4–5 ring PAHs and 3–4 ring PASHs and the increase in TPM concentration.
PAHs with 2–3 rings. The data demonstrate a lack of proportionality between the TPM concentrations and the concentrations of 2 and 3 ring PAHs. The sums for the 3 ring PAHs increased between 6.3 and 53.5 and 53.5 and 98.7 mg/m3, but not in proportion, and
those of the 2 ring PAHs did not increase at all in the 53.5–98.7 mg/m3 range.
Exhaustion of volatile compounds due to the fume generation process
In bitumen. Table 4 presents the PAH contents in the bitumen 50/70 pen before and after 7 h fume gener-ation at 170°C during 5, 50 and 100 mg/m3 target
TPM concentration experiments. There is no sign of exhaustion for any of the PAHs analysed in all cases.
In the fumes. Table 5 presents the PAH concentra-tions for the 100 mg/m3 target TPM sampled at the
beginning and end of a day from the same batch of bitumen. No statistical differences were observed with a one-way Anova for the interaction between the
first and the third samplings during the same day (P = 0.45). However, there is a tendency for 2 ring PAHs to be lower at the end of the day and a two-way Anova analysis of the interaction between sampling and number of rings confirmed a statistical difference (P < 0.001). This difference disappeared when the data for naphtalene and monosubstitued naphtalene were excluded (P = 0.44).
DISCUSSION
We have developed an inhalation exposure system based on a newly developed fume generator and an exposure chamber used in a previous bitumen fume inhalation study (Bonnet et al., 2000). The develop-ment of a new fume generator was necessary, because with the system used in the previous study, a fume generator developed by the Heritage Research Group, only the fumes generated at a 5 mg/m3 TPM
concentration were representative of fumes workers are exposed to in paving or roofing operations; fumes generated at the 50 mg/m3 level were not (Brandt et
al., 2000).
With our current system, a static fume generator has been used, the fume emission area of which can be varied. In this way, different fume concentrations can be delivered to the inhalation chamber without changing the bitumen temperature (170°C, chosen by analogy with the upper range of the temperature used during paving operations). Due to stirring, a cone was Fig. 4. Cumulative undersize particle mass distribution of bitumen fumes for three concentrations obtained for one measurement
Table 3. Concentrations of PAHs and PASHs in the filter and XAD-2 tubes for the three target TPM concentrations (5, 50 and 100 mg/m3) (all data from IST)
Quantification by GC-MS. Compound n Concentration (µg/m3) Target TPM 5 mg/m3 (measured 6.3 mg/m3) (n = 3) Target TPM 50 mg/m 3 (measured 53.5 mg/m3) (n = 6) Target TPM 100 mg/m 3 (measured 98.7 mg/m3) (n = 17)
Filter XAD-2 Sum
(mean ± SD) Filter XAD-2 Sum(mean ± SD) Filter XAD-2 Sum(mean ± SD) PASH Benzo(b)naphtho-[1,2-d]thiophene 4 0.099 0.099 ± 0.0081 0.804 0.804 ± 0.021 2.030 2.030 ± 0.073 Benzo(b)naphtho-[2,1-d]thiophene 4 0.327 0.327 ± 0.0222 2.909 2.909 ± 0.086 7.585 7.585 ± 0.281 Benzo(b)naphtho-[2,3-d]thiophene 4 0.045 0.045 ± 0.0035 0.305 0.305 ± 0.014 0.721 0.721 ± 0.025 Dibenzothiophene 3 2.645 2.645 ± 0.1867 20.552 20.55 ± 0.914 51.225 51.23 ± 2.599 PAHs and SV-PAH
Naphthalene 2 0.104 53.1 53.2 ± 3.34 0.199 139.5 139.7 ± 11.97 0.306 104.5 104.8 ± 8.15 1-Methylnaphthalene 2 0.022 49.8 49.8 ± 1.47 2.181 197.1 199.3 ± 12.34 5.983 211.0 217.0 ± 13.42 2-Methylnaphthalene 2 0.027 83.8 83.8 ± 1.48 2.423 334.5 337.0 ± 22.32 6.593 295.2 301.8 ± 19.90 1-Ethylnaphthalene 2 20.4 20.4 ± 0.42 91.5 91.5 ± 5.11 86.1 86.1 ± 3.82 1,2-Dimethylnaphthalene 2 0.053 15.8 15.9 ± 0.48 2.610 63.1 65.7 ± 3.73 7.718 79.4 87.1 ± 12.08 1,3- + 1,4- + 1,5-Dimethylnaphthalene 2 0.282 34.0 34.0 ± 1.09 10.778 138.8 149.6 ± 8.14 31.809 142.8 174.6 ± 6.99 2,3-Dimethylnaphthalene 2 0.020 1.538 1.5 ± 0.11 4.525 4.53 ± 0.31 2,6-Dimethylnaphthalene 2 0.052 54.2 54.3 ± 1.77 2.491 223.2 225.7 ± 11.34 7.255 208.9 216.1 ± 17.15 2,3,5-Trimethyl-naphthalene 2 0.271 26.9 27.2 ± 0.77 5.200 71.2 76.4 ± 4.55 14.309 69.6 83.9 ± 3.22 Biphenyl 2 4.3 4.32 ± 0.34 16.1 16.1 ± 0.73 16.7 16.7 ± 0.70 2-Methylbiphenyl 2 0.8 0.81 ± 0.05 3.3 3.3 ± 0.17 3.36 3.36 ± 0.17 Acenaphthylene 3 1.7 1.68 ± 0.08 5.6 5.6 ± 0.39 6.76 6.76 ± 0.27 Acenaphthene 3 4.1 4.10 ± 0.57 11.0 11.0 ± 0.56 11.8 11.8 ± 0.57 Anthracene 3 0.012 0.5 0.48 ± 0.03 0.400 0.43 0.83 ± 0.07 1.032 3.15 4.18 ± 1.92 Fluorene 3 0.144 12.1 12.24 ± 0.46 3.011 27.5 30.5 ± 1.88 8.478 25.3 33.7 ± 2.25 Phenanthrene 3 1.846 7.7 9.50 ± 0.478 12.399 7.1 19.5 ± 1.16 30.607 5.9 36.5 ± 1.48 1-Methylphenanthrene 3 1.622 1.4 2.98 ± 0.084 8.549 0.74 9.29 ± 0.246 22.033 0.55 22.58 ± 0.945 2-Methylanthracene 3 1.576 1.3 2.85 ± 0.080 8.446 0.69 9.14 ± 0.320 22.076 0.52 22.60 ± 1.056 3,6-Dimethyl-phenanthrene 3 0.155 nd 0.16 ± 0.004 1.012 nd 1.012 ± 0.029 2.812 nd 2.812 ± 0.133 Benzo[a]anthracene 4 0.060 0.060 ± 0.002 0.287 0.287 ± 0.008 0.622 0.622 ± 0.018 Benzo[a]fluorene 4 0.171 0.171 ± 0.007 1.087 1.087 ± 0.026 2.473 2.473 ± 0.062 Benzo[b]fluorene 4 0.007 0.007 ± 0.003 0.165 0.165 ± 0.005 0.442 0.442 ± 0.017 Chrysene 4 0.116 0.116 ± 0.008 0.820 0.820 ± 0.030 1.827 1.827 ± 0.053 Fluoranthene 4 nd nd nd Pyrene 4 0.141 nd 0.141 ± 0.005 0.991 nd 0.991 ± 0.030 2.801 nd 2.801 ± 0.122 3-Methylchrysene 4 0.071 0.071 ± 0.014 0.377 0.377 ± 0.011 0.875 0.875 ± 0.027 4-Methylchrysene 4 0.080 0.080 ± 0.008 0.765 0.765 ± 0.030 1.441 1.441 ± 0.024 5-Methylchrysene 4 0.083 0.083 ± 0.006 0.546 0.546 ± 0.029 1.083 1.083 ± 0.030 1-Methylpyrene 4 0.194 0.194 ± 0.009 1.265 1.265 ± 0.042 2.804 2.804 ± 0.071 Benzo[a]pyrene 5 0.036 0.036 ± 0.002 0.141 0.141 ± 0.006 0.198 0.198 ± 0.012 Benzo[e]pyrene 5 0.061 0.061 ± 0.005 0.441 0.441 ± 0.018 0.715 0.715 ± 0.022 Benzo[k]fluoranthene 5 0.059 0.059 ± 0.003 0.322 0.322 ± 0.006 0.407 0.407 ± 0.0386
Sum of 2 ring SV-PAHs 343 344 1278 1306 1218 1296
Sum of 3 ring SV-PAHs 29 34 53 87 53.9 141
Sum of 4–5 ring PAHs 1.08 7.21 15.7
formed at the surface of the hot bitumen. Therefore, in order to prevent leakage of fumes from the whole surface of the vessel or part of it, it was important to immerse the tube 10 mm into the hot bitumen before stirring. This positioning ensured reproducible analytical results and a steady TPM. The amount of bitumen is such that during the time of the
experi-ment no exhaustion takes place even at the highest rate of fume generation. In Table 6 it is demonstrated that for PAHs with a boiling point above say 350°C the PAH profile (expressed as p.p.m.w. in BSM) is virtually independent of the amount of fumes (TPM) produced, as is the case with field fumes sampled during personal exposure studies (Brandt et al.,
Table 4. PAH content in the 50/70 bitumen before and after heating for 7 h at 170°C during fume generation at 5, 50 and 100 mg/m3 TPM target concentration
Trace, < 0.1 ng/mg.
Compound Rings Concentration (ng/mg)
Target TMP 5 mg/m3 Target TMP 50 mg/m3 Target TMP
100 mg/m3 0 h heating (112 mg assay) 7 h heating (178 mg assay) 0 h heating (115 mg assay) 7 h heating (98 mg assay) 0 h heating (97 mg assay) 7 h heating (114 mg assay) PASH Dibenzothiophene 3 2.8 3.5 3.1 2.7 2.6 2.2 Benzo(b)naphtho-[1,2-d]thiophene 4 1.7 1.7 1.3 1.2 1.2 0.9 Benzo(b)naphtho-[2,1-d]thiophene 4 6.1 6.2 4.8 4.4 4.7 4.0 Benzo(b)naphtho-[2,3-d]thiophene 4 0.6 0.7 0.2 0.1 0.5 0.1 PAH
1,2-Dimethylnaphthalene 2 0.16 0.21 Trace Trace Trace Trace
1,3-Dimethylnaphthalene 2 0.73 0.72 0.68 0.77 0.64 0.56
1,4-Dimethylnaphthalene 2 Trace Trace Trace Trace Trace Trace
1,5-Dimethylnaphthalene 2 0.07 0.07 Trace Trace Trace Trace
1-Methylnaphthalene 2 0.40 0.40 0.30 0.27 0.08 0.09
2,3,5-Trimethylnaphthalene 2 0.23 0.27 0.17 0.20 0.06 0.07
2,3-Dimethylnaphthalene 2 0.08 0.11 Trace Trace Trace Trace
2,6-Dimethylnaphthalene 2 0.16 0.19 0.13 0.12 Trace Trace
2-Methylnaphthalene 2 0.56 0.53 Trace Trace Trace Trace
Naphthalene 2 0.27 0.23 Trace Trace Trace Trace
1-Methylphenanthrene 3 2.84 3.37 5.84 6.33 5.65 5.66
2-Methylanthracene 3 2.62 3.06 2.82 3.06 2.73 2.91
3,6-Dimethylphenanthrene 3 0.32 0.49 0.26 0.17 0.12 0.19
Anthracene 3 Trace Trace Trace Trace Trace Trace
Fluorene 3 0.10 0.18 0.52 1.57 0.36 0.44 Phenanthrene 3 2.28 2.71 2.96 3.19 2.35 2.30 1-Methylpyrene 4 1.40 1.70 2.35 2.68 2.70 2.62 1-Methylpyrene 4 1.39 1.68 2.47 2.73 2.70 2.62 3-Methylchrysene 4 1.22 1.02 1.12 1.60 1.27 1.36 4-Methylchrysene 4 2.43 1.84 1.16 1.06 0.99 0.93 5-Methylchrysene 4 1.75 1.36 1.76 1.46 1.73 1.83 Benzo[a]anthracene 4 0.66 0.62 0.76 0.59 0.58 0.57 Benzo[a]fluorene 4 0.99 1.13 0.87 0.69 0.67 0.65 Benzo[b]fluorene 4 0.15 0.19 0.16 0.23 0.22 0.19 Chrysene 4 1.94 1.78 1.26 1.83 1.75 1.85 Pyrene 4 0.88 1.07 1.34 1.36 1.32 1.31 Benzo[a]pyrene 5 0.66 0.50 0.62 0.61 0.67 0.78 Benzo[e]pyrene 5 3.37 3.22 2.54 2.64 2.31 2.45 Benzo[k]fluoranthene 5 1.23 1.58 0.69 0.94 0.78 0.81
2000). For the deviation from proportionality of the measured concentrations of PAHs boiling below 350°C with the TPM concentration the following explanation can be given. During sampling some of the material, including the lower molecular weight PAHs that were primarily deposited on the filter re-evaporates (Brandt et al., 1985; Bonnet et al., 2000), are transferred to the XAD-2 adsorption tube connected in series with the filter. Brandt et al. (1985) demonstrated that approximately constant amounts of material were removed per volume of air.
Because for the 5 mg/m3 target TPM 180 l was
sampled, more material was transferred to XAD-2 than with the 50 and 100 mg/m3 target TPM, where
80 and 40 l were sampled, respectively. This is confirmed by the increase in the BSM:TPM ratio with increasing TPM; 73, 80 and 83% for the 5, 50
and 100 mg/m3 target TPM, respectively. In the
working up of the filters and preparation for PAH analysis evaporation losses will also occur. Because
the XAD-2 adsorption tubes are only extracted prior to analysis in this step, no evaporation losses will occur. Hence, material transferred to the XAD-2 resin during sampling will be analysed without loss, whereas material remaining on the filter will be lost by evaporation before analysis. This mechanism indi-cates that the deviations from proportionality for the 2 and 3 ring PAHs is an analytical artefact.
The data in Table 2 show that the fumes can be generated in a reproducible way.
A comparison of the profiles [again as p.p.m.w. in BSM, because this is independent of the fume (TPM or BSM) concentration] of the PAHs that have been analysed in both our study and during personal exposure studies of road paving operations has been made (Table 7). This comparison shows that the profiles of our laboratory generated fumes are similar, especially those for the 4 and 5 ring PAHs. In the field samples, due to re-evaporation of material already deposited on the filter, losses of material with
Table 5. PAH content (µg/m3) of the particulate matter in the first and the final third filter samples during the 6 h bitumen fume
generation at a target TPM concentration of 100 mg/m3 (n = 6)
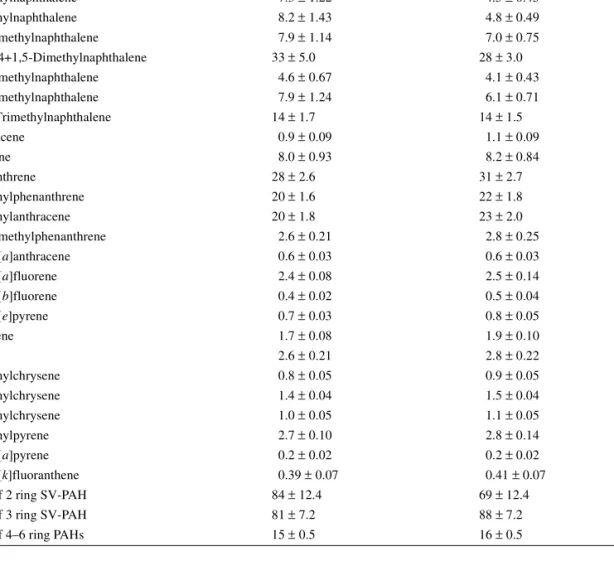
Start (mean ± SE) End (mean ± SE)
TPM (mg/m3) 101 ± 2.6 96 ± 2.5 Naphthalene 0.45 ± 0.09 0.18 ± 0.02 1-Methylnaphthalene 7.3 ± 1.22 4.5 ± 0.45 2-Methylnaphthalene 8.2 ± 1.43 4.8 ± 0.49 1,2-Dimethylnaphthalene 7.9 ± 1.14 7.0 ± 0.75 1,3+1,4+1,5-Dimethylnaphthalene 33 ± 5.0 28 ± 3.0 2,3-Dimethylnaphthalene 4.6 ± 0.67 4.1 ± 0.43 2,6-Dimethylnaphthalene 7.9 ± 1.24 6.1 ± 0.71 2,3,5-Trimethylnaphthalene 14 ± 1.7 14 ± 1.5 Anthracene 0.9 ± 0.09 1.1 ± 0.09 Fluorene 8.0 ± 0.93 8.2 ± 0.84 Phenanthrene 28 ± 2.6 31 ± 2.7 1-Methylphenanthrene 20 ± 1.6 22 ± 1.8 2-Methylanthracene 20 ± 1.8 23 ± 2.0 3,6-Dimethylphenanthrene 2.6 ± 0.21 2.8 ± 0.25 Benzo[a]anthracene 0.6 ± 0.03 0.6 ± 0.03 Benzo[a]fluorene 2.4 ± 0.08 2.5 ± 0.14 Benzo[b]fluorene 0.4 ± 0.02 0.5 ± 0.04 Benzo[e]pyrene 0.7 ± 0.03 0.8 ± 0.05 Chrysene 1.7 ± 0.08 1.9 ± 0.10 Pyrene 2.6 ± 0.21 2.8 ± 0.22 3-Methylchrysene 0.8 ± 0.05 0.9 ± 0.05 4-Methylchrysene 1.4 ± 0.04 1.5 ± 0.04 5-Methylchrysene 1.0 ± 0.05 1.1 ± 0.05 1-Methylpyrene 2.7 ± 0.10 2.8 ± 0.14 Benzo[a]pyrene 0.2 ± 0.02 0.2 ± 0.02 Benzo[k]fluoranthene 0.39 ± 0.07 0.41 ± 0.07
Sum of 2 ring SV-PAH 84 ± 12.4 69 ± 12.4
Sum of 3 ring SV-PAH 81 ± 7.2 88 ± 7.2
the highest vapour pressures (i.e. the 2 and 3 ring PAHs and other molecules of similar volatilities) can occur. In the laboratory samples this re-evaporation
will be less, because a higher concentration of these PAHs will be present in the vapour phase than in the field (Brandt and De Groot, 1999).
Table 6. PAH profiles (p.p.m.w. in BSM) for the three target concentrations
Compound BP n PAH concentration (p.p.m.w. in BSM)
Target TPM 5 mg/m3 Target TPM 50 mg/m3 Target TPM 100 mg/m3
PAH
Sum of 2 ring PAHs 181 642 953
Anthracene 340 3 3 9 13 Fluorene 294 3 31 71 103 Phenanthrene 338 3 401 290 371 1-Methylphenanthrene 355 3 353 200 267 2-Methylanthracene 363 3 343 198 268 3,6-Dimethylphenanthrene 3 34 24 34
Sum of 3 ring PAHs 1164 792 1056
Benzo[a]anthracene 425 4 13 7 8 Benzo[a]fluorene 4 37 25 30 Benzo[b]fluorene 4 2 4 5 Chrysene 431 4 25 19 22 Pyrene 393 4 31 23 34 Benzo[a]pyrene 496 5 8 3 2 Benzo[e]pyrene 5 13 10 9 Benzo[k]fluoranthene 481 5 13 8 5
Sum of 4–5 ring PAHs 235 169 190
PASH
Benzo(b)naphtho[1,2-d]thiophene 4 22 19 25
Benzo(b)naphtho[2,1-d]thiophene 4 71 68 92
Benzo(b)naphtho[2,3-d]thiophene 4 10 7 9
Dibenzothiophene 332 3 575 481 622
Table 7. PAH profiles of laboratory generated fumes compared with those from personal exposure studies (p.p.m.w. in BSM/TSM)
This laboratory inhalation study Personal exposure measurements Fume generation temperature 170°C Three road paving surveys, asphalt
temperatures 139–176°C Target
TPM 5 mg/m3 TargetTPM 50 mg/m3 TargetTPM 100 mg/m3 Average Minimum Maximum
Naphthalene 23 5 4 nd nd nd Acenaphthene 0 0 0 1.3 0.0 2.7 Fluorene 31 71 103 0.8 0.4 1.3 Phenanthrene 401 290 371 44 13 92 Anthracene 3 9 13 5.6 5.6 5.6 Fluoranthene nd nd nd 36 1.3 74 Pyrene 31 23 34 37 6.4 83 Benzo[a]anthracene 13 7 8 4.3 1.0 6.4 Chrysene 25 19 22 80 16 203 Benzo[k]fluoranthene 13 8 5 3.4 2.4 4.0 Benzo[a]pyrene 8 3 2 2.7 2.3 3.1
Sum of 3 ring PAHs 435 370 487 52 19 102
Under our new generation conditions, the MMAD varied from 1.4 µm at a concentration of 5 mg/m3 to
3.2 µm at 100 mg/m3. The particle size distribution
measured in the exposure chamber was close to that reported by Brandt et al. (1985), with a Bird and Tole cascade centripeter in three different field surveys and in the laboratory. Bitumen fumes were shown to be relatively fine aerosols, with a particle size
ranging from 0.1 to 20 µm and a mass MMAD of
∼2.3 µm. In any case, measurement of the particles generated using our new system proved them to be in a size range that permitted a deposit throughout the entire respiratory tract of animals (Ménache et al., 1995).
In conclusion, our objective of developing an inhal-ation exposure system that enables us to perform inhalation experiments on exposure to bitumen fumes of varying concentrations in the range 5–100 mg/m3
TPM has been reached. The system is reproducible and the bitumen fumes sampled from the inhalation chamber are representative of the fumes workers are exposed to in asphalt paving operations, both in terms of PAH profile and particle size distribution.
Acknowledgements—The authors want to thank André Vernay and Philipe Boiteux from IST and Jean-Claude Gondrexon for their excellent technical work, and Jean-Paul Payan for collab-oration in the statisitical analyses.
REFERENCES
Armstrong EC, Bonser GM. (1950) Squamous carcinoma of the forestomach and other lesions in mice following oral administration of 3:4:5:6-dibenzcarbazole. Br J Cancer; 4: 203–11.
Bonnet P, Binet S, Brandt HCA et al. (2000) Inhalation study on exposure to bitumen fumes Part 1: Development and validation of the equipment. Ann Occup Hyg; 44: 15–29. Brandt HCA, De Groot PC. (1999) A laboratory rig for
study-ing aspects of worker exposure to bitumen fumes. Am Ind Hyg Assoc J; 60: 182–90.
Brandt HCA, De Groot PC, Molyneux MKB, Tindle PE. (1985) Sampling and analysis of bitumen fumes. Ann Occup Hyg; 29: 27–80.
Brandt HCA, Beverwijk CDM, Harrison T. (1993) Health aspects of hot bitumen application, paper 2.09. Stockholm: Eurobitume.
Brandt HCA, Lafontaine M, Kriech AC et al. (2000) Inhalation study on exposure to bitumen fumes Part 2: Analytical results at two exposure levels. Ann Occup Hyg; 44: 31–41. European Commission. (1994) BCR information. The
cer-tification of the contents (mass fractions) of pyrene, benz[a]anthracene, benzo[a]pyrene, benzo[e]pyrene, benzo[b]fluoranthene, benzo[k]fluoranthene, indeno[1,2,3-cd]pyrene and benzo[b]naphtho[2,1-d]thiophene in dried sewage sluge, CRM 088, Report EUR 15039 EN
Fabries JF, Wrobel R, Görner P et al. (2000) Comparison of particle-size distributions of bitumen fumes measured by Aerosizer® and QCM impactor techniques. J Aerosol Sci;
31: S1011–2.
Genevois C, Brandt HCA, Bartsch H, Obrecht-Pflumio S, Wild CP, Castegnaro M. (1996) Formation of DNA adducts in skin lung and lymphocytes after skin painting of rats with undiluted bitumen or coal tar condensates. Polycyclic Aromat Comp; 8: 75–92.
Görner P, Bemer D, Fabries JF. (1995) Photometer measure-ments of polydisperse aerosols. J Aerosol Sci; 26: 1281–302. Grimmer G. (1972) Die quantitative Bestimmung von poly-cyclischen Aromaten mit der Kappilargaschromatographie. Erdöl Kohle-Erdgas-Petrochemie; 25: 339–43.
Grimmer G, Jacob J, Naujack KW. (1983) Profile of the polycyclic aromatic compounds from crude oils. Part 3. Inventory by GCGC/MS—PAH in environmental materials. Fresenius Z Anal Chem; 314: 29–36.
Hardin JA, Hinoshite F, Sherr DH. (1992) Mechanisms by which benzo[a]pyrene, an environmental carcinogen, sup-presses B cell lymphopoiesis. Toxicol Appl Pharmacol; 117: 155–64.
Horton KD, Ball MHE, Mitchell JP. (1992) The calibration of a California measurements PC-2 quartz crystal cascade impactor (QCM). J Aerosol Sci; 23: 505–24.
Hueper WC, Payne WW. (1960) Carcinogenic studies on petroleum asphalt, cooling oil and coal tar. Arch Pathol; 70: 372–84.
IARC. (1983) IARC monographs on the evaluation of car-cinogenic risk to humans, Vol. 32. Polynuclear aromatic compounds, part 1. Chemicals, environmental and experi-mental data. Lyon: IARC. p. 477.
Legraverend C, Harrison DE, Ruscetti FW, Nebert DW. (1983) Bone marrow toxicity induced by oral benzo[a]pyrene: protection resides at the level of the intestine and liver. Toxicol Appl Pharmacol; 70: 390–401.
MacKenzie KM, Angevine DM. (1981) Infertility in mice exposed in utero to benzo[a]pyrene. Biol Reprod; 24: 183– 91.
Ménache MG, Miller FJ, Raabe OG. (1995) Particle inhal-ability curves for humans and small laboratory animals. Ann Occup Hyg; 39: 317–28.
NTP. (1999) Annual plan for fiscal year 1998. National Toxicology Program, pp. 112–3. Research Triangle Park, NC: National Institute of Environmental Health Sciences, USA.
Paigen B, Havens MB, Morrow A. (1985) Effect of 3-methyl-cholanthrene on the development of aortic lesions in mice. Cancer Res; 45: 3850–5.
Penn A, Batastini G, Soloman J, Burns F, Albert R. (1981) Dose-dependent size increases of aortic lesions following chronic exposure to 7,12-dimethylbenz(a)anthracene. Can-cer Res; 41: 588–92.
Simmers H. (1964) Petroleum asphalt inhalation by mice. Arch Environ Health; 9: 727–34.
Simon P, Lafontaine M, Delsaut P, Morele Y, Nicot T. (2000) Trace determination of urinary 3-hydroxybenzo[a]pyrene by automated column switching high-performance liquid chromatography. J Chromatogr B Biomed Appl; 748: 337– 48.
Sivak A, Menzies KT, Beltis K, Worthington J, Ross A, Latta R. (1989) Assessment of cocarcinagenic/promoting activity of asphalts fumes. Cambridge, MA: Arthur D. Little. Thayer PS, Menzies KT, Von Thuna PC. (1981) Roofing
asphalt, pitch and UVL carcinogenesis. Cambridge, MA: Arthur D. Little.
Vu Duc T, Huynh CK, Boiteux P. (1995) Performance of a chromatographic procedure used in the certification of refer-ence material for polycyclic aromatic hydrocarbons in sewage sludge. Mikrochim Acta; 120: 271–80.


![Table 2. Analytical results of TPM, BSM and B[a]P (all data from IST)](https://thumb-eu.123doks.com/thumbv2/123doknet/14909056.657612/6.892.139.767.606.1096/table-analytical-results-tpm-bsm-b-data-ist.webp)