© The Author 2015. Published by Oxford University Press. All rights reserved.
For permissions, please e-mail: journals.permissions@oup.com 537
doi:10.1093/chemse/bjv039 Original Article Advance Access publication July 23, 2015
Original Article
Long-Lasting Metabolic Imbalance Related to
Obesity Alters Olfactory Tissue Homeostasis and
Impairs Olfactory-Driven Behaviors
Marie-Christine Lacroix
1, Monique Caillol
1, Didier Durieux
1,
Régine Monnerie
1, Denise Grebert
1, Luc Pellerin
2, Cendrine Repond
2,
Virginie Tolle
3, Philippe Zizzari
3and Christine Baly
11INRA, UR1197, Neurobiologie de l’Olfaction, 78350 Jouy-en-Josas, France, 2Department of Physiology, University of Lausanne, CH1005 Lausanne, Switzerland and 3UMR-S 894 INSERM, Centre de Psychiatrie et Neurosciences, Université Paris Descartes, Sorbonne Paris Cité, 75014 Paris, France
Correspondence to be sent to: Christine Baly, INRA, UR1197, Neurobiologie de l’Olfaction, 78350 Jouy-en-Josas, France. e-mail: christine.baly@jouy.inra.fr
Accepted 25 June 2015.
Abstract
Obesity is associated with chronic food intake disorders and binge eating. Food intake relies on the interaction between homeostatic regulation and hedonic signals among which, olfaction is a major sensory determinant. However, its potential modulation at the peripheral level by a chronic energy imbalance associated to obese status remains a matter of debate. We further investigated the olfactory function in a rodent model relevant to the situation encountered in obese humans, where genetic susceptibility is juxtaposed on chronic eating disorders. Using several olfactory-driven tests, we compared the behaviors of obesity-prone Sprague-Dawley rats (OP) fed with a high-fat/high-sugar diet with those of obese-resistant ones fed with normal chow. In OP rats, we reported 1) decreased odor threshold, but 2) poor olfactory performances, associated with learning/memory deficits, 3) decreased influence of fasting, and 4) impaired insulin control on food seeking behavior. Associated with these behavioral modifications, we found a modulation of metabolism-related factors implicated in 1) electrical olfactory signal regulation (insulin receptor), 2) cellular dynamics (glucorticoids receptors, pro- and antiapoptotic factors), and 3) homeostasis of the olfactory mucosa and bulb (monocarboxylate and glucose transporters). Such impairments might participate to the perturbed daily food intake pattern that we observed in obese animals. Key words: apoptosis, fasting, GLUTs and MCTs, insulin, olfaction
Introduction
Obesity has become a major challenge for public health in west-ernized societies, causing a well-defined risk of cardiometabolic dis-ease, osteoarthritis, and different types of cancer (Ma et al. 2009). This pathology results from complex interactions between genetic susceptibility and environmental influences. Numerous genetic sus-ceptibility loci for obesity have been identified over the last decade.
However, the rapid rise in the obesity epidemic over a time frame is not compatible with a change in our genetic make-up, suggesting that the Western lifestyle environment, including increased availability of palatable energetic food (high in saturated fat and refined carbohy-drates) as well as reduced physical activity, is a major determinant in obesity risk. In such an environment, genetically susceptible indi-viduals will display increased weight gain, metabolic disorders, and deregulated food intake (Paquot et al. 2012). The drive to search
for food, to decide to consume it and then to stop to consume it is triggered by internal metabolic needs, signaled by fluctuating levels of metabolic-related hormones and peptides (leptin, insulin, ghrelin, orexin) and of metabolites such as glucose and triglycer-ides. However, food consumption is also regulated by hedonic and sensory signals, including olfaction (Rolls 2012). Interestingly, the metabolic-related hormones and peptides already mentioned have been found to participate to the regulation of the olfactory signaling at the epithelium, bulb, and cortices levels (Palouzier-Paulignan et al. 2012). However, it is still unclear how the metabolic environment can modify olfactory function, especially in case of pathology char-acterized by chronic energy imbalance and food intake deregulation. In obese individuals, the homeostatic mechanisms that regu-late energy balance are overwhelmed and changes in brain reward circuitry, in response to intake of highly palatable foods, probably occur. The consequences on olfactory function remain contradictory. In humans, data are difficult to synthesize because of differences in olfactory stimuli, the satiety state, the age of patients, and level of adiposity. In cases of simple obesity in children or of extreme morbid obesity in adults, decreased odor detection was reported as com-pared with lean, age-matched, control subjects (Obrebowski et al. 2000; Richardson et al. 2004; Richardson et al. 2012). The abil-ity to detect and identify odors has been found to decrease as body mass index (BMI) rose in subjects younger than 65 years old and to increase in subjects older than 65 years, independent of any link to food odor or gender (Simchen et al. 2006). Consistent with these last data, subcutaneous adiposity in adult males has been correlated with increased odor sensitivity (Hubert et al. 1980). Besides, high odor identification scores were associated with high serum leptin levels in men (Karlsson et al. 2002).
In animal models, most of the data regarding obesity and olfac-tion were obtained using genetically modified strains displaying gene-targeted deletion for metabolic-related hormones or their receptors, leading to obese status independent of the diet that the animals received. Obese mice lacking leptin signaling (ob/ob and db/db) performed faster than their wild-type counterparts in a gen-eral olfactory acuity test, based on the localization of a hidden fatty cookie by its odor (Getchell et al. 2006). Olfactory responses to food cues were also found heightened in Zucker fat rats compared with their lean counterparts (Thanos et al. 2013; Badonnel et al. 2014).
Tucker et al. (2012), using a gene targeted deletion model of obese/ diabetic mouse (the melanocortin receptor null mouse), reported that they were less efficient in olfactory tests, taking longer time to localize a fatty scented cracker when compared with lean animals. Finally, Thiebaud et al. (2014) observed learning impairment and decreased discrimination between 2 non-food odors in obesity-prone mice (C57BL/6J) fed with high-fat/high-sugar diet, whereas they dis-played better discrimination scores when fed a moderate high-fat/ high-sugar diet. Consequently, it seems that obesity, depending on diets, endocrine and phenotypic profiles, leads to different modifica-tions of olfactory behavior.
The goal of our study was to further investigate the consequences of a chronic metabolic imbalance linked to obesity on different types of olfactory-driven behaviors and on potential molecular changes in the homeostasis of the olfactory tissues. We used animal models and diets that better fit with the complex surroundings encountered in humans, with obese people frequently displaying polygenetic pre-disposition aggravated by environmental factors, over-consumption of palatable foods, particularly those rich in fats, and food intake deregulation and with lean ones consuming preferentially healthy food (Nilsson et al. 2012; Dressler and Smith 2013). In order to
approach this polygenic susceptibility associated with different feed-ing behaviors, we used Sprague-Dawley rats selected for their ability to develop obesity (OP rats) that we fed a high-fat/high-sugar diet (DIO). We compared their performances to the ones of lean Sprague-Dawley rats selected for their resistance to obesity (OR) and fed a standard chow.
We first characterized olfactory performances of OP rats by recording olfactory-driven behaviors through the evaluation of: 1) the activity time and sniffing behavior induced by the presence of a familiar food odor (tea-ball test) and their modulation by high insulin levels, 2) the time required to find an hedonic buried cookie, to test global olfactory performance, learning, and memory, 3) the detection of an aversive non-food odor to evaluate their olfactory sensitivity. Then, we hypothesized that such modulations of olfac-tory-driven behaviors could be associated with molecular changes at the peripheral level of olfactory coding by studying factors involved in OM or OB homeostasis. We evaluated the level of expression of: 1) metabolic receptors known to be implicated both in olfactory sig-nal genesis and tissues homeostasis, such as insulin, leptin, and ghre-lin receptors (Palouzier-Paulignan et al. 2012), 2) cleaved caspases and glucocorticoids receptors because of the link between over-nutrition, obesity-related inflammation, apoptosis and neuro-degeneration (Cai 2013) and the glucocorticoids’ influence on the renewal of the OM as proapoptotic factors (Robinson et al. 1998;
Takanosawa et al. 2009), and 3) targeted cytokines implicated in low grade chronic inflammation classically observed in other tissues in obesity and insulin-resistance status (Odegaard and Chawla 2013;
Patel et al. 2013; Al Koborssy et al. 2014; Thiebaud et al. 2014). We finally determined whether the altered metabolic status (MS) of obese subjects could lead to long-term adaptations of the energy substrates used by neurons (i.e., glucose, lactate, or pyruvate), by investigating the expression of genes related to glucose and mono-carboxylate transport (GLUTs and MCTs) in the OM and OB (Brant et al. 1993; Choeiri et al. 2002; Nunez-Parra et al. 2011).
Materials and methods
Animals
All experimental protocols complied with the guidelines of the European Communities Council Directive dated 24 November 1986 (86/609/EEC), and were approved by the INRA institutional Ethics Committee (COMETHEA, authorization number 11/023). Every effort was made to minimize the number of animals used during this study, and their discomfort. Skilled staff using well-maintained equipment that ensured the rapid death of each rat carried out their euthanasia under appropriate conditions.
Nineteen male Sprague-Dawley rats (4 weeks of age; obtained from Charles River Laboratories, L’Arbresle, France) were used dur-ing this study: 9 obesity-resistant rats (OR) and 10 obesity-prone rats (OP) to take into account the polygenetic dimension of obe-sity (Nilsson et al. 2012). Both cohorts were selected by Charles River Laboratories: after feeding rats under a fatty diet the ones that gained the most weight were selected to become breeders to obtain OP rats and the ones who gained the least amount of weight as breeders for OR rats (http://www.criver.com/products-services/ basic-research/find-a-model/obese-resistant-cd-(or-cd)-rat). All the animals were housed individually in a temperature-controlled room (22 ± 2 °C) under a 12:12-h light-dark cycle (light on at 7 AM). Food and water were provided ad libitum. All animals were allowed 6 days to acclimate to the laboratory conditions, during which they were maintained on lab chow (M25, 8.32% kcal fat (100% soybean
oil), 62.72% carbohydrate (mainly 77% wheat, 8.7% soya, 5.3% alfalfa, 3.5% corn gluten flower, and 3.6% dextrose), 29.86% pro-tein, energy density 2.7 kcal/g, Dietex) and water. Then, pellets of the fatty diet (Diet Induced Obesity Diet, DIO; D12451, Research diet; http://www.researchdiets.com/opensource-diets/stock-diets/ dio-series-diets) were gradually introduced into the daily ration of OP rats for 6 days (week 0 of DIO). D12451 DIO was composed of 45% kcal fat (12% soyabean oil, 87% lard), 34% carbohydrate (21% corn starch, 29% maltodextrin, 50% sucrose) and 20% pro-tein for an energy density of 4.7 kcal/g. At the end of this adaptation period, the OP rats were fed ad libitum with this DIO (week 1 of DIO; 6 weeks of age). The OP rats were fed DIO in order to obtain a steady obese metabolic state characterized by excess weight gain, hyper-glycemia, -insulinemia, -leptinemia, insulin-resistance, and food over-consumption. The OR rats were maintained on the M25 control diet. This experimental design, that is, a rat model of polyge-netic predisposition to obesity fed with unbalanced diet versus a lean rat cohort consuming healthy food, approaches as much as possible humans’ situation, that is, a polygenetic predisposition associated to an unbalanced diet, but has several limitations. It does not allow evaluating the influence of the diet per se on olfactory function dis-orders observed in each cohort.
After 31 weeks of the experimental diets, the rats were fasted overnight prior to sacrifice time. At 8:00, animals were weighed, then anesthetized with sodium pentobarbital and decapitated. Following decapitation, the trunk blood was collected and the serum and plasma were stored at −20 °C for the subsequent examination of glucose, insulin, leptin, triglyceride, adiponectin (serum), and ghrelin (plasma). Liver and fat pads (epidydimal and subcutaneous fat from the abdomen median line to the spine and from the hip to the first rib on the right and left sides) were removed and weighed.
Evaluation of metabolic parameters Weight
The weights of all animals were recorded every week. Food intake
Food intakes were recorded during the diurnal (7:30–19:30) and nocturnal phases (19:30–7:30) of the day over 5 days after 1, 6, and 12 weeks of the experimental diet. Feed efficiency was calculated as the ratio of weight gain (g/day) to the calories ingested (Kcal/day). Insulin tolerance test
Insulin tolerance tests were performed after 30 weeks of the exper-imental diet by measuring blood glucose levels following a single intraperitoneal (IP) injection of insulin (Humalog, Lilly France Neuilly-sur-Seine, 0.75 U/kg). At 8:00 food was removed. At 14:00, blood was collected from the tail vein (obtained by tail snipping) before the insulin injection (time zero) and then 15, 30, 60, 90, and 120 min after the insulin administration. Blood glucose levels were monitored throughout the experiments using a one touch ultra device (LifeScan Inc.).
Blood metabolic parameters
Concentrations of glucose, triglycerides, insulin, and leptin were measured in plasma using commercial kits (Glucose HK assay kit from Sigma; triglyceride enzymatic PAPA150 kit from BioMérieux; Mercodia rat insulin ELISA; Crystal Chem rat leptin ELISA kit) in accordance with the manufacturer’s recommendations. For ghrelin quantifications, trunk blood samples were collected (at sacrifice time) in tubes containing EDTA (1 mg/mL final) and PHMB (0.4 mM final),
with a thiol protease inhibitor preventing the degradation of ghrelin by proteases. The blood samples were centrifuged immediately at 3000 g for 10 min at 4 °C. Serum samples were then transferred into new tubes acidified with HCl (0.1 N final) and stored at −80 °C until assay. Ghrelin was measured using 2 selective enzyme immunoassays for the acyl and desacyl forms (SPIblio Bertin Pharma, A05118 for the acyl form and A05117 for the desacyl form).
Behavioral tests
All the rats were submitted to the behavioral tests following the time schedule described in Figure 1A. Tests were performed during the light phase. A large resting period of several weeks was systemati-cally introduced between each experimental phase to help animals to recover from the previous test.
Tea-ball test
This test was designed to evaluate the level of activity (moving, grooming) induced by the introduction of new objects into the rats’ environment (tea balls that were either empty or containing food) and their interest in this food odor. The test was performed as previ-ously described with a few modifications (Prud’homme et al. 2009) in the 11th week of diet over 2 days at 14:00. On the first of these 2 days, at 08:00, the rats were placed separately in clean cages in the test room for a 4-h habituation period, with water but no food. At the end of this period, the rats were considered to be still in a satiated state as 80% of their food consumption occurs during the night phase (Farley et al. 2003). At the beginning of the test, 2 tea balls were placed carefully at the top of the cages, at each extremity of the cover, taking care not to disturb the rats. One tea ball was empty, whereas the other contained food pellets of the diet given to the respective rat cohort. The time they spent moving around or grooming (activity time) and sniffing each tea ball (sniffing time) was recorded for 20 min. At the end of this test, the tea balls were removed and the rats remained in their test cages for a 24 h fasting period. The test was performed again the next day at 14:00. Tea-ball test under the influence of insulin
This test was designed to study the influence of an insulin injection mimicking a preprandial surge and eliciting hunger in rats on tea-ball test behavioral responses (Booth and Brookover 1968). During the 15th week of diet, the test was performed again, preceded by an IP injection of either PBS (phosphate buffered saline) or insulin. The rats were placed separately in clean cages in the test room at 08:00 for an 8-h habituation period with water but no food, leading to a mild fasting state. At 16:15, they received an IP injection of PBS and the tea-ball test was performed 30 min later. At the end of the test, the rats were returned in their cages in the animal house and were fed normally. The next morning, they were once again placed in individual test cages under the conditions described above; at 15:15, they received an IP injection of insulin (Humalog; 2 IU/100 g weight), and another tea-ball test was performed 30 min later. Conditioned odor aversion test
The purpose of this test was to establish the odor detection threshold of OP and OR rats. For this test, isoamyl acetate (ISO) was used as a neutral odor with no food significance. ISO has been shown to be detectable by smell but not by taste with the range of dilu-tions used here (Slotnick et al. 1997). This test consisted to associ-ate the consumption of ISO odorized wassoci-ater with a visceral sickness induced by LiCl administration. The conditioned ISO aversion was then tested for different dilutions of ISO to establish the detection
threshold. The conditioned odor aversion (COA) test was carried out as described (Aimé et al. 2007), but with a few modifications.
Habituation period
For a 7-day habituation period, rats were accustomed to have access to the water only during 30 min/day, using 2 bottles of water similar to those used during the test sessions. Rats had access to water dur-ing 5 min in their behavioral cage and the amount of fluid drunk was weighted. Then rats were returned to their home cages and were given access to water for the remaining 25 min drinking time. The same design was used to evaluate the weight of fluid ingested during the 5 min drinking period during the COA assessment, the recovery days and the test sessions.
COA establishment
At the end of the 7-day habituation period, the rats had access for 30 min exclusively to a bottle of water odorized with ISO at 10–5
(1 μL ISO in 100 mL water; COA induction). Fifteen minutes after
the end of the drinking period, the animals received an intraperito-neal injection of LiCl (10 mL/kg at 0.15 M) in order to make them sick. The setting of this COA was performed in a different room from that used for the behavioral tests.
COA assessment
The next day, COA establishment was tested. Rats were back in their behavioral cages during their 5 min drinking period, and had access to 2 bottles, one containing water and the other ISO 10–5(vol/vol).
The amount of each fluid drunk was weighted.
Recovery period
On the following day, the rats received 2 bottles of nonodorized water following the usual design (5 min drinking period in the behavior cage, 25 min in the home cage), to verify that they drank normally. As some rats drunk less water than before COA establish-ment, we waited 2 more days before starting the test period (recov-ery period; R1, R2, and R3).
Figure 1. (A) Schematic representation of the overall course of the experimental design (experimental diet, ED; insulin, INS; insulin tolerance test, ITT; food
intake recording, FI; conditionned odor aversion test, COA). MS of OR and OP rats: (B) Body weight evolution of OR rats fed with normal chow and OP rats fed with high-fat/high-sugar diet (DIO). Day 0 corresponds to the weight at 6 weeks of age just before beginning the experimental food habituation period for OP rats. (C) Insulin tolerance test. Evolution of glucose concentrations over 120 min, following IP insulin administration (0.75 U/kg). Data were means ± SEM for n = 9 OR and n = 10 OP; *P < 0.05, **P < 0.01, OR versus OP; within cohorts values with different superscripts differ significantly (a ≠ b for OR).
Test period
The test period then started on the 22nd week of the experimental diet. Each day, the 5 min recorded drinking period was done with one bottle filled with water and the other with ISO at decreased dilutions over 6 days (10−12, 10−10, 10−8, 10−7, 10−6, 10−5; vol/vol); the
weights of ISO and water drunk were recorded. In preliminary tests, we observed that for high ISO dilutions, animals that did not per-ceive the odor, drank from the first bottle they encountered, ISO or water. To avoid this bias and be sure that animals sniffed the ISO bottle at least once, the rats were placed intentionally under the ISO bottle at the beginning of each test session. The right-left position of the bottle was systematically interchanged each day.
The number of times each animal sniffed (nose on the bottle tip) the different bottles without drinking was registered by hand during the test period by blind experimenters. The rats were then returned to their home cages and were given access to water for the remaining 25 min drinking time.
Hidden cookie test
The hidden cookie test is currently a standard method used to deter-mine broad olfactory ability (Alberts and Galef 1971). For this test, we used an almond cookie produced in the laboratory, as it has been reported that an almond odor can induce a robust increase in olfactory-related brain area activity, including in the olfactory bulb (Kulkarni et al. 2012) (cookie composition: 100 mLwater + 100 g white flour + 1 g white sugar + 1 mL commercial bitter-almond extract diluted in sunflower oil (Vahiné, McKornic, Avignon, France); 2 min baking in microwave at full power, 850 watts; 4 Kcal/cookie, 2.5% Kcal of fat). During the 10 days prior to testing, the rats were given overnight access to one bitter-almond flavored cookie (mean weight 700 mg) once every 3 days. All the rats readily displayed the same level of interest in the cookie and consumed it, thus confirming its palatability for both cohorts. The rats were tested in a satiated state, twice daily at 16:00 and 17:00. In order to also investigate their learning capacity and memory we did the test on 4 consecu-tive days during the 27th week of the experimental diets. Each rat kept its own test cage throughout the 4-day test; the bedding was changed every day. An almond cookie was hidden 3 cm beneath the deep bedding, at a different location every day. The rat was lowered into the middle of the cage and the time required to locate the cookie was recorded for 5 min. The cookie was deemed to have been found when the rat was holding it in both paws. They were allowed to eat the cookie at the end of the test and were then returned to their home cages with access to water and food between the 2 trials (trials A and B at an interval of 1 h). On the first day of the test period, if a rat did not locate the cookie within 5 min, it was given to him, and he was allowed to eat it in the test cage before being returned to his home cage. When a cookie was not retrieved within 5 min, a value of 300 s was scored.
Western blot analysis
The olfactory mucosa and bulb were extracted and analyzed using the western blot technique, as previously described (Lacroix et al. 2008). Antibodies directed against the following antigens were used during this analysis: cleaved caspase-3 (ASP175, Cell Signaling; dilution 1:200), caspase-9 (5B4, Abcam, 1:1000), beta-tubulin (β-tubulin, T4026, Sigma–Aldrich, 1:1000) and beta-actin (β-actin, A2066, Sigma–Aldrich, 1:500); insulin-receptor β (IR, rabbit poly-clonal antibody sc-711, Santa-Cruz, Tebu, Le Perray-en-Yvelines, France, 1:500) and glucocorticoid receptor (GR, rabbit polyclonal antibody (H-300): sc 8992, Santa-Cruz, 1:500). The western blot
analysis of monocarboxylate transporters was performed in col-laboration with Prof. Pellerin using antibodies obtained and previ-ously characterized in his laboratory (anti-MCT1 and anti-MCT2, 1:1000) (Pierre et al. 2000).
Quantitative real-time reverse transcription polymerase chain reaction
Total RNAs were prepared from the OM and OB according to the guanidium-thiocyanate-phenol-chloroform extraction method (Chomczynski and Sacchi 1987) and then quantified. One hundred and twenty nanograms of cDNA were obtained by reverse transcription of 4 µg mRNA from each sample, using SuperscriptTM First-Strand Synthesis, mixed with 10 µl Power SYBR Green PCR Master Mix (Applied Biosystems) and 300 nM of each primer complementary to either the target genes or to cyclophilin A, in a total volume of 20 µL (Table 1). Cyclophilin A was chosen as the reference because of its con-stant level of expression (data not shown). The reaction mixture was transferred into a 96-well optical reaction plate, sealed with appropriate optical caps and run on the Eppendorf Mastercycler ep realplex under standard conditions (50 °C, 2 min, 95 °C 10 min, followed by 40 cycles with 95 °C, 15 s, 60 °C, 1 min). All expression data were normalized to the level of cyclophilin A expression in the same individual sample. The results were calculated as delta Ct compared with cyclophilin A. Statistical analysis
All values are expressed as mean ± standard error of the mean (SEM). The data were analyzed using the R software environment for sta-tistical computing and graphics (http://www.r-project.org/). The behavioral data deviated significantly from a normal distribution and variances of the different test groups were not equal. Therefore, non-parametric statistical procedures were used. For the tea-ball tests, the sniffing times were first compared by nonparametric 3-way ANOVA [1 whole-plot factor: MS, and 2 subplot factors (control or food odor, in fed or fasted rats)] using the nonparametric analysis longitudinal data (nparLD) library of R software (http://cran.r-project.org/web/ packages/nparLD/nparLD.pdf) (Noguschi et al. 2012). For the insu-lin tea-ball test, the same analysis was performed but with the con-trol and food odor in PBS or insulin treated rats as subplot factors. Within each MS, the effect of each subplot factor was tested using 1-way nonparametric ANOVA followed by a two/K sample permuta-tion test in the Coin package of R software as a post hoc test (http:// cran.r-project.org/web/packages/coin/vignettes/coin_implementa-tion.pdf) (Wulfert et al. 1989; Agresti et al. 1990). In order to analyze the course of rat weights over time (1 whole plot factor/metabolic state and 1 subplot factor/days), the food intake (1 whole plot factor/ metabolic state and 1 subplot factor/days), the insulin tolerance test (1 whole plot factor/metabolic state and 1 subplot factor/min), the activity time during both tea-ball tests (1 whole plot factor/metabolic state and 1 subplot factor/nutritional state or /insulin treatment), the conditioned odor aversion test (1 whole plot factor/metabolic state and 1 subplot factor/odor dilution) and the hidden cookie test (1 whole plot factor/metabolic state and 1 subplot factor/odor days), a nonparametric 2-way ANOVA for repeated measures was performed (nparLD library) followed by a symmetry-test in the Coin package of R software as a post hoc test. For other measurements (body and fat mass weights at sacrifice, metabolic blood parameters, quantita-tive real-time reverse transcription polymerase chain reaction (qPCR) and western blot analysis), the values were compared using the two/K sample permutation test in the Coin package of R software. For all tests, statistical P < 0.05 was considered to be significant.
Results
Body composition and blood measurements: OP rats displayed increased body and fat pads weights associated with insulin resistance
The OP rats weighed significantly more than the OR rats before DIO feeding (133.83 ± 2.46 vs. 102.10 ± 2.25 g respectively, P < 0.05) and this difference was enhanced by DIO feeding (Figure 1B, P < 0.001). At the time of sacrifice, the body weight of OP rats was 48% higher than that of OR rats. The insulin tolerance test was performed after 30 weeks of the experimental diet; a repeated-measures ANOVA analysis of glucose concentrations over time revealed a significant effect of the metabolic state (MS) (F = 30.17, df = 1, P = 3.94 × 10⁻⁸),
time (F = 18.49, df = 1.88, P = 2.19 × 10⁻⁸) and an interaction
between time and MS (F = 4.63, df = 1.88, P = 0.01). Post hoc analy-sis showed that glucose levels were significantly higher in OP rats throughout the test period, and decreased significantly after insulin administration in OR rats only (P < 0.001); these data attested to the insulin resistance of OP rats (Figure 1C). After 31 weeks of the experimental diet (sacrifice time), the weights of the liver and both epididymal and subcutaneous fat pads were significantly higher in OP rats (Table 2). Insulin, leptin, and triglyceride levels were signifi-cantly elevated and total ghrelin was decreased in OP rats, consistent with an obese state. Furthermore, the levels of both acylated and nonacylated forms of ghrelin were lowered in OP rats (Table 2). Food intake: OP rats displayed an increase in diurnal food intake
Daily food intake
An ANOVA analysis of the food eaten daily after 1, 6, and 12 weeks of the experimental diets showed effects of the MS (F = 7.714, df = 1,
P = 0.0054) and time (F = 5.90, df = 1.92, P = 0.003), and an interaction
between MS and time (F = 7.90, df = 1.92, P = 0.0004) (Figure 2A,B). Daily food intake increased significantly between the 1st and 6th weeks of the experimental diet in the OR group (P < 0.001) but not in the OP group. Expressed in g/day, daily food intake was signifi-cantly lower in OP rats as from the 6th week (Figure 2A, P < 0.01). However, when expressed in Kcal/day, this intake was always signifi-cantly higher in OP rats (Figure 2B, P < 0.001).
Feed efficiency
An ANOVA analysis of feed efficiency showed no effect of MS, but a time effect (F = 216.7, df = 1.91, P = 9.4 × 10−91) and a MS by
time interaction (F = 8.85, df = 1.91, P = 1.86 × 10⁻⁴) (Figure 2C).
Feed efficiency decreased significantly over time in both groups (P < 0.001). After 12 weeks of the experimental diet, feed efficiency became higher in OP rats than in OR ones (P < 0.001).
Diurnal food intake
Food intake during the active and resting phases of the day (nocturnal and diurnal phases, respectively) was measured in each group (Figure 2D). An ANOVA analysis of diurnal values normalized on daily food intake revealed a significant effect of MS (F = 11.9, df = 1, P = 0.0005), no effect of time (F = 0.6, df = 1.49, P = 0.5) and an interaction (F = 6.52, df = 1.49, P = 0.0039). Diurnal food intake increased between the 1st and 12th weeks of the experimental diet in OP rats (P < 0.001), and was significantly higher in this group from the 6th week onward (P < 0.001). Olfactory-driven behaviors in OP rats were
disturbed
All olfactory-driven behavioral tests were performed during the rest-ing phase, and after the 11th week of the experimental diets, at a
Table 1. Primers for real-time quantitative PCR
Gene name Genbank accession number Primers
Ob-Ra AF304191.1 5′ TTTCCAAAAGAGAGCGGACAC 3′
5′ AGGTTGGTAGATTGGATTCATCTGT 3′
Ob-Rb AF287268.1 5′ AAAGCCTGAAACATTTGAGCATC 3′
5′ CCAGAAGAAGAGGACCAAATATCAC 3′ IR-A NM_017071.2 5′ CAGGCCATCCCGAAAGC 3′ 5′ GGTGTAGTGGCTGTCACATTGC 3′ IR-B NM_017071.2 5′ TTACCTGCACAACGTGGTTTTT 3′ 5′ CTCAGCACCATTGCCTGAAG 3′ GhsR NM_032075.3 5′ GTCTCATCGGGAGGAAGCTATG 3′ 5′ AGCAAACACCACCACAGCAAG 3′ SLC2a1 NM_138827.1 5′ GAGTGTACTGTGGCCTGACC 3′ 5′ GTCTAAGCCGAACACCTGGG 3′ SLC2a3 NM_017102.2 5′ GTCCAGGAGCCCATCTATGC 3′ 5′ GCTCCACCAGGAACAGAGAG 3′ SLC2a4 NM_012751.1 5′ CGTTGGTCTCGGTGCTCTTA 3′ 5′ ATCAAGATGGCACAGCCACA 3′ Bcl-2 NM_016993.1 5′ GACTGAGTACCTGAACCGGC 3′ 5′ AGTTCCACAAAGGCATCCCAG 3′ TNFalpha NM_012675.3 5′ GCCCACGTCGTAGCAAACCAC 3′ 5′CCATTGGCCAGGAGGGCGTT 3′ IL6 NM_012589.2 5′TCTCGAGCCCACCAGGAACGA 3′ 5′ ACTGGCTGGAAGTCTCTTGCGGA 3′ CD11c XM_006230382.1 5′ ACACTGTCATCAGCAGCCAC 3′ 5′ CCACACCGTTTCTCCCTTCA 3′ GR NM_012576.2 5′ CTCCAGTCAGAACTGGCAAC 3′ 5′ GATTCTCAACCACCTCATGC 3′ Cyclophilin-A NM_017101.1 5′ TTGCAGACGCCGCTGTCTCTT 3′ 5′ TGGAACTTTGTCTGCAAACAGCTCG 3′
time when acute weight growth was achieved and OP rats displayed higher feed efficiency and increased diurnal food intake.
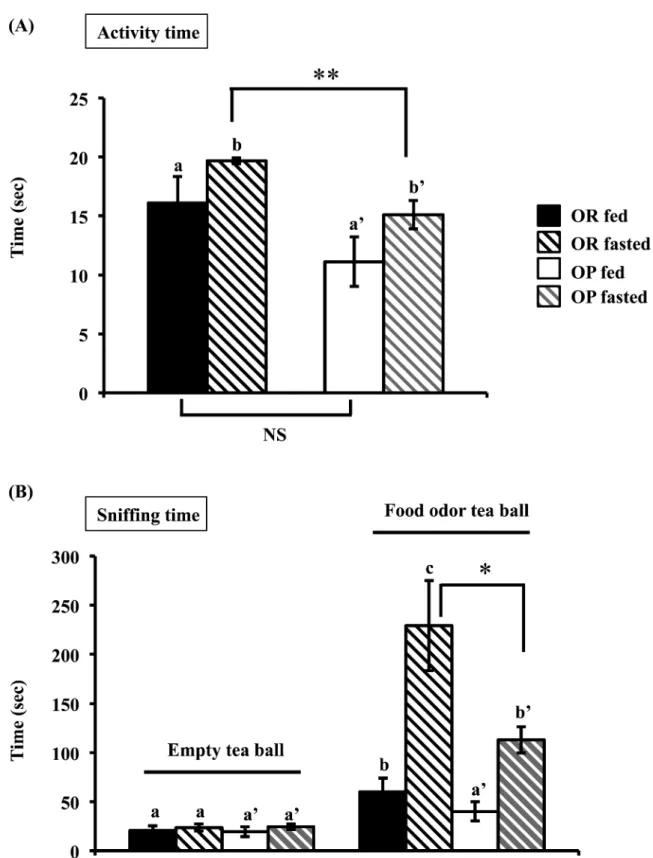
Tea-ball test
Eleven weeks after the introduction of both diets (rat’s mean weights, OR = 393 ± 8 g, OP = 611 ± 11 g), we evaluated the locomo-tor, grooming (activity time) and sniffing behaviors induced by intro-ducing a food odor into the rats’ environment (tea ball containing their own food pellets placed on top of the cage, as well as an empty, control tea ball) in the fed or fasted states (Figure 3). An ANOVA analysis of this activity time revealed a MS effect (F = 9.34, df = 1,
P = 0.002) and a fasting effect (F = 3.74, df = 1, P = 0.05) but no MS
by fasting interaction. The activity time was similar in OR and OP rats in the fed state. Fasting increased activity time in both cohorts, but post hoc tests showed that this effect was significantly less pro-nounced in OP rats (P < 0.01).
A global analysis of sniffing time using 3-way ANOVA revealed no MS effect, an odor effect (F = 107.35, df = 1, P = 3 × 10⁻²⁵), a
fast-ing effect (F = 15.51, df = 1, P = 8.2 × 10⁻⁵), and a fasting by odor
interaction (F = 10.28, df = 1, P = 0.013). Indeed, all the rats spent more time sniffing the food odor tea ball, and fasting increased this time. Sniffing times of the empty tea ball were very short and similar in OR and OP rats in both the fed and fasting states. Fed OR rats sniffed the food odor tea ball significantly more than the empty one (P < 0.01), which was not the case in fed OP rats (Figure 3B). If the sniffing times for the food odor tea ball were considered, then fast-ing significantly increased these times in both cohorts [ANOVA, no MS effect, a fasting effect (F = 59.27, df = 1, P = 1.37 × 10⁻¹⁴) and no
MS by fasting interaction]. However, post hoc test on fasted animals showed a MS effect as the increase of food odor sniffing was less pronounced in OP rats (P < 0.05).
Together, these data indicated that, in fed state, OP and OR rats displayed the same level of activity, but only OR rats increased their sniffing activity in presence of a food odor. In OP rats, such enhanced response was elicited after fasting.
Insulin tea-ball test
The tea-ball test was performed again during the 15th week of the diet (rat’s mean weights, OR= 434 ± 9 g, OP = 684 ± 12 g) after the administration of PBS or insulin (Figure 4). An ANOVA analysis of activity time revealed a MS effect (F = 4.92, df = 1, P = 0.026), an effect of insulin treatment (F = 8.74, df = 1, p = 0.003) and no interaction. Post hoc tests showed that under PBS, the activ-ity time was shorter in OP than in OR rats (P < 0.05) and that insulin treatment decreased activity time in OR rats (P < 0.05) but not in OP rats (Figure 4A). A 3-way ANOVA analysis of sniff-ing times (Figure 4B, left panel) showed no MS effect, an effect of food odor (F = 21.09, df = 1, P = 4 × 10⁻⁶) and of treatment
(insulin/PBS; F = 4.92, df = 1, P = 0.026), and MS by food odor and by treatment interactions (F = 4.26, df = 1, P = 0.04). The rats spent more time sniffing the food odor tea ball and insulin treat-ment modified this behavior. ANOVA analysis of the empty tea ball sniffing time revealed effects of MS and treatment (F = 8.54, df = 1, P = 0.003; F = 8.07, df = 1, P = 0.004, respectively) but no interaction. Insulin treatment shortened the sniffing time of the empty tea ball in OR rats (P = 0.054), but not in OP rats. The same analysis regarding the food odor tea ball showed only a MS by treatment interaction (F = 4.72, df = 1, P = 0.029). Indeed, total sniffing time varied markedly between animals in both cohorts; we therefore performed a further 3-way ANOVA analysis on sniffing times for each tea ball normalized on their respective total sniff-ing time. This analysis showed no MS effect (F = 0.001, df = 1,
P = 0.97), an odor effect (F = 16.56, df = 1, P = 4.7 × 10⁻⁵) and
no treatment effect (PBS/insulin) but a MS by odor interaction (F = 3.98, df = 1, P = 0.045) and a MS by odor and by treatment interaction (F = 5.81, df = 1, P = 0.016). Post hoc tests showed that an insulin injection modified the sniffing time of OR rats differen-tially for each ball, decreasing it for the empty one (P < 0.02) and increasing it for the food odor one (P < 0.05); this insulin effect was not observed in OP rats. All together these results indicated that an acute administration of insulin influences OR rat’s sniffing behavior but not OP ones.
Conditioned odor aversion test
The COA test was performed during the 22nd week of the experi-mental diet (rat’s mean weights, OR = 420 ± 8 g, OP = 665 ± 8 g) (Figure 5).
Pretest period
First we analyzed the weight of water drunk daily during the 5 min drinking session, from each bottle during the habituation week. ANOVA analysis showed a slight increase in the amount of water drunk during the habituation week (F = 4.44, df = 3.2, P = 0.002) but no effect of MS or bottle side, and no interactions between the 3 factors. So the animals were correctly trained to sample both bottles without any lateralization bias and independently of their MS.
The day following the COA establishment most of the rats did not drink 10−5 ISO during their 5 min drinking period. Only 3 rats in
each group drank from the ISO bottle, but less than 0.5 g of water, so we considered that ISO aversion was acquired.
After the installation of COA, the amount of water drunk by OP rats during the first 24 h of the 3-day recovery period (R1) was significantly lower than the one measured during the habituation period (OR: habituation, 7.04 ± 0.83 vs. R1, 6.98 ± 0.34 g; OP: habit-uation, 7.8 ± 0.34 vs. R1, 4.38 ± 0.36 g, P ≤ 0.01). The 2 following days (R2/R3) amount of water drunk returned to levels similar to
Table 2. Body composition and blood measurements at sacrifice
time
Measure Group (n)
OR (9) OP (10) Weight (g) 493.8 ± 11.80 757.53 ± 10.54** Liver weight (g) 15.75 ± 0.65 19.32 ± 0.72** Fat pads weights (g)
Epidydimal 0.51 ± 0.04 0.69 ± 0.05* Subcutaneous 4.7 ± 0.89 33.26 ± 1.74** Hormones/peptides/metabolites Glucose (g/L) 1.12 ± 0.03 1.46 ± 0.04** Insulin (ng/mL) 0.59 ± 0.22 1.41 ± 0.23* Leptin (ng/mL) 1.91 ± 0.23 9.81 ± 0.44** Triglycerides (g/L) 1.25 ± 0.14 5.67 ± 0.62** Adiponectin (mg/mL) 5.93 ± 0.91 15.33 ± 1.52** Ghrelin (ng/mL) Total 2.72 ± 0.32 0.99 ± 0.097** Acylated 1.16 ± 0. 21 0.31 ± 0.036** Nonacylated 1.56 ± 0.18 0.68 ± 0.07**
After 31 weeks of experimental diets rats were sacrificed. Body weight, liver and fat pads weights were recorded. Plasma levels for glucose, insulin, leptin, triglycerides, and ghrelin (total, acylated and nonacylated forms) were evalu-ated. Data were means ± SEM for n = 9 OR and n = 10 OP.
those observed during the habituation period (OR 8.52 ± 0.51; OP 7.9 ± 0.37 g).
Test period
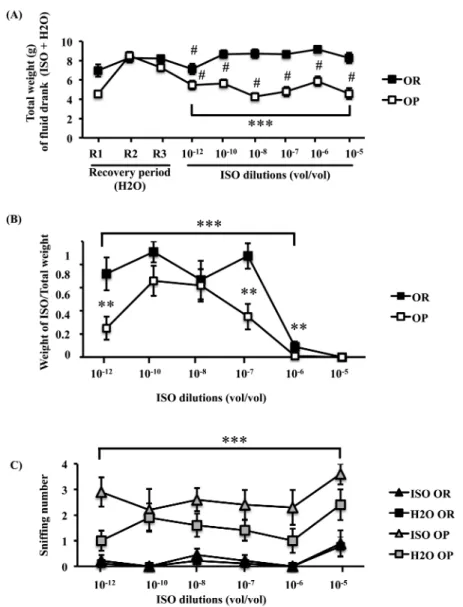
First, the total weight of water (nonodorized + odorized) drunk each day during the 5 min test session was analyzed. We observed that OP rats and to a lesser extent OR ones significantly lowered their fluid ingestion on the first day of the test period (Figure 5A; OR P ≤ 0.05; OP P ≤ 0.01). However, this decrease persisted on the remaining days only for OP rats. ANOVA analysis of the whole test period showed that from the first to the last days, OP rats drank sig-nificantly less than OR rats (Figure 5A; MS effect F = 59.43, df = 1,
P = 1.26 × 10⁻¹⁴, day effect F = 3, df = 3.36, P = 0.026 and MS by day
interaction F = 3.19, df = 3.36, P = 0.018) and that the total volume drunk decreased slightly but significantly over time. Consequently, for comparative analysis of ISO consumption between OP and OR rats, the weight of ISO drunk by each rat was normalized to the weight of the total water drunk (Figure 5B). ANOVA on these values revealed a MS effect (F = 15.24, df = 1, P = 9.44 × 10⁻⁵), an ISO
dilu-tion effect (F = 27.4, df = 2.67, P = 4.57 × 10⁻¹⁶) and no interaction
between the MS and ISO dilutions. Taking into account that ani-mals were placed under the ISO bottle to start the test, the behavior of OP and OR rats was very different. For OR rats, between 10−12
and 10−7 dilutions (vol/vol), mean ISO consumption accounted for
62% of the total fluid ingested. This proportion decreased steeply on 10−6 to 9%. For OP rats, ISO drunk at 10−12 represented only
Figure 2. Comparative feeding related parameters between OR and OP rats after 1, 6, and 12 weeks of experimental diet. (A and B) Food intake expressed as
grams by days and Kcalories by days, respectively. (C) Feed efficiency (g/day over Kcal/day). (D) Diurnal food intake as a % of 24 h food consumption. Data were means ± SEM for n = 9 OR and n = 10 OP, significant effects **P < 0.01, ***P < 0.001 OR versus OP; within cohorts values with different superscripts differ significantly (a ≠ b ≠ c for OR) and (a’ ≠ b’ ≠ c’ for OP).
25% of the fluid ingested. At 10−10, this proportion rose to 66%
and then, decreased progressively from 10−8 to 10−6 (62% to 1%,
respectively). Post hoc analysis showed that the difference between the proportions of ISO drunk by each groups was significant for the 10−12 and 10−7 (P ≤ 0.01) dilutions. At 10−6, 6 OR rats over 9
still drunk ISO when none of OP rats did. At 10−5 (vol/vol), no rat
drank ISO water.
At all ISO dilutions, OP rats displayed a higher sniffing activ-ity than OR rats (H2O + ISO bottles) (Figure 5C; ANOVA, MS effect F = 111.98, df = 1, P = 3.6 × 10⁻²⁶, with an ISO dilution effect
Figure 3. Effects of the introduction of an empty or food odor tea ball in rat’s environment on olfactory driven behaviors in fed or 24 h fasted OR and OP rats.
Comparison of (A) activity time and (B) sniffing time. Data were means ± SEM for n = 9 OR and n = 10 OP, *P < 0.05 **P < 0.01 OR versus OP; within cohorts values with different superscripts differ significantly (a ≠ b ≠ c for OR) and (a’ ≠ b’ for OP).
F = 4.39, df = 4.13, P = 0.002 and no interaction). In both cohorts,
this number increased with the 10−5 M aversive dilution. A 3-way
ANOVA of sniffing times for each bottle and in both cohorts revealed a MS effect (F = 140.4, df = 1, P = 2.17 × 10⁻³²), an ISO odor effect
(F = 15.96, df = 1, P = 6.4 × 10⁻⁵) an ISO dilution effect (F = 3.83,
df = 2.9, P = 0.0034) and a MS by ISO odor effect (F = 7.82, df = 1,
P = 0.005). For each ISO or H2O bottle, the number of sniff was
always higher for OP rats than for OR rats. OP rats sniffed the ISO bottle significantly more frequently than the H2O bottle, whereas
OR rats sniffed the 2 bottles the same number of times (ANOVA, no dilution effect, ISO odor effect F = 27.64, df = 1, P = 1.46 × 10⁻⁷ and
no interaction between dilution and ISO odor, Figure 5C). Hidden cookie test
After 27 weeks of the experimental diet (rat’s mean weights, OR = 483 ± 12 g, OP = 740 ± 9 g), we performed the hidden cookie test, this being considered as a general anosmia test (Figure 6). The odor source, an almond cookie, was buried under the bedding in the test cage. The time necessary for the rat to find the cookie was recorded twice a day (1 h interval, trial A and B) over a 4-day period. A 3-way ANOVA analysis of the retrieval times revealed effects of MS (F = 18.1, df = 1, P = 2 × 10⁻⁵), day (F = 61.49, df = 1,
P = 2.8 × 10⁻¹³) and trial order (F = 5.31, df = 1, P = 5.3 × 10⁻⁶),
and interactions between trial order by day (F = 14.74, df = 3,
P = 2 × 10⁻³), trial order by MS (F = 6.48, df = 3, P = 1.08 × 10⁻²)
and MS by day and trial order (F = 13.21, df = 3, P = 4 × 10⁻³).
Overall, OP rats were less successful than OR rats, as their retrieval times were longer. Over the 4 days, both OR and OP rats improved their performance, with marked differences depending on trial considered. We therefore compared within each cohort the daily evolution of retrieval times for each trial and then for each day, between trials A and B. In OR rats, ANOVA revealed a day effect (F = 28.06, df = 2.29, P = 1.8 × 10⁻¹⁴), a trial order effect (F = 13.97,
df = 1, P = 1.8 × 10⁻⁴) and a day by trial order interaction (F = 5.63,
df = 2.24, P = 0.0024). Their retrieval times were significantly shorter as from day 3 for trial A and from day 2 for trial B, when compared with day 1 (P < 0.05). They were more efficient in find-ing the cookie in trial B, the difference befind-ing significant on days 2 and 3 (P < 0.05). Among OP rats, the retrieval times were sig-nificantly shorter on day 4 only, for both trials (P < 0.05), and no differences were observed between the retrieval times for trial A and B (ANOVA, day effect F = 10.69, df = 2.29, P = 7.2 × 10⁻⁶,
trial order effect F = 2.74, df = 1, P = 0.09, and no day by trial interaction). A comparison of the performance of OP and OR rats showed that in trial A, OR rats were only more rapid on days 1 and 4 (P < 0.05); during trial B, OR rats were more rapid from day 2 onwards (P < 0.02). All together, these data showed that OP rats were less efficient to localize a hidden cookie by its odor. Furthermore, they moderately improved their performances during the 4 days of the test.
Figure 4. Influence of insulin IP administration on tea-ball test. (A) Activity time and (B) Sniffing time 30 min after PBS or insulin (INS) IP. Sniffing time was
expressed in seconds (left panel) or as a percent of total sniffing time (empty tea-ball + food-odor tea-ball). Data were means ± SEM for n = 9 OR and n = 10 OP, *P < 0.05; within cohorts values with different superscripts differ significantly (a ≠ b ≠ c for OR) and (a’ ≠ b’ for OP).
Figure 5. Influence of obesity on neutral odor sensitivity. (A) Total weight of fluid drunk during the two last recover days after COA installation before the test
period (R2 and R3, recovery period, 2 bottles of water) and for each ISO dilution along the test period (water + ISO). (B) Mean ratio between weight of ISO and total weight of fluid intake (water + ISO) for each ISO dilution. (C) Mean number of sniffing performed on each bottle during the 5 min drinking period. Data were means ± SEM for n = 9 OR and n = 10 OP; # R3 versus 10–12 dilution, P < 0.05 for OR rats and # R3 versus each dilution, P < 0.01 for OP rats; ***P < 0.001
OR versus OP over ISO dilutions; **P < 0.01 OR versus OP for each dilution.
Figure 6. Influence of obesity on general anosmia test (Hidden cookie test). Retrieval times to find a hidden cookie at each of the 4 days of test for OR (circles)
and OP (squares) rats were recorded. Test was performed as 2 trials of 5 min (trial A and B) at 1-h interval. Data were means ± SEM for n = 9 OR and n = 10 OP, ***P < 0.001 OR versus OP over days; *P < 0.05 OP versus OR day by day.
Levels of expression of metabolism-related factors were modified in the OM and OB of OP rats
Given that many metabolism-related factors modulate olfactory signal in both the OM and OB, and that our results highlight a potential con-tribution of insulin pathways in the modulation of olfactory-driven behaviors of OP rats, we investigated whether the expression of insu-lin receptors (IRs), as well as those of glucose and monocarboxylate transporters as other essential elements of energy uptake for neurons, were modified in OP rats, using qPCR and/or western blot analyses. Insulin receptors
Gene expression levels for IRs (short- IR-A and long-form IR-B in the OM and IR-A in the OB) were evaluated using qPCR, and the protein level was quantified by western blot analysis (Figure 7). qPCR showed that only IR-B mRNA was significantly decreased almost 4-fold in the OM of OP rats (∆Ct = 1.99; P < 0.001). Western blot analysis confirmed this decrease as being 2-fold in OP rats (P < 0.05). In the OB, transcript cod-ing for IR-A was slightly decreased by 1.9-fold (∆Ct = 0.93; P < 0.05) but this decrease was not found at the protein level by western blot analysis, probably because of the recognition of both isoforms by the IR antibody. Leptin receptors
qPCR analysis of both long (ObRb) and short (ObRa) mRNAs
showed no difference between OP and OR rats in the expression of leptin receptor transcripts in the OM and OB (data not shown). Monocarboxylate transporters
The expression levels of monocarboxylate transporters were evalu-ated by western blot analysis (Figure 8A). MCT1 was 1.8-fold less
expressed in the OM of OP rats (P < 0.05), but no difference was observed in the OB between the 2 cohorts. MCT2 did not vary in the OM but was increased in the OB of OP rats by 1.8-fold (P < 0.05). Glucose transporters
qPCR analysis of the expression of mRNA coding for glucose trans-porters 1, 3, and 4 (SLC2A1, 3, & 4 genes) showed that the levels of expression of GLUT 3 and 4 were significantly decreased in the OM of OP rats by 3.5- and 2.8-fold, respectively (P < 0.05) (Figure 8B). The level of expression of GLUT1 was unchanged. In the OB, we did not observe any modulation of gene expression for these 3 GLUTs (data not shown).
Preliminary investigation into the modulation of factors implicated in OM and OB cell dynamics
Because of the link between obesity and neurological chronic low-grade inflammation, apoptosis and neurodegeneration described in other tissues, we measured the levels of expression of cleaved cas-pases and Bcl-2 as markers of apoptosis and antiapoptosis, and glu-cocorticoid receptors as regulators of cell dynamics in the olfactory tissues from OP and OR rats.
In OP rats, the OM displayed a modulation of apoptosis-related factors
Cleaved caspases
Western blot analysis showed that although the total caspase 9 level was identical in the OM of OP and OR, the cleaved form was increased
Figure 7. Insulin-receptor expression is decreased in the olfactory tract of OP rats. (A and C) Quantification of mRNA coding for the long form of the
insulin receptor (IR) in the olfactory mucosa (OM) and for the short form in the bulb (OB) of OR and OP rats. Results are expressed as ∆Ct relative to the
cyclophilin A reference gene. (B and D) Western blot analysis of the level of expression of the insulin receptor in the OM and OB of OR and OP rats. Liver (L) was used as a control. Values are normalized to β-actin (AU arbitrary unit). Data were means ± SEM for n = 9 OR and n = 10 OP. *P < 0.05 OR versus OP.
by 25-fold in the OM of OP rats (P < 0.01) (Figure 9A). Cleaved forms of caspase 3 (17 and 19 kDa) were also markedly increased (by 35- and 23-fold, respectively) in this tissue (P < 0.01). The expression lev-els of the cleaved forms of both caspases were low in the OB. Western analysis of caspase 9 and cleaved caspase 9 did not show a difference between both cohorts. Level of cleaved caspase 3 was too low, making accurate quantification impossible (data not shown).
Bcl-2
qPCR analysis of the OM and OB showed that Bcl-2 was slightly decreased by 0.5-fold in the OM (P = 0.05) but not in the OB of OP rats (Figure 9B).
Obese rats displayed a decreased expression of glucocorticoid receptors in the OM
The level of GR expression in the OM evaluated by qPCR showed a slight, 2-fold decrease (P = 0.046) in OP rats (Figure 10). Analysis with western blot strengthened this finding, with a 3-fold reduction in the level of this protein in the mucosa (P < 0.05). In the OB, no
variations were observed between OP and OR rats using western blot analysis, even though there was a slight down-regulation (2.5-fold; P = 0.057) for the GR receptor in OP rats (qPCR analysis).
Discussion
The present study provides a new contribution on the influence of an obesity state on the olfactory function and associated behaviors, using a rat model that mimics the complex surroundings encoun-tered in humans, that is, a polygenetic predisposition compounded by environmental factors. Such a long-lasting metabolic perturbation severely modulates several factors implicated in the cellular dynamics and in the odorant signal coding in the OM and for a lesser extent in the OB: OP rats displayed decreased expression of insulin and glu-cocorticoid receptors, reinforced by increased and decreased levels of apoptotic and antiapoptotic factors, respectively. Furthermore we demonstrated for the first time that the expression of glucose/ monocarboxylate transporters was modified by the obesogenic sta-tus, strongly suggesting that glucose/lactate/ketone bodies cellular Figure 8. Level of expression of monocarboxylate and glucose transporters in the olfactory mucosa and bulb of OP rats is modified. (A) Western blot analysis
of the expression of MCT1 and MCT2 in the olfactory mucosa (OM) and bulb (OB) of OR and OP rats. Values are normalized to β-tubulin (AU arbitrary unit). (B) Quantification of mRNA coding for glucose transporters 1, 3, and 4 (SLC2a1, SLC2a3, SLC2a4) in the OM and OB of OR and OP rats. Results are expressed as ∆Ct relative to the cyclophilin A reference gene. Data were means ± SEM. Significant effects *P < 0.05 OR versus OP.
exchanges might be perturbed in olfactory tissues. These major cel-lular modifications observed at the 2 first steps of odor coding in obese rats were associated with modified olfactory behaviors. Obese animals displayed increased neutral odor sensitivity but low sniffing activity toward food odors, poor ability to localize them and poor capacities to learn olfactory driven behaviors. We also showed for the first time that fasting has a decreased influence on animal’s motivation to localize their usual food odor and that an insulin surge (mimicking a preprandial surge) fails to increase their food-odor sniffing activity. These last data reflect a decreased insulin sensibility of the olfactory function in obese rats that might participate in the increased food intake that we observed during the resting phase for these animals. OP rats fed with a high fat diet displayed a
characteristic obesity profile
We chose to work on clear-cut “lean” and “obese” metabolic sta-tuses, which are pertinent in regard to the situation encountered in
humans, where genetic susceptibility is juxtaposed on food-related behaviors modification in obese people. This protocol was designed to evaluate the olfactory function of obese animals but does not allow to assess the respective contribution of the DIO per se and of the obesity state, a question that remains to be investigated. As expected, our results clearly showed that OP rats displayed a char-acteristic profile of obesity: high weight gain, increased liver and fat mass, hyper-leptinemia, -insulinemia, -triglyceridemia, and -glycemia, decreased level of ghrelin (acylated and nonacylated) and insulin-resistance. They were hyperphagic and displayed significantly higher feed efficiency as already observed (Schemmel et al. 1970; Ji et al. 2005). Interestingly, their food intake pattern changed from the 6th week of the high fat diet on, with increased food intake during their resting period (day time), an important observation in the context of the known meal pattern deregulation in obese rodents models and of the night-time binge eating episodes frequently observed in obese people (Kohsaka and Bass 2007; Milano et al. 2012). Associated Figure 9. Apoptosis level is increased in the olfactory mucosa of OP rats. (A) Western blot analysis of the cleaved forms of caspases 9 and 3 in the olfactory
mucosa (OM) and of cleaved caspase 9 in OB of OR and OP rats. Values are normalized to β-actin (AU arbitrary unit). (B) Quantification of mRNA coding for the antiapoptotic factor Bcl-2 in the OM and OB of OR and OP rats. Results are expressed as ∆Ct relative to the cyclophilin A reference gene. Data were means ± SEM
to food intake rhythm, the way the food is consumed (many small meals or few large ones) is also important in weight gain and body fat accumulation (Parks and McCrory 2005).
Such a model reinforces other studies showing both molecular and behavioral consequences of a long-lasting modulation of cir-culating metabolic-related factors, known to influence odor signal-ing through the modulation of olfactory neurons’ electrical activity and/or of mitral cells excitability and of olfactory behaviors through the modulation of odor threshold and sniffing activity ( Palouzier-Paulignan et al. 2012).
Insulin receptor expression was decreased in the OM and OB of OP rats
In association with the large modulations of metabolic hormones or circulating levels of peptides, we observed a decrease of the insu-lin receptor level in the OM and to a less extent in the OB of OP rats, whereas gene expression of the leptin receptors, another main anorexigenic receptor widely expressed in olfactory tissues, was not modified. It has become clear that, due to the short- and long-term pleiotropic roles of insulin in olfactory tissues, the modulation of the anorexigenic insulin pathway in olfactory tissues might have several consequences both at the short- and long-term. Insulin influ-ences odor coding, increasing olfactory sensitivity (Aimé et al. 2012), decreasing the amplitude of electrical response of the OM olfactory neurons (Lacroix et al. 2008) and increasing the mitral cells electri-cal activity in the OB (Fadool et al. 2011). In the long term, it is also
involved in OM renewal through an antiapoptotic effect (Lacroix et al. 2011). Therefore, the down-regulation of the insulin receptor in olfactory tissues, together with the insulin-resistance, probably largely contributes to the behavioral and molecular observations in this study, such as the insulin insensitivity of OP rats olfactory behavior, or the modulation of cell dynamic markers within the OM. However, more investigations are needed to evaluate the functional-ity of the insulin transduction cascade, as well as the one of leptin, in the OM and OB of obese animals in regard to the insulin- and leptin-resistance observed in obesity to conclude on a major role of insulin impairment in our observations.
Other factors implicated in OM and OB cell dynamics were affected in obese animals
Obesity is characterized by chronic, low-grade inflammation affect-ing metabolism-related tissues (adipose tissue, liver, skeletal mus-cle, and hypothalamus) leading to the production of inflammatory adipokines and the recruitment of inflammatory macrophages (Odegaard and Chawla 2013). Increased levels of apoptotic proteins are also observed in these tissues (Pintus et al. 2012). Accordingly, we found a major increase in proapoptotic factors together with a decrease in antiapoptotic ones in the OM of OP rats, but not in their OB, suggesting that the MS affects the first level of odor percep-tion. Such enhanced apoptotic status is probably reinforced by 1) the insulin resistance and insulin receptor down-regulation impeding the long-term antiapoptotic effect of insulin (Lacroix et al. 2011) and Figure 10. Glucocorticoid receptor level is decreased in the olfactory mucosa of OP rats. (A and C) Quantification of mRNA coding for the Glucocorticoid receptor
(GR) in the OM and OB of OR and OP rats. Results are expressed as ∆Ct relative to the cyclophilin A reference gene. (B and D) Western blot analysis of the GR in
the OM and OB of OR and OP rats. Liver (L) was used as a control. Values are normalized to cyclophilin A (AU arbitrary unit). Data were means ± SEM for n = 9 OR and n = 10 OP. *P < 0.05 OR versus OP.
2) a decreased antiapoptotic influence of ghrelin due to its low circu-lating level (Delhanty et al. 2012).
A link between apoptosis and inflammation has been also recently reported in OM of obese mice fed with a moderate high-fat diet, where a significant increase in activated caspase-3 was paral-leled with an increased expression of Iba-1 suggesting an augmenta-tion of proinflammatory cells (Thiebaud et al. 2014). In contrast, we did not observe any variations in the expression of common inflammatory markers (TNFα, IL-6) and inflammatory macrophage markers (CD11c) in the OM and OB of OP rats, suggesting that inflammatory processes are not involved here (data not shown). Interestingly, we also found a decreased expression of glucocorticoid receptors (GR) in the OM of obese rats, reinforcing the hypothesis of a perturbed kinetic of OM renewal. Indeed, GRs are function-ally expressed in mature olfactory neurons and sustentacular cells (Robinson et al. 1998; Takanosawa et al. 2009) and corticosteroids are implicated in the cell dynamics of the OM, inducing the apopto-sis of mature olfactory neurons and then an activation of basal cells proliferation (Takanosawa et al. 2004, 2009).
Considering these data, we propose that decreased levels of insu-lin and glucocorticoid receptors could influence the OM renewal by decreasing basal cell proliferation and mature neuron apop-tosis, leading to fewer new neurons being generated and a slower renewal of mature neurons. Such neuronal remodeling, which has been reported in the hypothalamic arcuate nucleus of obese mice (McNay et al. 2012) would probably modify the olfactory signal, a parameter that has not been recorded in our study. In mice fed with high fat diet, Thiebaud et al. effectively reported a reduction of the electro-olfactogram (EOG) amplitude associated to a massive olfac-tory neuronal loss (Thiebaud et al. 2014).
Factors implicated in OM and OB glucose/lactate/ketone bodies transport were affected in obese animals
Interestingly, we found that the expression of GLUT and MCT iso-forms in the OM, and of one MCT isoform in the OB, were modu-lated by long-term metabolic disregulation, thus probably affecting the delivery of both glucose and monocarboxylic acids to neurons. These transporters are involved in metabolic exchanges in the brain between astrocytes and neurons (Benarroch 2014). GLUTs and MCTs have now been described in various cell types in the OM, including olfactory neurons, sustentacular cells, Bowman’s gland, whereas GLUT1, 3, and 4 have been reported in the OB, where mitral cells are gluco-sensing neurons (see review Palouzier-Paulignan et al. 2012; Tucker et al. 2013). The expression of GLUT3 and 4 genes was clearly decreased in the OM of OP rats, but not in the OB. In the OM, GLUT3 is considered to play an essential role in regulating the glycemic environment of olfactory neurons through glucose uptake and lactate release by sustentacular cells in the intercellular space and mucus. Direct glucose uptake at the olfactory neurons’ dendrite level through GLUT3 has also been suggested (Nunez-Parra et al. 2011). Consequently, its decreased level in OP rats would probably affect neurons’ functions. The expression of GLUT4 in the OM that we demonstrated here and its down-regulation is of particular interest, as it is an insulin-responsive glucose transporter whose role in obe-sity and insulin resistance has been suggested (Lumeng et al. 2007;
Karnieli and Armoni 2008). We propose that insulin-stimulated glu-cose uptake by OM cells, including neurons, is impaired in the OM of OP rats, thus participating in the development or maintenance of insulin resistance in this tissue. The resulting decreased uptake of glucose by OM cells could also be part of an adaptive response in regard to the high level of circulating glucose. At the OB level, we
found no modification in the expression of the three investigated GLUTs, even if we cannot exclude a modulation of glucose uptake through the involvement of other types of glucose transporters, such as the sodium-coupled glucose transporter 1, recently reported as being increased in the OB of obese Zucker rats (Aimé et al. 2014). Concerning lactate/ketone bodies uptake, we showed that MCTs were not only expressed in the OM but also in the OB and that, in OP rats, they were differentially regulated: MCT1 was decreased only in OM and MCT2 increased only in OB. Interestingly, Pierre et al. (2007) reported enhanced MCT1 and MCT2 expression in different brain areas of obese mice including those depleted for the leptin pathway, making insulin as a good candidate to mediate changes in neuronal MCT expression. It is likely that perturbation of the glucose/lactate/ketone bodies’ transport would modify energy exchanges between sustentacular cells/olfactory neurons in the OM and astrocytes/neurons in the OB of OP rats. In this context, recent data reported a 2-fold increase in glucose concentration in the extra-cellular fluid in the OB of obese Zucker rats (Aimé et al. 2014). Overall, these data suggest a differential influence of the MS status on glucose/lactate sensing and exchange in the OM and OB. Influence of obesity status on olfactory-driven behaviors
Associated to alteration in glucose transport, metabolism and apop-tosis affecting OM and to a lesser extent OB integrity and functions, we observed modifications of the OP rats’ olfactory driven behav-iors. Using 3 different behavioral tests performed at different life periods, we showed that despite an increased sensitivity to neutral odor, obese rats displayed decreased sniffing activity for food odor and less efficiency to localize a palatable hidden cookie.
Obesity did not influence the activity level of rats
In satiated state, OP and OR rats displayed a comparable level of loco-motor or grooming activity when their usual food odor was introduced in their environment (tea-ball test). In a previous study, Perez-Leighton et al. (2012) reported reduced spontaneous physical activity of obese rats during the dark phase. Our tests were done during the light phase a contextual difference already pointed out in light- and dark-phases locomotor activities time in MC4R-null obese mice (Tucker et al. 2008).
OP rats displayed increased neutral odor sensitivity
The first day of the COA test period, for 10−12 dilution, OP and OR
rats decreased their total amount of fluid ingested, strongly suggest-ing that they both perceived ISO. However, the aversive response of OP rats was stronger as OP rats drunk significantly less ISO than water which was not the case of OR rats. This difference in drink-ing avoidance behavior strongly suggests a better perception of a neutral odor in OP rats. But it could also result from an increased anxiety level (Souza et al. 2007) or a stronger odor aversion mem-ory (Boitard et al. 2015) as already reported in obese rats. On the next 2 days, both groups increased their ISO consumption, which could be explained by a partial extinction process as the previous ingestion of 10−12 dilution did not lead to any malaise. However,
with decreasing ISO dilutions, OP rats displayed again an odorized water aversion earlier than OR rats, from 10−7 dilution as compared
with 10−6 dilution. At 10−5 dilution, all rats drunk exclusively water,
attesting of the maintenance of the ISO aversion through the test period. These results indicate that, if both groups of rats remem-bered the initial ISO dilution associated with the gastric malaise, OP rats were more affected by the aversive conditioning and exhibited lower odor threshold for non-food odor. The increased odor sensi-tivity displayed by OP rats is associated to a high sniffing acsensi-tivity


![[PDF] Introduction àla méthode d'analyse et conception Merise PDF - Cours Merise](data:image/gif;base64,R0lGODlhAQABAIAAAP///wAAACH5BAEAAAAALAAAAAABAAEAAAICRAEAOw==)