Printed in Great Britain
The syndrome concept: history and statistical
operationalizations
ADRIAN C. WEBER1 AND CHRISTIAN SCHARFETTER
From the Research Department of the Psychiatrische Universitdtsklinik, Zurich, Switzerland
SYNOPSIS A historical analysis of the syndrome concept shows that this term has been used in many different ways, ranging from clinical experience to records of coinciding symptoms. However, there seems to be broad agreement on the use of the word 'syndrome' in daily practice. If empirical-mathematical methods are applied in syndrome detection, however, a precise operation-alization of the syndrome concept is needed. Traditional procedures have often used models more dictated by methodological considerations than derived from the field of application, i.e. psychiatric syndromatology. An alternative approach, Boolean factor analysis, is presented in this paper. This relatively new method is illustrated by means of the analysis of a small artificial sample with a known structure. As a point of reference, traditional methods (factor analysis, cluster analysis, and multidimensional scaling) are also briefly discussed. It is demonstrated that they all share a deficiency of information about inter-group structure. In contrast, Boolean factor analysis uses a syndromic definition which builds on the basic notion of concurrent symptoms. Moreover, this approach can easily be understood by clinicians.
1. HISTORY
Psychiatric nosology as reflected today by the International Classification of Diseases (ICD) (WHO, 1978) and other diagnostic systems should be based on a hypothetical entity of phenomenology (psychopathology), causation (aetiology), development (pathogenesis), course, outcome (possibly also treatment response), and morphological and/or physiological somatic grounds (neuropathology, pathophysiology). The realization of such an ideal nosology, however, is still out of reach so that the evaluation of syndromes becomes still more important. The search for such combinations of symptoms originates from Hippocrates, who attempted to find syndromes which would form typical clinical pictures of a disorder. 'Typos'. (Greek) means 'Gestalt' or, more strictly, the picture, the imagination of a Gestalt.
Kahlbaum (1874) collected the most fre-quently coincident symptoms, thus con-structing syndromes or types of disorders (' Krankheitsgestaltungen'). By so doing, he was able to define catatonia and hebephrenia (the 1 Address for correspondence: Dr Adrian C. Weber, Research
Department, Psychiatrische Universitatsklinik, Postfach 68, CH 8029, Zurich 8, Switzerland.
latter was well described by his pupil Hecker, 1871). Paranoia, the primary insanity of Snell (1865), is another branch of the same tree. This typology of mental illness became the basis of Kraepelin's nosology and, later on, of those of Eugen Bleuler, Kurt Schneider, and the modern classification of the World Health Organization (ICD).
Kleist, and later Leonhard, attempted to differentiate clinically observed syndromes by correlating them with localized brain dys-functions and specific hereditary traits - thus producing a syndromatology rather than the intended nosology. Bonhoeffer (1910) correlated his concept of the acute exogenic reaction type with acute brain disorders of various types, but kept strictly to syndromatological research. This was exactly what Hoche (1912) postulated when he suggested that the search for symptom 'complexes' be improved. Later, Carl Schneider (1942) attempted to construct specific schizo-phrenic symptom combinations. All these attempts to generate syndromes were built on no more than clinical experience. The first attempt to establish a syndromatology based on empirical material was undertaken by Lorr et al. (1963).
The criteria used for the construction of syndromes by various authors are quite different -for example, disordered psychological functions (consciousness, memory, orientation, mood, etc.), or correlations of clinical phenomena with supposed somatic disorders (psycho-organic, local brain, endocrine psychosyndrome, brain syndrome), or psychotraumatic life experience (psychogenic disorder). Another approach has been the construction of axis-syndromes (Berner, 1977), according to a previously defined nosolo-gical concept (organic v. endogenomorphic, i.e. schizophrenic and cyclothymic).
In clinical experience the formation of syn-dromes is a Gestalt-psychological process which has its origin in the patient (as the producer), in the interviewer (the symptom-investigator), and in their mutual interactions. The observer brings to the process a set of personal, familial, cultural and professional norms and values, with internalized textbook-patterns of abnormal, even pathognomonic, behaviour and with standards of interaction with a patient. He may not only find the symptoms he is searching for, but also complete them to create syndromes according to his tendency to create a 'Gestalt' which was in his mind beforehand, i.e. symptoms may not merely be produced by the patient, but can represent the interaction between the patient and the environment induced by the professional interviewer. The same mechanisms apply even more to the construction of a syndrome which is essentially the creation of the psychiatrist, reflecting his interaction with the patient, the patient's expression of his needs, and the psychiatrist's intention to form clinical types and build up a psychopathological Gestalt.
Interview training, symptom checklists, opera-tionalizations of definitions, and standardized diagnostic procedures can only in part correct the specialist's influence on the process of shaping a psychopathological type. We must bear this fact in mind when attempting to simulate the clinical process of syndrome construction by empirical methods. The combin-ation of items representing a person's character-istic pattern of experience and behaviour is here evaluated by means of mathematical techniques for pattern recognition.
2. THE SYNDROME CONCEPT IN THE CONTEXT OF EMPIRICAL STUDIES Introduction
The preceding historical analysis shows that the term' syndrome' has been used in many different ways. Yet though the definition of the term 'syndrome' rarely takes up more than a few lines in psychiatric textbooks, the word does not lead to much confusion in daily practice.
If electronic data processing is to be employed, however, a precise operational definition is required. The exact definition of a term whose use was previously vague often becomes necessary during the process of formalizing a scientific discipline. The strictly logical structure of computers renders this process obligatory. Before undertaking data analysis, a considerable amount of theoretical work must be carried out and fitted closely with the psychiatric termin-ology. As with Artificial Intelligence, the study of language calls for an understanding of computers and their capacities. To write computer programs to comprehend natural language we are obliged to study language itself in some depth. To construct a machine which is able to understand human speech one must first become a linguist. One part of contemporary psychiatry deals with the analysis of large data sets with the aim of detecting natural 'syndromes'. The data base normally consists of lists of symptoms presented by large numbers of patients. The answers of each individual to a number of questions on his symptoms are registered in a standardized way. The so-called raw data table consists of the subjects' coded symptom scores on all the questions. The task of the data analyst is then to identify syndrome structures which may be hidden in the raw data table. We will call this procedure 'Automatic Syndrome Detection' (ASD).
Automatic syndrome detection (ASD)
In ASD two interdependent problems have to be solved simultaneously:
(1) the establishment of a well-defined syn-drome concept which serves as a target structure to which the data are fitted;
(2) the identification of a data-analytical procedure which is appropriate to the task. Such a procedure belongs to the wider field of
pattern recognition which we cannot discuss further here.
As mentioned above, points (1) and (2) are closely related. Certain data-analytical pro-cedures are flexible, allowing for a variety of syndrome concepts to be embedded in their algorithms. Others are tied conclusively to one model. Often, very little attention is paid to point (1). M ultivariate statistical procedures are widely used, without an awareness of the kind of syndromic concept being employed. In most cases, consideration is given only to one formal property of syndromes, namely the fact that they are composed of groups of symptoms. Any statistical procedure imposing a group structure on the data is then usually applied, regardless of the respective grouping rule. Three procedures are most frequently used: factor analysis (FA), cluster analysis (CA), and multidimensional scaling (MDS).
In the present paper we shall discuss the role played by some of these methods in ASD without going into the mathematical details. In particular, we are concerned with some basic properties of the syndromic concepts they employ. We shall also present a relatively new procedure, called Boolean factor analysis, as an alternative approach.
The detection of syndromes by computer
It has already been mentioned that syndromes formally comprise groups of symptoms. This is the most trivial property of any syndrome concept. What is the underlying principle which allows a certain number of symptoms to be called a 'syndrome'?
In medical terms it is, of course, the pathological process which causes the symptoms to appear. In many somatic diseases this process is well understood and a causal law can be established. In psychiatry, however, all that we can perceive is the concurrence of certain symptoms on a superficial level. In general, the underlying processes cannot be observed. Certain symptoms appear simultaneously and, when such regularities are repeatedly observed in many patients, we are inclined to assume a common origin and to call the relevant symptoms a 'syndrome'.
The statistical procedures to be discussed below do something quite different from simply
looking for groups of concurrent symptoms. Sometimes they use quite sophisticated models taken, for example, from Psychological Test Theory which expand the syndrome concept unnecessarily. In our view an expansion of the syndrome concept is frequently dictated only by the method used and does not correspond to any theoretical concepts in psychiatry. We find the concurrence of symptoms to constitute a satisfactory rule for the detection of syndromes and we present here a method especially appropriate for the identification of such structures.
Boolean factor analysis: a simple syndrome concept and its corresponding algorithm
Boolean factor analysis (BOOLE-FA) makes direct use of raw data. No similarity matrices are involved. We first encountered this method in the 1981 version of the BMDP Statistical Software Package.1 The method is based on research conducted by Engelmann et al. (1982) and the algorithm is described in the BMDP-81 manual. Based on this description, one of us (A.C.W.) wrote a FORTRAN-IV program to perform BOOLE-FA which at the same time has considerably extended the original program (see below).
Boolean algebra is a mathematical discipline dealing with set-theoretical operations, such as 'intersection' and 'union'. The second part of the name refers to a formal similarity in the way in which the raw data table can be decomposed into a 'loadings' and a 'scores' matrix. The operation used in this formula is of Boolean type. Apart from this formal analogy, which accounts for the similar names given to some resulting quantities, BOOLE-FA and FA have very little in common.
An introductory example
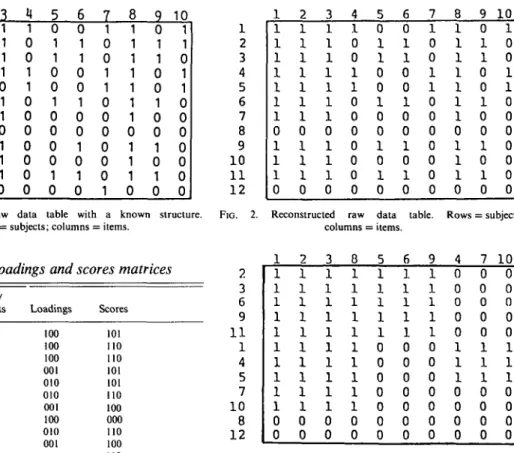
Before going into technical details, we introduce BOOLE-FA by showing its effect on a simple artificial raw data table (Fig. I).2 This table is dichotomous, i.e. there are only two response categories, ' 1 ' for yes and ' 0 ' for no. Missing
1 Department of Biomathematics, University of California, Los
Angeles.
2 All figures containing raw data tables are printed in condensed
format and not in tabulated form in order to allow for immediate visual pattern recognition. In every case rows correspond to subjects and columns to items.
8 9 10 1 1 1 1 1 1 1 1 0 1 1 1 0 2 1 1 1 1 1 1 1 0 1 1 1 0 3 1 1 1 1 1 1 1 0 1 1 1 0 4 1 0 0 1 1 0 0 0 0 0 0 0 5 0 1 1 0 0 1 0 0 1 0 1 0 6 0 1 1 0 0 1 0 0 1 0 1 0 7 1 0 0 1 1 0 0 0 0 0 0 0 8 1 1 1 1 1 1 1 0 1 1 1 0 9 0 1 1 0 0 1 0 0 1 0 1 0 10 1 0 0 1 1 0 0 0 0 0 0 0 FIG. 1. Artificial raw data table with a known structure.
Rows = subjects; columns = items.
1 2 3 4 5 6 7 8 9 10 1 1 12
FIG. 2. Reconstructed raw data table. Rows = subjects; columns = items.
Table 1. Loadings and scores matrices
Items/
subjects Loadings Scores
1 2 3 4 5 6 7 8 9 10 11 12 100 100 100 001 010 010 001 100 010 001 101 110 110 101 101 110 100 000 no 100 no 000
data are also allowed, but will not be discussed here.
First, we have to provide the program with a parameter denoting the number of 'factors'. In our example we used the value 3. (The role of the 'factors' is explained below.) The program then produces two lists, one called 'loadings' and one called 'scores' (Table 1). The rows of the table of loadings correspond to the items; the rows of the table of scores correspond to the subjects of the raw data. In both lists the columns correspond to the 'factors'.
What is the meaning of this decomposition? The easiest way to clarify the role of the 'factors' is to regard them as boxes. There are three boxes in this example. The loadings indicate how to distribute the items into the three boxes. If the loading of an item on a factor is ' 1', the item is put inside the box; otherwise, it is not. In this example, the distribution runs as follows:
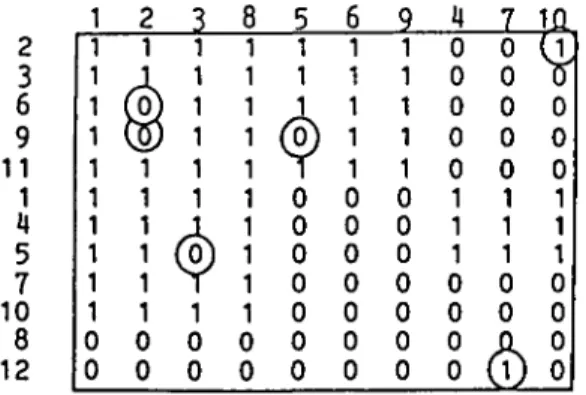
Box 1: Items 1, 2, 3, 8. Box 2: Items 5,6, 9. Box 3: Items 4, 7, 10. 1 1 1 1 1 1 1 1 1 1 1 0 0 2 1 1 1 1 1 1 1 1 1 1 0 0 3 1 1 1 1 1 1 1 1 1 1 0 0 8 1 1 1 1 1 1 1 1 1 1 0 0 5 1 1 1 1 1 0 0 0 0 0 0 0 6 1 r-l 1 1 1 0 0 0 0 0 0 0 9 1 1 •H 1 1 0 0 0 0 0 0 0 4 0 0 0 0 0 1 1 1 0 0 0 0 7 0 0 0 0 0 1 1 1 0 0 0 0 10 0 0 0 0 0 1 1 1 0 0 0 0 2 3 6 9 1 1 1 4 5 7 10 8 12
FIG. 3. Reconstructed raw data table rearranged. Rows = subjects; columns = items.
The table of scores then determines the distribution of those boxes to the subjects following the same rule, which yields:
Box 1: to subjects 1, 2, 3, 4, 5, 6, 7, 9, 10, 11. Box 2: to subjects 2, 3, 6, 9, 11.
Box 3: to subjects 1, 4, 5.
It should be noted that the subjects can be ascribed to more than one box. The same thing can happen with the loadings, but in the example given this is not the case.
With the help of these rules, we can construct a table of the same dimensions as the original raw data. We shall call this table the 'reconstructed raw data table' (Fig. 2).
The value of the procedure becomes evident immediately after the next step. The list of loadings and the list of scores allow us to rearrange both items and subjects according to their factor patterns. The sorting is done in such a way that elements with equal factor patterns are kept together. Fig. 3 shows the result of the rearrangement when applied to the reconstructed raw data table. The hidden structure of the raw
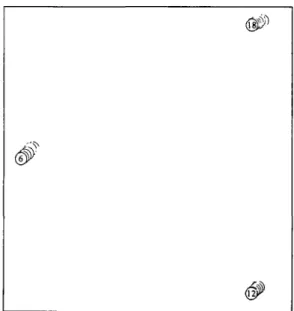
FIG. 4. Schematic representation or the block structure. 2 3 6 9 11 1 U 5 7 10 8 12
FIG. 5. Original raw data rearranged. Discrepancies to block structure model encircled. Rows = subjects; columns = items.
data is here made visible. The rearrangement results in a table composed of blocks of zeros and ones. Fig. 4 shows this structure schematically. The passage from a total of 10 items to a model with only 3 'boxes' necessarily results in a reduction of information and brings about a certain number of discrepancies compared with the raw data. Therefore, Fig. 3 has to be compared with a table of the original data rearranged in the same way (Fig. 5; discrepancies encircled). It can be seen that the raw data (Table 1) almost fit the model shown in Fig. 4.
There is, of course, no unique method of rearranging the data in order to reveal the block structure. The structure can be shown in different ways by rearranging entire blocks. The result depends on the rule that governs the sorting of items and subjects. We use the following algorithm. Each factor pattern, such as '110' or '010', can be regarded as a binary number (' 110' = 6; '010' = 2), ranging from 0 to 2m — 1, with m denoting the number of factors.
We now simply rearrange subjects and items in descending order of the corresponding binary values.1 This leads to a representation of the data where the number of positive responses roughly decreases from left to right and from top to bottom. Other ways of rearranging the data would be equivalent, as long as the members of a block are kept together correctly.
The algorithm
In a fashion formally analogous to factor analysis the raw data matrix A'is decomposed as:
X=S*L + E,
where X = (xi}) is an n x m matrix, S = (sir) is the nxp matrix of factor scores, L = (lir) is the
mxp matrix of loadings, E = {el}) is the m x n matrix of residuals, n is the number of subjects,
m is the number of items, and p is the number of
factors. ' *' denotes the following operation:
(S*L)i} = 1 if for at least one factor r
. ( r = 1, ...,p)sir= 1 a n d / ,r= 1;
= 0 otherwise.
The algorithm tries to solve for a pair S, L which maximizes the number of zeros in E, i.e. it minimizes the number of discrepancies from the raw data. Starting with an arbitrary or read-in loadings matrix L, a double phase algorithm calculates, in turn, the optimal S for fixed L, and the optimal L for fixed S, using 'Boolean regression'. In order to explain Boolean regres-sion we may consider the case of the calculation of a new row k of L for given X and fixed S.
(1) All lkr (r = 1, ...,p) are set to zero. (2) For every column r of (sir), an index Mr is computed:
Mr = -'Z (1 -xik)sir. I
(3) The column r* containing the largest Mr is determined.
(4) If Mr* is positive lkrif is set to one, and all entries of column k of X and of row i of S are set to zero if and only if sir contains a one.
Steps 2, 3 and 4 are repeated until the largest
Mr is non-positive. The optimization of S takes place in the same way with the roles of L and 5 interchanged. After three cycles of double-phase iterations, the current number of factors p is either decreased or increased by one, following
1 The sorting option is one of our extensions of the original
a 'three step forward, one step backward' rule until the desired p is reached. For a detailed description of this process, the reader is referred to the BMDP-81 manual.
Step 3 contains a typical problem of integer arithmetic. If the maximum of Mr(r = 1, ..., p) is not unique, the selection of r* is arbitrary. An optimal solution S, L may then be missed.
The syndrome model of BOOLE-FA
What is the possible contribution of BOOLE-FA to ASD? It is our opinion that the blocks of BOOLE-FA form an appropriate operationaliz-ation of the syndrome concept as it is employed in psychiatric textbooks and used in daily practice. The concept of a block simultaneously fulfils the basic requirements of a syndrome concept and does not overload it. Syndromes are conceptualized as concurrent symptoms, and the subjects of the sample are either allocated a syndrome or they are not. There is no need to expand the meaning of the term 'syndrome' by introducing the notion of continuity and scales. A rearranged raw data table exhibiting a block structure is also comprehensible to a clinician with no knowledge of advanced statistics.
Traditional algorithms
When BOOLE-FA is compared with the well-known 'ordinary' factor analysis (FA), the first point of interest is the implicit syndrome concept that enters into the use of FA for ASD purposes. It seems necessary to stress this because sometimes FA is applied by people who are unaware of the type of structure which is detectable by FA. Also, an illustrative example will be presented which constitutes the most trivial case of a syndrome structure and yet remains undiscovered by FA. Factor analysis was developed in the context of psychological testing. Typically, the subjects solve problems or answer questions about their personal likes and dislikes, about their attitudes or their values. It has been found that the subjects' answers are not randomly distributed. They seem to be guided by a small number of personality traits and, especially in intelligence testing, the manner in which the subjects solve the problems depends in some way on their 'intelligence', however this term is defined.
Traditionally, relations between quantitative variables (such as answers to questionnaire
items) have been measured by the so-called product-moment correlation coefficient. This is a number ranging from — 1 to -I-1, indicating the degree of dependency of two variables in a specific way. The correlation matrix serves as a basis for the construction of new 'hidden' variables - the factors - that 'explain' the struc-ture of the matrix in a certain way. These factors are weighted sums of the original items and they are essentially continuous variables. This quality of factors can best be expressed by calling them 'scales'. Factors are scales. The model ascribes factor scores to the subjects, which indicate various degrees of how much a person possesses of that property. In the field of ASD, FA is used to construct syndromes and it is customary to identify the resulting factors as 'syndromes'. These syndromes then possess the continuous quality of scales, just like 'intelligence' or 'depression' in personality psychology. We do not regard this model as appropriate for the identification of syndromes, because a syndrome is typically non-continuous. If the subject is affected by the underlying illness - thus exhibit-ing certain syndromes - the symptoms are to appear; if he is not so affected, the symptoms should not be apparent. If we introduced the idea of continuity in the context of psychiatric syndromes we would have to give them names like 'schizophrenicity' or 'manicity' in order to clarify their scale property. Such a scale quality may sometimes intentionally be a part of a model when the syndrome construct under considera-tions is similar in nature to personality traits or to properties in general. In our opinion, however, the medical syndromes as conceptualized by medicine itself generally do not share that quality.
In fact, many advocates of FA employ this procedure without adopting the entire model that has been summarized above. They use it rather because of its incidental capacity to group the variables. The grouping is induced by the way the factors are constructed as weighted sums of the original variables. Through subsequent procedures, such as VARIMAX rotation, the weights are determined in such a way that distinct subgroups of the variables may possess high loadings on different factors. They are then referred to as identifying the property for which the factor stands. Obtaining groups of variables by means of the rotated loadings matrix can be
111111000000000000 111111000000000000 111111000000000000 111111000000000000 111111000000000000 111111000000000000 111111000000000000 111111000000000000 111111000000000000 111111000000000000 000000111111000000 000000111111000000 000000111111000000 000000111111000000 000000111111000000 000000111111000000 000000111111000000 000000111111000000 000000111111000000 000000111111000000 000000000000111111 000000000000111111 000000000000111111 000000000000111111 000000000000111111 000000000000111111 000000000000111111 000000000000111111 00000000000011111 li 000000000000111111
FIG. 6. Artificial raw data table with a simple structure. Rows = subjects; columns = items.
the only purpose of an FA. Nevertheless, the grouping mechanism follows the logic of continuous variables by providing a scale construction.
This process may now be compared with the syndrome model we presented in the introduction of BOOLE-FA. No matter whether that model is considered too simple or not, it should be understood that FA correctly detects the follow-ing simple case. Fig. 6 shows the yes/no answers of 30 subjects on 18 symptom items (yes = 1, no = 0). This table of artificial raw data simulates the most elementary case of three syndromes where there are three corresponding groups of subjects. Let them be called a ' simple syndrome structure of degree 3'.
FA now provides, surprisingly, exactly 2 factors, each accounting for 50% of the vari-ance, meaning that the structure is totally ex-plained by these two factors. A closer look at the so-called factor space (Fig. 7) explains this obvious contradiction. In the factor space the three syndromes form perfect clusters; in fact, all
FIG. 7. Two-factor solution: factor space. Labels printed on top of each other:
1 , 2 , 3 , 4 , 5 , 6 ; 7 , 8 , 9 , 10, 11, 12; 13, 14, 15, 16, 17, 18.
the items of one group have the same position. It is the equation 'factor = syndrome' which leads to the wrong conclusions.
The correlation coefficient used in FA indeed rises with the degree of concurrence of the items. It shares this property with almost every other coefficient of similarity. Consequently, factors are likely to capture groups of frequently concurring symptoms. In many cases, therefore, ASD obtained by means of FA can lead to reasonable results, but the investigator can never be certain of its capacity to do so because FA takes items with high negative correlations (i.e. symptoms which do not concur at all) to belong to one and the same factor, although in a negative sense. They form the negative pole of the corresponding quality. This property of FA not only offers problems of interpretation, but it can also lead to strange results, as the example shows. In non-artificial data sets this property of FA interferes with a possibly more complex data structure and cannot be isolated and unmasked as easily as in our artificial example. Research based on the above equation can never guarantee that the factors found correspond to groups of concurring symptoms, even though in most instances this may be the case.
ASD by means of cluster analysis (CA) and multidimensional scaling (MDS)
MDS and CA do not share the weakness mentioned above because they follow a different logical path. In contrast to FA, which employs a model based on the logic of correlational statis-tics, CA and MDS have weaker constraints and more flexibility. In a sense, they could be called ' neutral analysingdevices' for similarity matrices. The performance of the algorithm depends on the choice of an appropriate similarity coefficient.
First, to clarify the idea of similarity/dissimi-larity it is necessary to point out that we sometimes use the term 'similarity' in a more general sense. A matrix of similarity coefficients is a square table where the entry in row i and column j is a number denoting the degree of similarity (dependence, proximity, etc.) between elements / and j . A measure of similarity has to satisfy only two simple axioms: (1) Symmetry: the similarity between elements / and j has to be the same as that between elements j and i; this is almost trivial. (2) There must be an upper bound to the possible range of values which is typically the value of the similarity of an element with itself. In the case of dissimilarity there must be a lower bound. A typical example of a table of dissimilarities is a distance table of the major towns of a country which can sometimes be found on road maps.
The matrix of correlation coefficients that FA accepts as input is an example of a matrix of similarities. The number in row i and column j denotes the degree of linear dependence of variables i andy. The product-moment correlation is probably the best known similarity coefficient.
Given a matrix of similarities, CA and MDS solve two slightly different but related tasks: (1) MDS tries to represent the objects as points in an Euclidean space so that the order of inter-point distances corresponds to the order of the similarity coefficients. Similar objects are clustered together, whereas dissimilar ones are represented by distant points. (2) CA tries to form groups directly without any representation as points in an Euclidean space. In this case it is not necessarily possible to visualize the obtained groups as clusters of points, a fact that suggests previous metrization through MDS.
In the context of ASD it is the symptoms that
form the elements - strictly speaking, the re-sponse vectors taken from each subject and the coefficient required has to be a measurement of concurrence. In the case of dichotomous items (see Fig. 6) Cohen's Kappa (Cohen, 1960) is an appropriate measure, since its logic derives from the percentage of concurrence.
In different applications specific similarity coefficients can be constructed which take into account specific properties of the respective discipline. Some work has been done to classify similarity coefficients and to establish something like a general theory of similarity (e.g. Cronbach &Gleser, 1958; Asendorff& Walbott, 1979), but without regard to these specific topics all similarity coefficients share the property of
continuity.
In order to form a syndrome a certain number of symptoms should co-exist with no more than a few exceptions due to error. We believe that a continuous measure of concurrence does not exactly match the idea of a syndrome in psychiatry. Of course, if there is a syndrome structure in the data (as, for example, in Fig. 6) this will be detected because only a few discrete values of the similarity measure will appear. And if we computed the table of Kappa values for the data shown in Fig. 6, only two values would occur: 100 within syndromes, and —0-50 between.
It is only in the case of a continuous distribution of coefficients that interpretation becomes difficult. In this case, CA and MDS are unable to identify any stable groups, and different CA-algorithms yield different group-ings. The data then do not fit a discontinuous model, and it is impossible to interpret them in terms of syndromes.
DISCUSSION
Apart from the syndrome concept, there is another reason why, in our view, BOOLE-FA is superior to the other procedures. In contrast to them, BOOLE-FA omits the initial transfor-mation of raw data into similarity measures. Although this transformation allows for sophis-ticated analyses, it also results in a specific loss of information. We are not referring here to the general loss of information due to inevitable data reduction, but to the particular loss of informa-tion concerning the relainforma-tions between groups if
00101 0000C 1 000001 00011 1111100000100000000 10111000000000000000 11110000000010000000 11111000000000010000 10110000000010000000 11111010000010000000 1111000000000000001 10111001101000000000 11010000000000001010 11111000000000001000 OOOOC1110 0OOOC1111 000000111 0OOOCO011 1111 111 iii 1111 000001011 1 0 0 0 C 1 1 1 1 0111000000 1100000010 0001000000 0000000100 10000000000 10000000000 10010000111 10000000000 10000000000 10000000000 0000000001 0010000000 0000000001 )0001000001 111100001 1111100000 00000000001011100000 01000001001111100000 0000000000111111001 30100000001101100100 0000000001111101000 000000100(1011100000 111100000 111100000 0001000000000011111 '0000010000000010111 0100000100000111111 0000010000001011101 1010000000000011101 0000000000000010111 0000000000000111111 OOOOO1O1O0O00010111 0001000000001011111 01000000000000li1111 (a) 1111000000000010000 1101000100001001000 1111000000000000000 1011C001000000100000 01111011110000000010 01111111110000000000 11111111110000000000 11101111010000000001 11111111110000000000 1001111010100000001 1011111111000000000 1110001110000000000 1111111110000000000 1111111110000000011 11111000001111100010 11111000001010100000 11111100001110100000 11011000001111100000 11111000101111101000 11111000001111 ilOOOOO 01111000001101111111 11111000001111111111 1 1 1 1 0 0 0 0 0 0 1 1 1 1 1 1 0 1 1 1 11111000001111111111 1 1 1 1 lIOOOOOOl 1 1 1 0 1 1 0 1 01000000001011111011 00000010001011111111 01110000001111111011 00000000100111011101 00000000001111111101 000000000011111100001 00000000001001110000 01010000001111100000 00000000101111100000 00000000001111100000 00001100001111100000 00000100001101101000 00000010111111100100 00001000001111100000 00000000001111100100 (b)
FIG. 8. (a) Simple structure of degree 4. (6) A more complex 4-group structure. Rows = subjects; columns = items.
they exist. All three procedures provide us with a list of groups and their constituent members, possibly together with a spatial representation, but very different raw data tables can lead to the same list of group members. The following figures clarify the issue.
Fig. 8 (a) shows a simple structure of degree 4; Fig. 8(6) shows a raw data table with a more complex structure. Ten per cent of error has been added to both tables in order to avoid multiple points in the geometrical representations. More-over, a more realistic situation is simulated.
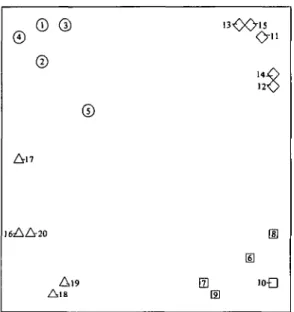
Figs. 9 and 10 show the corresponding MDS 2-space solutions. It should be kept in mind that, in the case of non-artificial data, the structure of the two raw data tables would be completely unknown, because both subjects and items would be arranged in an arbitrary order.
In both configurations the symptom groups are mapped into clusters of points. In both cases four groups are obtained, but only an expert data analyst can tell which configuration belongs to which table. It is the regularity in Fig. 9 which makes it likely to derive from Fig. 8 (a). In other
©
©
A n 16AA20 Al9 A18m
Elm
io£]Fio. 9. MDS 2-space solution of the raw data in Fig. 8 (a).
O-13 \/-1 4 18A 17A 16A A 20 Al9 ID 0 ® H
©
© ©FIG. 10. MDS 2-space solution of the raw data in Fig. 8(A). Labels printed on top of each other: 3, 4.
cases where both structures are not simple, a distinction would be impossible. The equation 'group = syndrome', although correct, misses the important difference in inter-group relations. The two samples lead to completely different scientific insights about nosological structure. In the first example there are four distinct syn-dromes; in the second case there are two over-lapping main syndromes, each accompanied by
an accessory syndrome. This difference becomes invisible at the moment of transformation of the raw data into similarity matrices and can only reappear if the block structure of the raw data is made visible through a suitable rearrangement of both subjects and items.
BOOLE-FA preserves the relevant information on the inter-group relations which is mostly lost with the methods using similarity matrices. This fact gives rise to a more complicated terminology concerning syndrome structures. It is not then necessary to be restricted to the mere statement of how many syndromes exist and what their members are. The relations between blocks could be described by terms like 'core syndrome' and 'accessory syndrome', depending on the com-plexity of the resulting structures. The blocks of the example could be called one 'general syndrome' with two possible complications or 'accessory syndromes'. In the case of more complicated structures new terms may be needed.
Another function of BOOLE-FA is to clarify multidimensional representations, should these be required. If, as is usually the case, there is no clear cluster structure, interpretation can become difficult. A Boolean block structure then does not fit the data and is loaded with a considerable amount of error. Nevertheless, the block structure can point out tendencies in the data which determine the regions of the spatial configuration.
Mention should also be made of the several weaknesses of the procedure. BOOLE-FA needs an initial table of loadings to initiate its circles of iterative optimization. In our program, this starting table is generated with random numbers and the result depends on the choice of starting point. Therefore it is necessary to try several starting positions in order to determine the best solution. With no underlying block structure (when the model is inappropriate), the solutions can very considerably, but the weakness then lies also in the data themselves which resist attenipts to have a block structure imposed on them.
Another weakness has already been touched upon. At one point of the algorithm the maximum of a set of integers has to be determined, and there are probably several elements with maximal values. The particular choice then depends on the arbitrary order of variables and subjects in the original raw data
table, leading to the uncomfortable situation that the solution depends on a meaningless order. However, since there is no reasonable choice between one maximal value and another no obvious solution to this problem presents itself.
Finally, we shall briefly examine the extensions of our BOOLE-FA program compared with the original:
(1) The main new feature is the sorting option, as explained in the text (see pp. 318-319).
(2) Closely related is a special output option which prints the rearranged tables with spaces between blocks. Subjects and variables are labelled with their original sequence numbers, which facilitates their identification.
(3) Optional label vectors are written in a way which can be read by other programs (e.g. MDS) in order to label the points of dimensional plots by their BOOLE-FA group codes, instead of their sequence numbers. This option makes it possible to relate traditional spatial representa-tions to BOOLE-FA solurepresenta-tions.
(4) Our version allows for a maximum of 610 subjects and 160 variables. These limitations can easily be extended.
(5) For small problems the program can be called in interactive mode. Raw data tables of the order of 50 x 50 cause no visible delays. Larger problems of about 600 x 100 data values take
about lOmin computation time and are better treated in batch mode.
REFERENCES
American Psychiatric Association (1978). Diagnostic and Statistical Manual of Mental Disorders (3rd edn) (DSM-I1I). APA: Washington, D.C.
Asendorff, J. & Walbott, H. G. (1979). Masse der Beobachterueber-einstimmung: Ein systematischer Vergleich. Zeitschrift fur Sozial-psychologie 10, 243-252.
Berner, P. (1977). Psychiatrische Systematik - ein Lehrbuch. Hans
Huber: Bern.
Bonhoeffer, K. (1910). Die symptomatischen Psychosen im Gefolge von
akuten Infeklionen und inneren Erkrankungen. Deuticke: Leipzig, Vienna.
Cohen, J. (1960). A coefficient of agreement for nominal scales. Education and Psychological Measurement 20, 37-46.
Cronbach, L. & Gleser, G. C. (1958). Assessing similarity between
profiles. Psychological Bulletin 50, 456-473.
Engelmann, L., Mickey, M. R. & Mundle, P. (1982). Boolean Factor Analysis - a BMDP program. Dept. of Biomathematics: UCLA, Los Angeles.
Hecker, E. (1871). Die Hebephrenie, Virchows Archivfurpathologische Anatomie 52, 394-429.
Hoche, E. A. (1912). Die Bedeutung der Symptomkomplexe in der
Psychiatrie. Zeilschrift fur die gesamte Neurologie und Psychiatrie
12, 540-551.
Kahlbaum, K. L. (1874). Die Katatonie oder das Spannungsirresein.
Hirschwald: Berlin.
Lorr, M., Klett, C. J. & McNair, D. M. (1963). Syndromes of Psychosis. Pergamon Press: New York.
Schneider, C. (1942). Die schizophrenen Symptomverbaende.
Mono-graphie aus dem Gesamtgebiet der Neurologie und Psychiatrie 71. Springer: Berlin.
Snell, O. (1865). Ober Monomanie als primaere Form der
Seelenstoerung. Allgemeine Zeilschrift fur Psychiatrie 22, 368-381.
World Health Organization (1978). Manual of the International Statistical Classification of Diseases, Injuries and Causes of Death (9th revision) (ICD-9). WHO: Geneva.