Publisher’s version / Version de l'éditeur:
Vous avez des questions? Nous pouvons vous aider. Pour communiquer directement avec un auteur, consultez la
première page de la revue dans laquelle son article a été publié afin de trouver ses coordonnées. Si vous n’arrivez pas à les repérer, communiquez avec nous à PublicationsArchive-ArchivesPublications@nrc-cnrc.gc.ca.
Questions? Contact the NRC Publications Archive team at
PublicationsArchive-ArchivesPublications@nrc-cnrc.gc.ca. If you wish to email the authors directly, please see the first page of the publication for their contact information.
https://publications-cnrc.canada.ca/fra/droits
L’accès à ce site Web et l’utilisation de son contenu sont assujettis aux conditions présentées dans le site LISEZ CES CONDITIONS ATTENTIVEMENT AVANT D’UTILISER CE SITE WEB.
BCRA 2005 [Proceedings], pp. 1-9, 2005-06-01
READ THESE TERMS AND CONDITIONS CAREFULLY BEFORE USING THIS WEBSITE.
https://nrc-publications.canada.ca/eng/copyright
NRC Publications Archive Record / Notice des Archives des publications du CNRC : https://nrc-publications.canada.ca/eng/view/object/?id=d473bb25-f7b7-48ff-a4c8-e0e645d541e6 https://publications-cnrc.canada.ca/fra/voir/objet/?id=d473bb25-f7b7-48ff-a4c8-e0e645d541e6
NRC Publications Archive
Archives des publications du CNRC
This publication could be one of several versions: author’s original, accepted manuscript or the publisher’s version. / La version de cette publication peut être l’une des suivantes : la version prépublication de l’auteur, la version acceptée du manuscrit ou la version de l’éditeur.
Access and use of this website and the material on it are subject to the Terms and Conditions set forth at
Predicting the resilient modulus of unbound granular materials by neural networks
http://irc.nrc-cnrc.gc.ca
N a t i o n a l R e s e a r c h C o u n c i l C a n a d a
Pre dic t ing t he re silie nt m odulus
of unbound gra nula r m at e ria ls
by ne ura l ne t w ork s
N R C C - 4 7 7 0 4
Z e g h a l , M . ; K h o g a l i , W .
A version of this document is published in / Une version de ce document se trouve dans:
Predicting the Resilient Modulus of Unbound Granular Materials by
Neural Networks
M. Zeghal & W. Khogali
Institute for Research in Construction, National Research Council Canada, Ottawa, Ontario, Canada
ABSTRACT: The process of pavement design requires the provision of material properties. For mechanistic–empirical design methods, the resilient modulus represents the most suitable alternative for describing the behavior of aggregate materials commonly used in sub-base and base layers. However, the adoption of the resilient modulus has been slow due to the complicated nature of the laboratory test used to obtain the parameter and its cost. Attempts to correlate the resilient modulus to the widely used California Bearing Ratio and other empirical parameters in the past fall short of providing reasonably accurate estimates of the parameter. With the renewed interest in using the resilient modulus as advocated by the AASHTO 2002 Guide, a quick and inexpensive solution to providing accurate estimates of this parameter is needed. This paper presents the artificial neural network (ANN) technique as a promising method that can help designers have a good first-step estimation of the resilient modulus based on data accumulated over the years. The study highlights the use of the ANN technique, which utilizes simple parameters as input to predict the resilient modulus of unbound granular materials. Results of ANN simulations confirm the potential of the technique to predict the resilient modulus of compacted samples tested at various compaction densities, states of stress and moisture contents. Such a tool represents an attractive alternative to laboratory testing for small jurisdictions with limited budgets and personnel.
KEY WORDS: Resilient modulus, neural network.
1 INTRODUCTION
Adequate characterization of pavement materials is a prerequisite to the development and use of any mechanistic – empirical design method. It also constitutes an important economic factor when evaluating viable design alternatives. However, due to the complex nature of materials used in roads, current characterization techniques involve many simplifying assumptions and require special testing capabilities to obtain the needed material parameters. With the advent of the new AASHTO Design Guide, much focus was given to the use of the resilient modulus (Mr) as the parameter of choice to characterize the load deformation
response of unbound materials used in base and subbase layers. It is advocated that the mechanical response of these layers under traffic and in-service environmental conditions will be best described by the Mr parameter. Many techniques including laboratory testing,
non-destructive in-situ testing and correlations with empirical parameters, were proposed to measure the resilient modulus. However, laboratory determination, in the form of repeated loading tests, has been regarded as the most accurate method of obtaining the Mr property.
2 d r r M σ ε = ... (1) Laboratory determination of the resilient modulus of aggregate materials is elaborate and requires capital investment and special training. Currently, few jurisdictions in Canada have the required testing capabilities to determine the resilient behaviour of their unbound materials. Accordingly, other alternatives are needed to obtain this property.
The AASHTO Design Guide incorporates the use of the resilient modulus at its three levels of design. At the advanced level (level 1), the new guide requires performing the actual resilient modulus test. At the other two basic levels (levels 2 and 3), no laboratory testing is sought, however, the provision of empirical inputs such as the California Bearing Ratio (CBR), the R-value or the material physical properties is required to estimate the mechanistic parameter. The accuracy of the resilient modulus obtained in this way is usually compromised due to its poor correlation with the CBR and other physical properties.
The above-discussed difficulties encountered in obtaining the Mr property, pose a
challenge to road authorities seeking to implement the new design guide. To remedy the situation and facilitate the task of Canadian jurisdictions in embracing the new design guide, the National Research Council Canada (NRCC) took the challenge of developing a master database that covers the main unbound material types found across Canada. Such a database will eliminate the need for extensive testing and will result in more accurate estimation of the resilient modulus property. The NRCC initiative has been faced with an enormous amount of testing required to cover different construction quality, traffic and environmental conditions and variations in materials encountered across Canada. This paper presents an attempt to use the artificial neural network technique as a tool to estimate the resilient modulus from accumulated test results and to populate the database to cover the wide range of factors known to affect the resilient behaviour of unbound materials. Section 2 presents an overview of the neural network modeling concept while Section 3 discusses the construction of the actual network used in the current research and its optimization. Sections 4 and 5 discuss the adequacy of the technique to recognize known tendencies in resilient modulus behaviour and the application of the technique to populate the database. Summary of findings are given in Section 6.
2 ARTIFICIAL NEURAL NETWORKS
Artificial neural networks (ANN) are made of a number of neurons that are connected together in a way similar to the architecture of the human brain. This computational technique has the ability to learn in a way similar to people. It is capable of recognizing, capturing and mapping features known as patterns contained in a set of data mainly due to the high interconnections of neurons that process information in parallel. A network that has learned the patterns defining the relationship between the input and output of a certain test or process can later be used to predict new conditions for which the results (output) are not known. Presenting a network with facts for which the input and output are known to delineate the embedded patterns is an integral part of the ANN modeling process.
A network is made up of three or more layers. The first layer contains the input parameters while the last layer contains the output (solution). One or more layers known as hidden layers are usually placed between the input and output layers. The hidden layers constitute the network’s means of delineating and learning the patterns governing the data that the network is presented with.
There are many ways a neural network can be trained. The back propagation technique is the most popular process and has been used in many fields of science and engineering such
as construction simulation (Flood 1990 and Moslehi et al. 1991), constitutive modeling (Rogers 1994) and structural analysis (Garrett et al. 1992). In a back propagation learning process, training is accomplished by assigning random connection weights to the connections and calculating the output using the present connection weights. At a second stage, the process involves back propagating the error defined as the difference between the actual and computed output through the hidden layer(s). This procedure is repeated for all training facts until the error is within a certain tolerance. The final network with final connection weights is then saved to serve as a prediction model.
3 NETWORK BUILDING AND OPTIMIZATION
In general, the development of ANN involves defining the number of inputs, outputs, and nodes in one or more hidden layers. The input layer size is generally predetermined based on the parameters known or suspected to affect the targeted output(s). However, the number of hidden layers as well their nodes is usually determined by a-trial-and-error procedure. Determination of the number of hidden layers and their nodes involves training, and testing the built network against test sets made of examples with known input and output (database). 3.1 Planning the Mr Investigation
Previous experimental work performed in the last four decades showed that the resilient modulus of unbound granular materials is influenced by a number of factors. Much of the research focused on quantifying the effects of these factors on the resilient modulus. Several studies (Hicks 1970, Robinson 1974, and Rada and Witczak 1981) showed that increasing compaction density results in a corresponding increase in the resilient modulus. On the other hand, increasing the moisture content of the material beyond its optimum was found to decrease the resilient modulus (Hicks 1970, and Dawson et al. 1996). The state of stress that the material is subjected to was also found to influence the resilient modulus to varying degrees. Hicks (1970), Smith and Nair (1973) and Sweere (1990) have shown that the resilient modulus increases with an increase in confining pressure. Hicks (1970) reported that the deviator stress has almost no effect on the resilient modulus while Brown (1974) showed that this parameter has a significant effect on the resilient modulus, especially, at high stress levels. Recent work completed at NRCC (Khogali and ElHussein, 2004) showed that the amount of percent fines passing sieve # 200 (0.075 mm) has a major impact on the resilient modulus of unbound materials.
Using a data set of laboratory determined Mr values from earlier research work
performed at NRCC, an ANN investigation was initiated to examine the effectiveness of the analytical technique in expanding the database without the need for further testing. The laboratory database used included Mr values that were obtained under different conditions of
density (89 – 98% of Modified Proctor density), moisture (3 – 7% representing 2.5% dry of optimum to 1.5% wet of optimum), deviator stress (30 – 85 kPa) and percent fines (2 – 18%). Careful examination of the lab data revealed inconsistency of some of the Mr values, which
was believed to be attributed to measurement errors and/or equipment malfunction. Based on this observation, it was decided to perform the ANN simulations in two stages: one using the full set and another using a sub-set of the database after eliminating values that are suspected to be incorrect. In the following discussion the full set will be referred to as Set 1 while the reduced set will be referred to as Set 2.
4
3.2 Network Architecture
In this study, a single output (Mr) is chosen. The inputs included compaction density,
moisture content, deviator stress and percent fines passing sieve # 200 (75μm). Through trial and error it was found that using more than one hidden layer did not improve the accuracy of the predictions, leaving the number of nodes in the single hidden layer as the only unknown parameter to be determined.
The number of nodes in the hidden layer was investigated to arrive at a robust network with acceptable predictions. The investigation consisted of two stages. In the first stage, the complete data (Set 1) was used to train the network with varying number of nodes in the hidden layer. Ten percent of the data was randomly set aside for testing the trained network and another ten percent of the data was reserved for comparing the predictions of the built network with laboratory obtained data. The effect of the number of hidden nodes on the accuracy of the network was measured by the percentage “Absolute value of the Relative Error” (ARE) defined as:
ARE = abs. {(Xprediction-Xactual)/Xactual} x 100%... (2)
The effect of the number of hidden nodes on ARE, using Set 1, is displayed in Figure 1 as run 1. It is clear that the number of nodes in the hidden layer plays a major role in the accuracy of the network. From the results of the investigation that was carried out on Set 1, an optimal number of 12 was found to provide the greatest accuracy for the trained network. To confirm the results obtained in run 1 and to check the robustness of the network developed, another run was performed. This time the ten percent of the data set aside for predictions initially was put back into the database and a new training session was performed. The result of this exercise was the curve labeled as run 2 in Figure 1. Examination of run 2 reveals that there is no optimal number of hidden nodes that minimizes the ARE value. This trend, which contradicts the results obtained before for run 1, hints at the existence of contradictions within the laboratory data set. This observation confirms the initial belief that some of the Mr values
contained in the original database may be in error.
The inconsistency observed when Set 1 was chosen for training, motivated re-training of the network using the data contained in the smaller set (Set 2). The exercise involved training different networks with varying number of nodes in the hidden layer as was done before with data Set 1. Two runs (1 & 2) were again performed in a manner similar to that done for Set 1 and the results obtained are depicted in Figure 2. Interestingly, the optimum number of nodes was found to coincide with that determined previously for Set 1 i.e. 12 nodes. This time, however, the two runs produced the same consistent results, which confirm the adequacy and robustness of the newly trained network. This network was retained and was later used to check known trends in resilient modulus behaviour. Furthermore, the newly developed network was used to populate a generic material library that can be used to provide Mr material input for design and analysis exercises involving unbound road layers.
Figure 1: Effect of number of hidden nodes on the accuracy of the trained network using Set 1
Figure 2: Effect of number of hidden nodes on the accuracy of the trained network using Set 2
0 5 10 15 20 25 30 35 40 45 7 8 9 10 11 12 13 14 15 16
Number of hidden nodes
|ARE| (%) Run1 Run2 0 5 10 15 20 25 30 35 40 45 50 7 8 9 10 11 12 13 14 15 16
Number of hidden nodes
|ARE| (%)
Run1 Run2
4 ADEQUACY OF THE TECHNIQUE
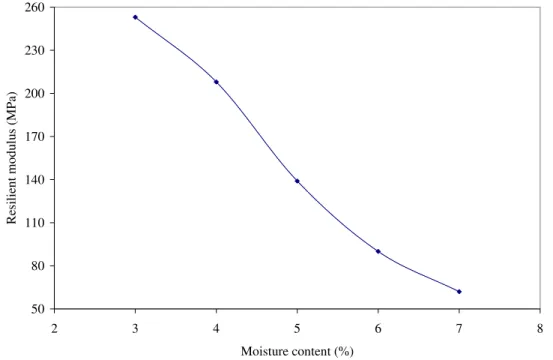
To ensure that the ANN model (Section 3) had effectively learned the features that are known to affect the resilient modulus, the trained network was used to check known material behaviour trends related to variations in density and moisture content. Predictions generated by the ANN model were compared with trends established in the literature for these two variables. Figure 3 shows the results of predictions obtained for an aggregate material with 7% fines content, which was compacted at its optimum moisture content of 5.3% and tested under a stress level of 50 kPa. It is evident that the ANN model is capable of reproducing the known effect of density on the resilient modulus. Upon increasing compaction density, while keeping all other factors constant, the resilient modulus increases. An increase in density of 4% (from 90 to 94%) for example, produced an increase in the resilient modulus of about 25% (from 139 to 179 MPa). Figure 4 displays predictions made for the same aggregate material (with 7% fines), compacted at 90% of its maximum Modified Proctor density and under a stress level of 50 kPa. Examining Figure 4 confirms again the ability of the ANN model to delineate the effect of moisture content on the resilient modulus (an increase in moisture is accompanied by a decrease in Mr).
Figure 3: Effect of density on the resilient modulus as predicted by ANN model
5 APPLICATION: POPULATING THE DATABASE
After ensuring the adequacy of the ANN model developed, the analytical technique was used to populate the original laboratory database. For the granular material studied in this paper, the original database containing an initial 50 test results was expanded to include more than 5000 data points covering the ranges of variables in increments of 1% for density, 0.5% for moisture content, 5 kPa for stress level and 2% of percent fines. An example illustrating the population of the database for a single percent fines of 7% and moisture content of 5.0% and covering the whole range of density (89 – 98%) under 3 stress levels (35, 45 and 85 kPa) is given in Table 1. The original lab values used in this example are the entries shown in shaded
130 170 210 250
89 91 93 95 97 99
Density (% of maximum modified Proctor density)
colour in Table 1. To further confirm that the trained network is capable of representing known trends, the data obtained for two stress levels were compared as shown in Figure 5. The curves substantiate again that an increase in density results in an increase in the resilient modulus. Furthermore, increasing the stress level also results in a corresponding increase in the modulus. Figure 5 also suggests that the rate at which the modulus increases with density is higher for higher stress levels and that there is no gain in the modulus beyond the 98% density (an observation that is supported in the literature).
Figure 4: Effect of moisture content on the resilient modulus as predicted by ANN
Figure 5: Stress sensitivity of aggregate material as confirmed by ANN simulations 50 80 110 140 170 200 230 260 2 3 4 5 6 7 8 Moisture content (%)
Resilient modulus (MPa)
100 120 140 160 180 200 220 240 260 280 300 88 90 92 94 96 98 100 102
Density (% of maximum Proctor density)
Resilient modulus (MPa)
35 kPa 45 kPa
Table 1: Illustration of the population process of database Stress level (kPa) Density (% of MMPD*) Resilient modulus (MPa) 35 90 140 35 91 146 35 92 151 35 93 156 35 94 159 35 95 163 35 96 167 35 97 173 35 98 178 35 99 180 35 100 180 45 90 136 45 91 138 45 92 145 45 93 156 45 94 170 45 95 184 45 96 199 45 97 212 45 98 222 45 99 224 45 100 226 85 90 103 85 91 108 85 92 115 85 93 126 85 94 141 85 95 162 85 96 187 85 97 215 85 98 242 85 99 268 85 100 289
* MMPD: Maximum modified Proctor density
6 SUMMARY AND CONCLUSIONS
The 2002 AASHTO design guide requires the use of the resilient modulus to characterize unbound materials used in base, subbase and subgrade layers of roads. However, the resilient modulus test is elaborate and costly. In addition, only a limited number of jurisdictions have the required testing capabilities and human resources to perform such a test. The adoption of the design Guide will be hampered by such limitations unless other options are made available to generate such material input. This paper presents the artificial neural network as an alternative to performing the test to cover the wide spectrum of factors that are known to influence the Mr parameter. Results obtained from the current study showed that the ANN
technique is a valuable tool that has the capability of picking up known trends and can effectively be used to expand existing databases. From the limited results shown in this paper, the ANN technique confirmed known influences of density, moisture content and deviator stress on the resilient modulus. The study also illustrated the ability of the analytical technique to be used as a quality control tool to eliminate data with questionable reliability. Although not discussed in this paper, the neural network can also be used to better plan laboratory testing activities to cover wider ranges of variables and to permit a more rigorous testing of the data generated.
REFERENCES
AASHTO (1986). “Guide for Design of Pavement Structures.” American Association of State Highway and Transportation Officials.
AASHTO (1993). “AASHTO Guide for Design of Pavement Structures 1993” American Association of State Highway and Transportation Officials.
Dawson, A. R., Thom, N. H., and Paute, J. L., 1996. Mechanical Characteristics of Unbound Granular Materials as a Function of Condition, Flexible Pavements, Proc. Eur. Symp. Euroflex. 199, A. G. Correia, ed., Balkema, Rotterdam, The Netherlands, 35-44.
Flood, I., 1990. Simulating the Construction Process Using Neural Networks. Proceedings of the Seventh International Symposium on Automation and Robotics in Construction, ISARC, Bristol Polytechnic, England.
Garrett, J. H., Ranjitham, S., and Eheartt, J. W., 1992. Application of Neural Network to Groundwater Remediation. In Expertt Systems for Civil Engineers: Knowledge Representation, Edited by Allen, R.
Hicks, R. G., 1970. Factors Influencing the Resilient Properties of Granular Materials, PhD. Thesis, University of California, Berkeley, Berkley, California.
Moselhi, O., Hegazi, T. and Fazio, P., 1991. A Hybrid Neural Network Methodology for Cost estimation. Proceedings of the Eighth International Symposium on Automation and Robotics in Construction, ISARC, Stuttgart, Germany.
Rada, G., and Witczak, M. W., 1981. Comprehensive Evaluation of Laboratory Resilient Moduli Results for Granular Material. Transp. Res. Rec. 810, Transportation Research Board, Washington, D.C., 23-33.
Robinson, R. G., 1974. Measurement of the Elastic Properties of Granular Materials Using a Resonance Method. TRRL Supplementary Rep. No. 111UC, TRRL.
Rogers, J. L., 1994. Simulating Structural Analysis with Neural Network. J. Comp. Civ. Engng, ASCE 8, 80-100.
Smith, W. S., and Nair, K., 1973. Development of Procedures for Characterisation of Untreated Granular Base Coarse and Asphalt-Treated Base Course Materials. Rep. No. FHWA-RD-74-61, Federal Highway Administration, Washington, D.C.
Sweere, G. T. H., 1990. Unbound Granular Basis for Roads. PhD. Thesis, University of Delft, Delft, The Netherlands.
Khogali W.E.I., and ElHussein H. Mohamed, 2004. Novel Approach for Characterization of Unbound Materials, In Transportation Research Record No. 1874, pp. 38 – 46, Journal of the Transportation Research Board.