Publisher’s version / Version de l'éditeur:
Vous avez des questions? Nous pouvons vous aider. Pour communiquer directement avec un auteur, consultez la première page de la revue dans laquelle son article a été publié afin de trouver ses coordonnées. Si vous n’arrivez pas à les repérer, communiquez avec nous à PublicationsArchive-ArchivesPublications@nrc-cnrc.gc.ca.
Questions? Contact the NRC Publications Archive team at
PublicationsArchive-ArchivesPublications@nrc-cnrc.gc.ca. If you wish to email the authors directly, please see the first page of the publication for their contact information.
https://publications-cnrc.canada.ca/fra/droits
L’accès à ce site Web et l’utilisation de son contenu sont assujettis aux conditions présentées dans le site LISEZ CES CONDITIONS ATTENTIVEMENT AVANT D’UTILISER CE SITE WEB.
13th International Conference on Wind Engineering (ICWE13). Programme Book: 10-15 July 2011, Amsterdam, Netherlands, 2011-07-10
READ THESE TERMS AND CONDITIONS CAREFULLY BEFORE USING THIS WEBSITE. https://nrc-publications.canada.ca/eng/copyright
NRC Publications Archive Record / Notice des Archives des publications du CNRC :
https://nrc-publications.canada.ca/eng/view/object/?id=34f1204d-16fc-4c11-bf66-1cf4cc5e2f26 https://publications-cnrc.canada.ca/fra/voir/objet/?id=34f1204d-16fc-4c11-bf66-1cf4cc5e2f26
NRC Publications Archive
Archives des publications du CNRC
This publication could be one of several versions: author’s original, accepted manuscript or the publisher’s version. / La version de cette publication peut être l’une des suivantes : la version prépublication de l’auteur, la version acceptée du manuscrit ou la version de l’éditeur.
Access and use of this website and the material on it are subject to the Terms and Conditions set forth at Field monitoring the wind performance of commercial roofs. Part 1: Data from Ottawa site
http://www.nrc-cnrc.gc.ca/irc
Fie ld m onit oring t he w ind pe rform a nc e of c om m e rc ia l roofs -- Pa rt 1 : pre lim ina ry da t a from Ot t a w a sit e
N R C C - 5 3 9 3 2
B a s k a r a n , B . A . ; M o l l e t i , S . ; K o , S . K . P . ; V a n R e e n e n , D .
J u l y 2 0 1 1
A version of this document is published in / Une version de ce document se trouve dans:
13th International Conference on Wind Engineering, Amsterdam, Netherlands, July 10-15, 2011, pp. 1-4
The material in this document is covered by the provisions of the Copyright Act, by Canadian laws, policies, regulations and international agreements. Such provisions serve to identify the information source and, in specific instances, to prohibit reproduction of materials without written permission. For more information visit http://laws.justice.gc.ca/en/showtdm/cs/C-42
Les renseignements dans ce document sont protégés par la Loi sur le droit d'auteur, par les lois, les politiques et les règlements du Canada et des accords internationaux. Ces dispositions permettent d'identifier la source de l'information et, dans certains cas, d'interdire la copie de documents sans permission écrite. Pour obtenir de plus amples renseignements : http://lois.justice.gc.ca/fr/showtdm/cs/C-42
Field monitoring the wind performance of commercial roofs
Part 1: Data from Ottawa site
Baskaran, A.
a, Molleti, S.
b, Ko, S.
c, Van Reenen, D.
da
National Research Council of Canada, Ottawa, Ontario, Canada,bas.baskaran@nrc.ca
b
National Research Council of Canada, Ottawa, Ontario, Canada,sudhakar.molleti@nrc.ca
c
National Research Council of Canada, Ottawa, Ontario, Canada,steven.ko@nrc.ca
d
National Research Council of Canada, Ottawa, Ontario, Canada, david.vanreenen@nrc.ca
ABSTRACT
Building codes and standards specifies pressure coefficient data for wind design of commercial roofing systems. It mostly derives the data from wind tunnel studies. Roofing community in North America has undergone much change over the last 25 years along with advances in ma-terial science, computer-aided design and engineering application. However, the wind tunnel data that was developed over two decades before can be said to be less appropriate to quantify wind induced loads of current roof coverings. Field measurements can benchmark the wind tunnel studies can prove valuable data to validate the current wind load provisions and the ex-isting roof cladding wind uplift test methods. A long term project has been initiated at the NRC, to collect the field performance of commercial roofs in three locations across North America, (1) Ottawa – Canada (2) Mt Pleasant – USA and (3) Rialto – USA. This paper presents the data from the Ottawa Site.
1 INTRODUCTION
Understanding wind performance of commercial roofs and minimizing roof blow offs are criti-cal in the service life of a building as the roof protects its occupancies and contents. Roofing community in North America has undergone major changes over the last 25 years along with advances in material science, computer-aided design and engineering application. A compa-nion paper entitled, “Evaluating Wind Effects on Commercial Roofs - North American Ad-vancements” presents the market share data and classifies commercial roofs in to: Flexible Roofing Systems (FRS) and Rigid Roofing Systems (RRS) (Baskaran et al., 2010). In a FRS, components such as, insulation and, cover boards, are integrated using mechanical fasteners. In a RRS, components are integrated using adhesives. Comparison of the wind uplift performance showed major differences in the response between these systems. During the last sixteen years (1994 – 2010), a North American roofing consortium, Special Interest Group for the Dynamic Evaluation of Roofing Systems (SIGDERS) developed test methods and standards, and was published by the Canadian Standards Association (CSA A123.21-10, 2010). To assist roof de-signers and manufacturers, this new developments are being referenced in the national building code of Canada (NBCC, 2010).
The companion paper concluded that these advancements in the roof coverings are rapid and market penetrations are significant. However, the wind tunnel methodology that were devel-oped over two decades before are less appropriate to quantify wind induced loads on roof co-verings. Data used in the building codes and standards mostly derived from the wind tunnel studies without considering the influence of the roof covering on the induced loads. Field mon-itoring of roofs can provide a basic understanding for wind flow interactions with roofs. For residential (shingle) roofs, Peterka et al (1997)conducted a field model study and updated the ASTM D7158 test method. Limited studies were conducted on full scale test facility at Texas
Tech University (McDonald et al., 1991) on mechanically attached and ballasted single ply roofing systems. However, the questions have not been investigated or addressed for the com-mercial roofs and some of them are as follows:
How to quantify the difference in the wind loads between rigid versus flexible roofs? What is role of the roof membrane flexibility on the wind loads?
How to model the roof covering flexibility and maintain boundary layer flow in the wind tunnel without introducing Reynolds number effect?
As part of the SIGDERS, a long term project has been initiated at the NRC, to collect field performance of commercial roofs in three locations across North America, (1) Ottawa – Cana-da (2) Mt Pleasant – USA and (3) Rialto – USA. This paper presents data from the Ottawa Site.
2 MOCKUP SET UP AND WIND MEASUREMENT
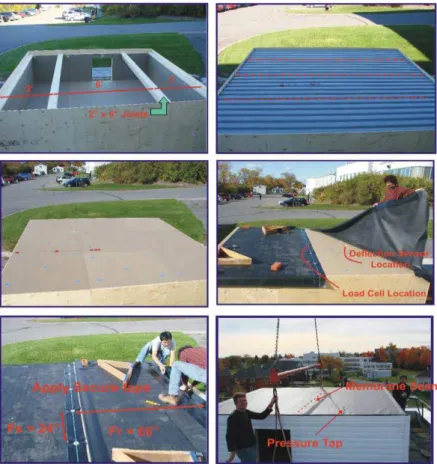
In Ottawa, the field performance study was conducted on two roof mock ups. The roof mock-ups were of size 3.7 m x 3.7 m (12 ft x 12 ft) and were constructed to replicate the field con-struction of the FRS. Mockup 1 had PVC flexible roof membrane and mockup 2 had EPDM. In addition to the membrane, both the mockups comprised of 50 mm (2 in) thick polyisocyanurate insulation boards that were fastened to the 22 Ga steel decks. The EPDM membrane layout had a fastener row spacing (Fr) of 1470 mm (58 in), while the PVC was designed with Fr of 1670 mm (66 in). Both the EPDM and the PVC membranes were fastened to the steel deck with fas-teners and plates at a fastener spacing of (Fs) 610 mm (24 in). However, the EPDM membrane seams were overlapped with primed dual sided secure tape while the PVC seams were one sided hot air weld. Figure 1 shows the typical construction of EPDM mockup.
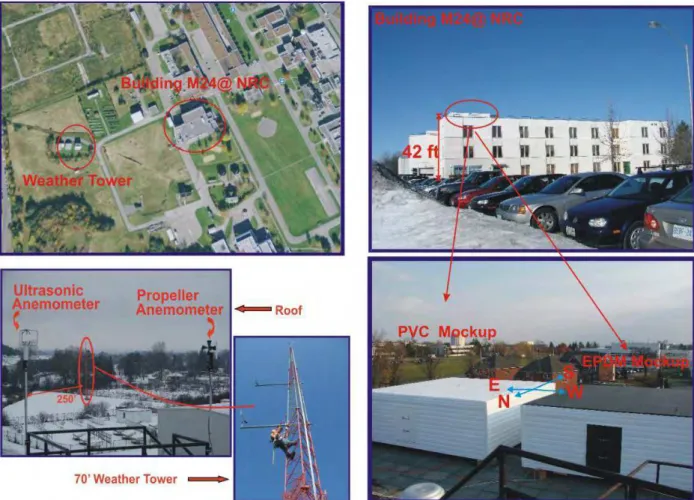
The two constructed mockups were placed on the south side roof of an NRC office building whose roof height is 13 m (42 ft) resulting mockups roof elevation of 14 m (47 ft) from the ground level. Figure 2 gives the impression of the surrounding exposure of NRC and the wind measurement coordinates. As per the National Building Code of Canada (NBCC, 2010), the exposure can be classified as “rough or urban” exposure. As shown in Figure 2, wind mea-surements were made two locations: one at a free standing weather tower that is located further west of the building at a distance of about 61 m (200 ft) in the building upstream at two differ-ent elevations of 6 m (20 ft) and 9 m (30 ft) using propeller type wind anemometer. The other on the building top, where two types anemometers - propeller and ultrasonic were placed side by side at a height of 2.7 m (9 ft) above building roof. Each mockup was equipped with two differential pressure transducers to quantify the wind induced suctions on the membrane sur-face. To measure the membrane deformation each mockup is fitted with an ultrasonic deflec-tion sensor, and to measure the fastener load transferred by the deflected membrane to the steel deck load cells were installed on each mockup. Details of the instrumentation, sensor accuracy and data collection software were documented elsewhere (Usama et al., 2010).
Figure 2: Site exposure of roof rocks and wind instrumentation
At the free standing weather tower, the wind data was recorded at a sampling rate of 0.1 Hz (10 samples per second). On the building top where the roof mockups were placed, the wind and the wind induced response on the roofing system i.e. pressure, membrane deflection and fas-tener load were sampled at a frequency of 0.01 Hz (100 samples per second). The sampled data of 0.01 Hz was saved on hourly basis, and at the end of 24 hr period the maximum wind speed is verified with a preset threshold value. If the maximum wind speed is less than the threshold
wind speed, the data for that particular day is discarded; otherwise the sampled data is saved as minute averages for the 24 hr period for further analysis. The raw data (0.01 Hz) for those par-ticular hours where the wind speed is greater than threshold is also saved for further analysis. This threshold has been set to 35 mph, which was assumed low enough to gather a sufficient number of data.
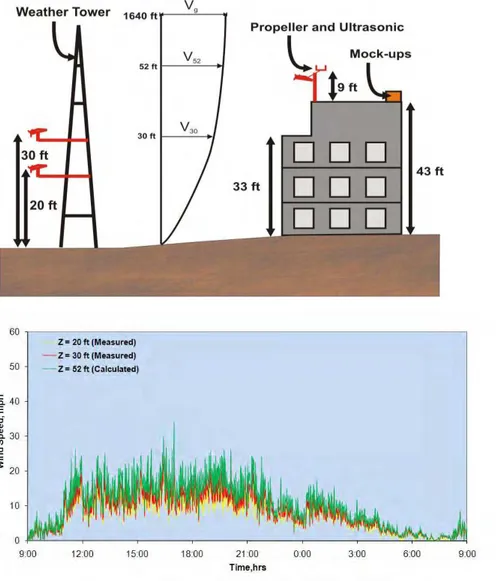
Verification of the measured wind data with the theoretical calculation was done following the conventional power law equation as shown in Equation 1:
(1) As shown in Figure 3, the free standing weather tower comprised of two wind propellers at 6 m (20 ft) [Z1] and 9 m (30 ft) [Z2] respectively. With the known wind speeds at these heights (V1 and V2), using equation 1 the flow exponent (α) was determined as 0.36. This confirms that the building exposure falls into the category of “urban or rough exposure”. Using the estab-lished gradient height (Zg) of 500 m (1640 ft) for the urban exposure, the gradient wind speed Vg was obtained. Then the free stream mean wind speed V52 at 16 m (52 ft) was calculated. Figure 3 shows the wind data (measured and calculated). At the free standing weather tower, the data clearly shows the relationship between the wind speed and height i.e. increasing wind speed with height.
Figure 4 compares the calculated free stream wind speed at Z=16 m (52 ft) with the measured wind speed at the roof top Z=16 m (52 ft). The comparison clearly indicates that calculated free stream wind velocity is lower than the measured data; however, it follows the trend of the measured data with statistical data showing a variation of 15% in the average. Therefore it can be said that the measured roof top wind speed at 52 ft is not influenced by the building flow separations. In other words, a tower height ranges from 1.2 to 1.5h (where h is the building height) was found to be an appropriate to measure undisturbed wind at the building roof.
Figure 4: Comparison of the wind speed: Roof Top versus Free Stream at z = 16 m (52 ft)
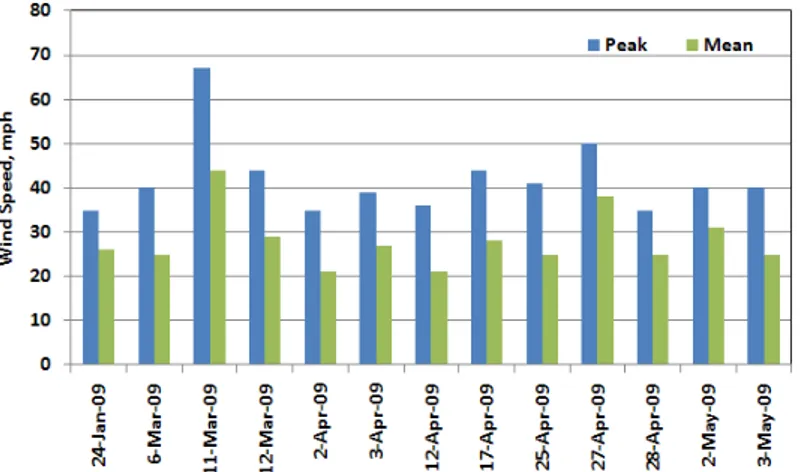
The field mockups were monitored for a period of one year starting from January 2009. With the preset threshold limit of 56 kmph (35 mph), 13 days recorded a maximum wind speed greater than the threshold. In other words, for the reminder 94% of time, the winds were less than 56 kmph (35 mph). As per the NBCC 2010, the reference wind speed for wind load calcu-lation is the hourly mean wind. Following that norm, the daily hourly mean wind speed was calculated by taking a 60 minute segment from the daily time history data. For each day, the time at which the max wind speed measured was used as the reference and the one hour time segment was selected by taking 30 minute data on either side of the reference. Figure 5 shows the statistical data of the peak and hourly mean wind. The highest wind speed measured during the monitoring period was 107 kmph (67 mph) with hourly mean of 71 kmph (44 mph). Figure 5 also shows the wind rose map and data clearly shows that the wind comes between 270 and 360 degrees i.e between W-N directions, with dominant wind direction being NNW.
Figure 5: Wind Parameters for the 1 Year Monitoring Period Statistics Average, mph RMS deviation Roof Top 13 8 Free Stream 11 7
3 CHARACTERIZATION OF WIND INDUCED RESPONSES
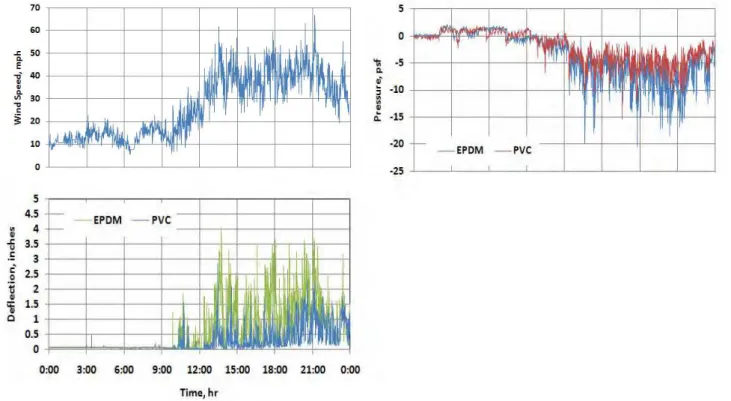
Figure 6 shows a typical 24 hr time history of the measured wind induced response on the EPDM and PVC mockups. For this particular day, the winds were mostly from NW-N direc-tion with a recorded peak speed of 107 kmph (67 mph). Note the average wind speed was 71 kmph (44 mph), resulting a gust factor of 1.5. On the EPDM system, the measured peak suc-tion pressure was 1 kPa (21 psf), while the PVC system recorded a peak sucsuc-tion pressure of 0.7 kPa (14 psf). The wind approaches from the NW-N direction and the induced suctions over the two mockups shows that the roof with EPDM membrane experienced higher fluctuations than the roof with PVC membrane. These higher pressure fluctuations on the EPDM membrane response clearly indicate the influence of membrane material density to the wind induced re-sponse. Similar observation is also noticed in the membrane deflections plotted in Figure 6.
Figure 6: Typical wind induced suction on the mockups and their response.
The measured suction pressures were converted into pressure coefficients referenced at the building roof height. The pressure coefficients time series is defined as:
(2) where Dp (t) is the differential pressure measured by the membrane pressure tap and the de-nominator being the dynamic pressure with ρ is the air density and V is the hourly mean wind measured at the roof top.
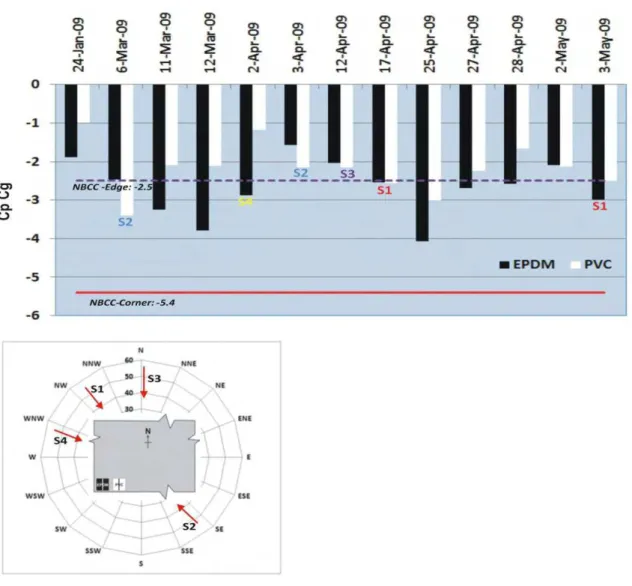
Figure 7 shows the peak pressure coefficients of the EPDM and PVC systems for all the 13 days. The highest Cp calculated on the EPDM system was -4.1; while on the PVC system it was -3.4. For roof slopes less than 7o and building height less than 60 ft (18 m), the National Building Code of Canada 2010 specifies a design pressure coefficient of -5.4,-2.5 and -1.8 for the corner, edge and field zone of the roof respectively. Based on the NBCC’s roof zone calcu-lation, the EPDM mockup can be said to be placed in the corner zone of the building, while the adjacent PVC mockup moves into the edge zone of the building. For the comparison purpose,
the respective corner and edge coefficients are also plotted in Figure 7, which clearly show that the conservatism of the code specifications in comparison to the measured EPDM and PVC da-ta.
Further analysis regarding data reproducibility and roofing systems response to wind loads is discussed by organizing the data into four scenarios –S1, S2, S3 and S4 as shown in Figure 7.
S1 is the scenario for data reproducibility. It would be ideal to have a constant wind speed from a particular direction for different days, and S1 can represents this case for April 17th and 3rd May. The peak wind for both the days was around 67 kmph (42 mph) with mean 43 kmph (27 mph), and the prevailing wind direction was WNW-NW-NNW. The calculated pressure coefficients were almost same for the PVC system, while there was a minimum difference for the EPDM system.
S2 is the scenario where the wind was streaming the windward side of the building at 1350 i.e. in the ESE-SE-SSE direction. As the PVC system was in the immediate locality of the approach wind, it recorded higher pressures compared to the EPDM system for both the days, which is reflected through the higher pressure coefficients.
Figure 7: Wind Induced Response of Roof Mock ups: Design Pressure Coefficients
In S3, the approach wind is from the N, which is parallel to the membrane seam. The peak wind speed was close to the threshold of 56 kmph (35 mph) with average of 40
kmph (25 mph). Both EPDM and PVC systems measured almost similar pressure coeffi-cients. Changing the wind angle to almost perpendicular (W-WNW-NW) to the mem-brane seams as in scenario S4 (2nd April), the EPDM system measured higher pressures compared to the PVC system, thus bringing the influence of membrane sheet orientation on induced pressures.
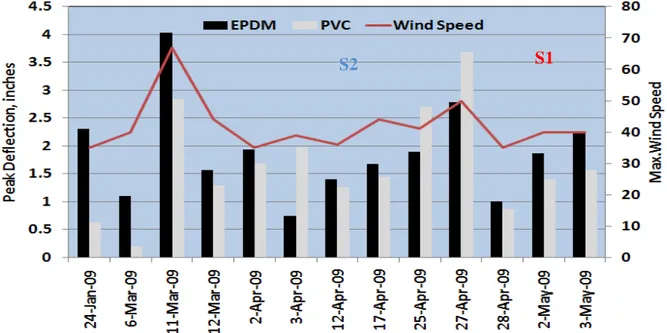
The pressure coefficients reflect the roof covering response under the wind dynamics. It should be understood that the membrane flexibility can also influence the induced pressures. Figure 8 plots the measured membrane deflection for the 13 windy days. Higher wind speeds caused higher membrane deflections on the both the mockups. The data also shows that apart from the wind speed, the wind direction was also was an influencing parameter in the mem-brane response. For example, take the scenario of S1 where the approach wind is coming from the WNW-NW-NNW, the maximum deflection measured on EPDM and PVC mockup was 57 mm (2.25 in) and 35 mm (1.5 in) respectively. With the same speed in S2, the wind changed the direction to ESE-SE-SSE i.e to 1800. This caused higher deflection of the PVC membrane compared to the EPDM mockup. Though both the systems had different fastener row spacing (FR) or sheet width [FR of EPDM = 1670 mm (66 in.), FR of PVC= 1470 mm (58 in.)], the measured deflection data indicates a very minimal changes. Thus it is clear that the membrane response is more depended on the flexible nature of EPDM (rubber) membrane, which had higher peak deflections compared to the PVC (polymeric) membrane.
Figure 8: Wind Induced Response of Roof Mock ups: Membrane Deflection
4 CONCLUSION
As part of the ongoing consortium SIGDERS, a major project to quantify the wind uplift per-formance of low slope commercial roofs is in progress at NRC. This paper presented a sum-mary of the study conducted on two roof mockups placed over the roof of a NRC office build-ing in Ottawa. This study provided the knowledge on field instrumentation, data collection process, sensors accuracy and their sensitivity. The measured data offered insight on the wind dynamics on commercial roofing systems. Field measured wind loads and their verification with wind tunnel studies may prove useful for evaluating existing wind load provisions and
ve-S1
rify the validity of the existing roof cladding wind uplift tests. To determine these wind loads, field monitoring of in-service roofing systems at the Mt Pleasant site and Rialto site are in progress.
5 ACKNOWLEDGEMENT
The presented research is being carried out for a consortium - Special Interest Group for Dy-namic Evaluation of Roofing Systems (SIGDERS). SIGDERS was formed from a group of partners who were interested in roofing design. These partners included:
Atlas Roofing Corporation, Canadian General-Tower Ltd., Canadian Roofing Contractors’ As-sociation, Carlisle SynTec Incorporated, Dow Roofing Systems, Duro-Last® Roofing, Inc., Firestone Building Products Company, GAF-Elk Materials Corporation, IKO Industries Ltd., Johns Manville Inc., National Roofing Contractors Association, OMG Roofing Products, Pub-lic Works and Government Services Canada, RCI, Inc., Sika Sarnafil, Soprema Canada Inc., Tremco Inc., and Trufast Corporation
6 REFERENCES
ASTM D7158, 2011. Standard Test Method for Wind Resistance of Asphalt Shingles. American Society of Test-ing Materials, West Conshohocken, PA,USA.
CSA A123.21-10, 2010. Standard Test Method for the Dynamic Wind Uplift Resistance of Membrane-Roofing Systems. IRC 891, Canadian Standards Association (CSA), Toronto, Ontario, Canada.
Baskaran, A., Murty, B., Pravett, D., 2010. Wind Effects on Commercial Roofs – North American Advance-ments. 13th IWEC Conference Proceedings, Amsterdam, Netherlands.
MacDonald, J.R.,1991. Full-Scale Testing of Roofing Performance”, Proceedings of 3RD International Sympo-sium on Roofing Technology. National Roofing Contractors Association (NRCA), Gaithersburg, Md. Peterka, J.A., Cermak, J.E., Cochran, L.S., Cochran, B.C., Hosoya, N., Derickson, R.G., Harper, C., Jones, J.,
Metz, B., 1997. Wind Uplift Model for Asphalt Shingles. Journal of Architectural Engineering 3(4), 147-155. NBCC, 2010. National Building Code of Canada. National Research Council of Canada, Ottawa, Canada.