Automated Reaction Mechanism Generation
Including Nitrogen as a Heteroatom
The MIT Faculty has made this article openly available. Please share how this access benefits you. Your story matters.
Citation Dana, Alon Grinberg et al. "Automated Reaction Mechanism Generation Including Nitrogen as a Heteroatom." International Journal of Chemical Kinetics 50, 4 (February 2018) © 2018 Wiley Periodicals, Inc
As Published http://dx.doi.org/10.1002/kin.21154
Publisher Wiley
Version Author's final manuscript
Citable link https://hdl.handle.net/1721.1/125783
Terms of Use Creative Commons Attribution-Noncommercial-Share Alike
1
Automated Reaction Mechanism Generation Including Nitrogen
as a Heteroatom
Alon Grinberg Dana, Beat Buesser,
†Shamel S. Merchant, William H. Green*
Department of Chemical Engineering, Massachusetts Institute of Technology, Cambridge, MA 02139, United States
† Present Address: IBM Research, Dublin, Ireland.
* Corresponding author. Email: whgreen@mit.edu; Fax: +1-617-324-0066; Tel: +1-617-253-4580
Abstract
The open source rate-based Reaction Mechanism Generator (RMG) software and its thermochemical and kinetics databases were extended to include nitrogen as a heteroatom. Specific changes to RMG and the mining of thermochemistry and reaction kinetics data are discussed. This new version of RMG has been tested by generating a detailed pyrolysis and oxidation model for ethylamine (EA, CH3CH2NH2) at ~1400 K and ~2 bar, and comparing it to recent shock tube studies. Validation of the reaction network with recent experimental data showed that the generated model successfully reproduced the observed species as well as ignition delay measurements. During pyrolysis, EA initially decomposes via a C–C bond scission, and the CH2NH2 product subsequently produces the first H radicals in this system via -scission. As the concentration of H increases, the major EA consuming reaction becomes H abstraction at the -site by H radicals, leading to a chain reaction since its product generates more H radicals. During oxidation the dominant N2 producing route is mediated by NO and N2O. The observables were found to be relatively sensitive to the C–C and C–N EA bond scission reactions as well as to the thermodynamic values of EA; thermodynamic data for EA were computed at the CBS-QB3 level
2
and reported herein. This work demonstrates the ability of RMG to construct adequate kinetic models for nitrogenous species, and discusses the pyrolysis and oxidation mechanisms of EA.
Keywords
Automatic reaction mechanism generation, Ethylamine, Fuel bound nitrogen, Oxidation, Pyrolysis, Chemical kinetics
3
1. Introduction
Nitrogen chemistry attracts great attention, especially in combustion science, because of the abundance of bound nitrogen in various conventional and alternative fuel sources. Despite decades of research on nitrogen reaction kinetics, summarized in seminal reviews by Miller and Bowman1 and by Dean and Bozzelli,2 detailed reaction mechanisms of many nitrogen-containing species remain a largely unexplored field.
Coal and crude oil contain significant amounts of fuel-bound nitrogen3–5 which, unless entirely removed prior to combustion, leads to NOx formation (predominantly NO and NO2) that are subject to stringent environmental regulations due to their contribution to smog and acid rain. De-nitrogenation units in crude oil refinery streams are also essential since nitrogen in heterocyclic compounds poisons many catalysts, especially those used in desulphurization units.6–8 Moreover, biomass-derived fuels contain a substantial amount of fuel-bound nitrogen.3
Nitrogen chemistry in combustion is also crucial for describing and predicting the behavior of nitrogenous fuel additives. For example, 2-ethylhexyl nitrate (2-EHN) is a commercially available cetane number improver which has been added to diesel fuels for decades to increase reactivity and improve engine fuel economy.9,10 However, 2-EHN additives could negatively impact diesel NOx emissions.10 Additionally, amine fuel additives are widely used to control fuel injector deposits,11 yet relatively little is known about their high-temperature chemistry. Furthermore, describing and predicting combustion processes of nitrogen-based fuels, such as ammonia12 and aqueous ammonium-containing monofuels,13–16 heavily depend on understanding nitrogen chemistry in combustion. Finally, nitrogen is present in its molecular form in air, the most common fuel oxidizer. While the above is only a partial list, it clearly justifies the incentive for pursuing
4
and generating complete yet efficient chemical kinetic mechanisms for nitrogen-containing species.
Recent experimental studies have investigated the reaction mechanisms and combustion properties of model nitrogen-containing compounds that represent different characteristic fuel types such as nitroethane,17 amines,18 or morpholine.19,20 However, detailed reaction mechanisms are only available for relatively small nitrogen-containing compounds composed of up to three or four heavy (non-hydrogen) atoms.18 For morpholine, only skeletal mechanisms describing the most important steps have been proposed.19,20 It would be desirable to be able to quickly construct kinetic models for any mixtures containing C/H/N/O compounds.
The open-source Reaction Mechanism Generator (RMG) software21,22 automatically explores possible intermediate species and elementary reactions for a given reacting mixture based on reaction families and libraries using a flux-based algorithm. Given initial temperature, pressure and reactant composition, the software estimates all the relevant reaction kinetics and thermochemistry; the generated model includes the most important species and reactions, where the “importance” is defined by the user using a tolerance parameter. The procedures implemented by RMG to expand the kinetic model were extensively discussed elsewhere.22–25 Previously, RMG has successfully generated reaction mechanisms for diverse C/H/O chemical systems such as butanol isomers,25,26 diisopropyl ketone,27 JP-10 jet fuel,28–30 and neopentane.31
The main objectives of the present work are to report upon extensions made to RMG and its thermochemistry and kinetics databases to account for reactive nitrogen species, and to show that RMG can successfully generate reasonable predictive kinetic models for pyrolysis and oxidation of nitrogenous systems. This makes RMG the first reaction mechanism generator to automatically generate models for nitrogen-containing systems (except RMG cannot yet model aromatic
5
compounds containing heteroatoms in the aromatic ring, that capability is under development). The extensions are applied and tested by generating a reaction mechanism for pyrolysis and oxidation of ethylamine (EA, CH3CH2NH2) and comparing the predictions to results of recent shock tube experiments.32 The EA molecule was chosen for this study since it contains important characteristic chemical bonds (i.e., C–C, C–H, C–N, and N–H bonds), it is a representative of aliphatic amines, and also serves as a model species for nitrogen-containing compounds found in fuel additives and biofuels.33
Previously key reactions of EA32–37 and EA derivatives38 were studied, yet a complete detailed kinetic mechanism for EA was until now absent from the literature. Specifically, an important initial decomposition reaction of EA, the C–C bond scission reaction, was missing from some works,36,37 or manually tuned to improve agreement with experimental data in others.32 The ab-initio model presented herein was generated automatically using RMG for EA concentrations of 500–2000 ppm and physical conditions of ~1400 K and ~2 bar. A similar model could be regenerated using RMG to be valid at different conditions.
2. Model
2.1. RMG algorithm development and database extension
The reaction mechanism reported herein was generated using the Python version of the Reaction Mechanism Generator software (RMG-Py) v2.1.0.21 Species thermochemistry was either determined by using the existing RMG’s thermochemistry libraries or estimated using the Benson’s group additivity method39 extended with the nitrogen group values derived by Ashcraft and Green40 computed at the CBS-QB3 level (the CBS-QB3 method41 is briefly described in Section 2.2). Kinetics of reactions involving nitrogen reviewed by Dean and Bozzelli2 were added
6
as a kinetic library to RMG. If the software finds a matching reaction within its libraries, these parameters are used; otherwise, RMG applies its reaction family templates to estimate rate coefficients. The Dean and Bozzelli2 nitrogen kinetics data was also used to enhance the rate rules of various RMG reaction families.
To correctly account for unimolecular pressure-dependent reactions and estimate pressure fall-off effects, RMG databases have been extended by adding characteristic vibrational frequencies for nitrogen-centered groups adopted from the literature.42 The modified strong collision approach43 was used for subsequent automatic pressure dependence calculations in RMG.44
Nitrogen is the first element included in RMG that commonly changes its valence: from monovalent (e.g., a terminal nitrogen on an azide) all the way to pentavalent (e.g., HNO3). Accordingly, the number of lone electron pairs of a nitrogen atom could vary between zero, one, or two. Consequently, RMG was extended to keep track of the number of lone electron pairs as well as unpaired electrons on all atoms. RMG has also been extended to recognize two additional classes of resonance structures that are specific to lone electron pairs (Table 1): (a) the resonance of a nitrogen atom between a single–triple bonded structure and two double bonds, as in N2O; and (b) the interaction between a lone electron pair and an adjacent radical site, as in NO2. In RMG, the lone electron pair / radical resonance class has so far been limited to nitrogen adjacent to oxygen atoms because of the current paucity of thermochemical properties in the RMG database for carbenes and carbanions.
2.2. Quantum chemistry calculation
Rate coefficients were calculated at the high pressure limit using the conventional transition state theory. The energy barrier ∆E‡ was calculated using the CBS-QB3 method. This composite method combines low level geometries and zero-point vibration energies with higher level
7
calculations to obtain relatively accurate total molecular energies.41 Partition functions were obtained using the B3LYP/6-311G(2d,d,p) level of theory, while scaling the obtained frequencies by 99.8%.45 For addition reactions the hybrid meta-GGA BMK/6-311G(2d,d,p) method was used for the partition functions.
To account for the anharmonicity of low-frequency torsional vibrations, internal rotations of both stable species and transition states were treated as one-dimensional hindered rotors (1D-HR). The 1D-HR partition function uses the energy levels obtained from solving the exact Schrödinger equation for the 1D potential energy surface, calculated from relaxed scans of the corresponding dihedral angles in 10° increments at the B3LYP/6-31G(d) or BMK/6-31G(d) levels of theory. CBS-QB3 enthalpies of formation were adjusted using the bond-additivity corrections (BAC) recommended by Petersson et al.46
2.3. Model generation
The mechanism was generated using RMG-Py21,22 incorporating the above mentioned algorithm and database extensions. The model was built using RMG’s thermodynamic libraries including updated parameters for small species of the H2/O2 system.47 An EA kinetic library (Table 2) was used and added to the software libraries. RMG calculated k(T,P) expressions from relevant k(T) expressions using procedures and approximations detailed previously.44 The selected tolerance for the network generation was 0.02,48 as a tighter error tolerance (0.01) did not add new nitrogen chemistry to the model. The model was generated for ~1400 K and 1.2–2.1 bar to be valid at the measured experimental conditions. Simulations of the model as well as rate of production calculations were carried out in Chemkin-ProTM 49 in an adiabatic homogeneous batch reactor. Ignition delay times were calculated using Cantera,50 and sensitivity coefficients were generated by RMG.
8
The final model consists of 79 species and 1771 reactions and is available both as RMG and as Chemkin input files in the supplemental material. A species dictionary is also supplied.
3. Results and discussion
3.1. Ab initio calculations
Most of the small molecule reactions that are relevant for EA pyrolysis and oxidation have been documented by Dean and Bozzelli.2 However, the complete initial decomposition reactions and the various possible pathways leading to the initial radical pool formation in this system have not been documented before. As these are very important to describe the decomposition of EA, we studied these reactions using the above-mentioned methods.
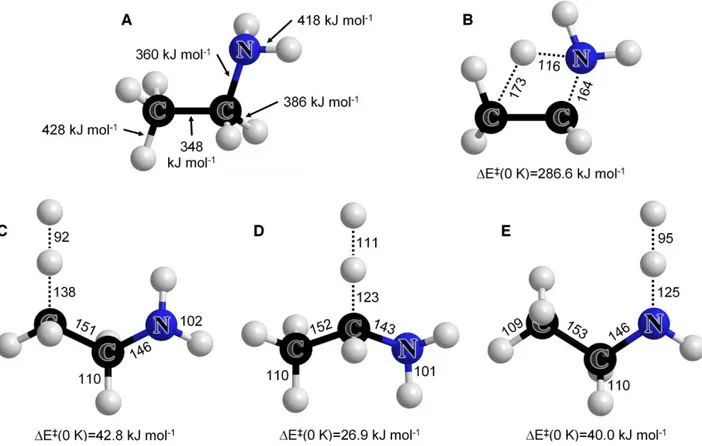
Figure 1. EA BDE values and geometries of selected TS. Geometries were calculated at the B3LYP/6-311G(2d,d,p)
9
barriers for (B) the 1,2 elimination of ammonia, and for the three hydrogen abstraction reactions by the H atom: (C) from the -site, (D) from the -site, and (E) from the N-site in EA.
The weakest bond in EA is the C–C bond, having the lowest bond dissociation energy (BDE) of 348 kJ mol-1. This is 12 kJ mol-1 lower than the BDE of C–N, and 25–80 kJ mol-1 lower than BDE values for H atoms in EA (Fig. 1 A). EA is known to undergo four possible elimination reactions; while most elimination routes have an activation energy greater than 420 kJ mol-1,37 the 1,2-elimination reaction yielding NH3 has a relatively low activation energy of 286.6 kJ mol-1. This reaction, which proceeds via the transition state (TS) in Fig. 1 B, is considered the most significant elimination reaction of EA. The relatively low barrier for this elimination makes it a significant unimolecular decomposition channel at most conditions and a non-negligible competitor to the main radical decomposition pathways at higher temperatures.
The calculated BDE values (Fig. 1 A) suggest that a radical mechanism in EA pyrolysis will be initiated primarily by the C–C bond scission reaction. Once the radical pool has been generated, EA undergoes various H abstraction reactions. The hydrogen atom bonded to the α-carbon has the lowest BDE of all H atoms in EA (386 kJ mol-1). The BDE for hydrogen atoms bonded to nitrogen or β-carbon atoms are 32 and 42 kJ mol-1 higher, respectively. Hence, hydrogen abstraction reactions from EA are expected to occur preferably at the α-site.
The lowest barrier for H abstraction reactions in EA was found to be at the α-site (Fig. 1 C– E), as expected from the BDE values in Figure 1 A. The barriers for H abstraction at the nitrogen or the β-site are computed to be significantly higher. The barrier heights are also reflected in the transitional bond lengths between the C or N atoms in EA to the respective abstracted H atom; while abstraction from the -site increases the bond length by 11.8% at the TS, the bond lengths increase by ~24–27% for abstraction from the nitrogen and the β-carbon sites. This large difference
10
is mainly due to the adjacent lone electron pair of the N-atom, which stabilizes the radical that results from the α-site H abstraction.
Previously calculated H abstraction reaction rates were adopted from literature (Reactions 1– 12).33,35 Rates of other H abstraction (Reactions 13–17), β-scission (Reactions 18–24), and intramolecular hydrogen transfer (Reactions 25–26) reactions, as well as the 1,2-elimination reaction yielding NH3 (Reaction 27) were calculated as part of the present work (Table 2). It is noted that Reactions 18–27 are pressure dependent, and Table 2 lists their high pressure limit rate only; the k(T,P) rates were calculated by RMG as described above.
3.2. Ethylamine pyrolysis
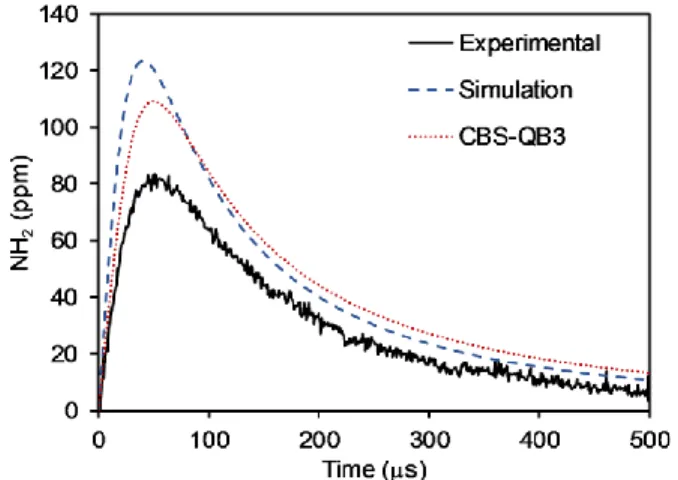
The RMG-predicted NH2 concentration profile during EA pyrolysis was compared to experimental shock tube values as reported by Li et al.32 (Fig. 2). The model reproduced well the rise and fall of NH2 levels, and predicted a peak concentration about 50% higher than the experimental peak value. The times at which the concentrations peaked were relatively close: 42 and 45 s for the simulated and experimental profiles, respectively. Overall, the generated model captures well the NH2 concentration profile during EA pyrolysis, and the overestimation of the peak concentration is reasonable.
11
Figure 2. Concentration profiles of NH2 vs. time during pyrolysis of 2000 ppm EA in Ar at 1428 K and 1.23 bar. The estimated experimental uncertainty is in the range of 10–30%.51,52
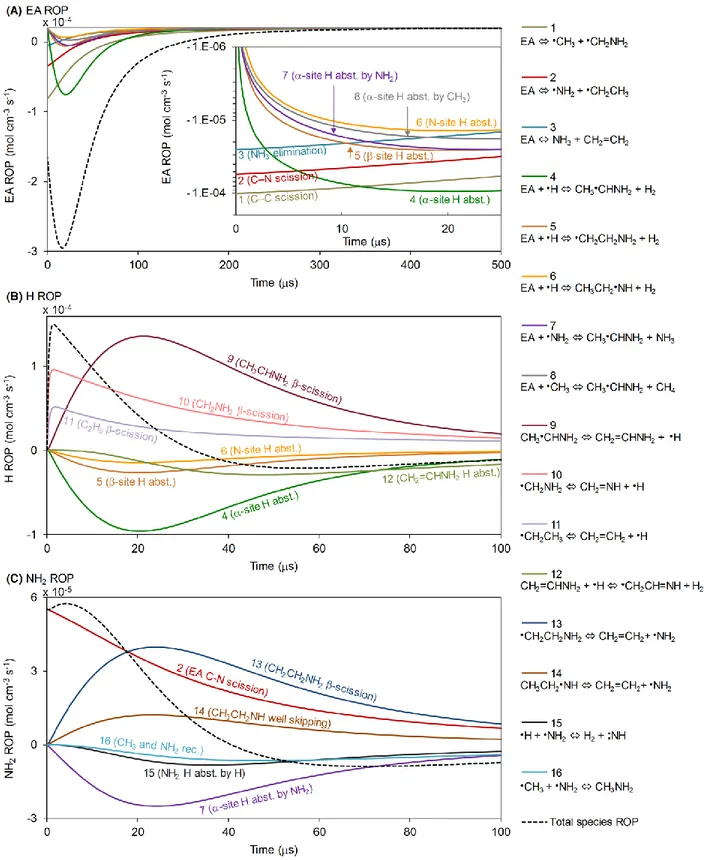
A rate of production (ROP) analysis for EA (Fig. 3 A) indicates that during the first few microseconds of pyrolysis, prior to the establishment of the radical pool, EA primarily decomposes via C–C and C–N bond scission reactions, as well as the 1,2-elimination reaction yielding NH3. The fastest unimolecular decomposition reaction is the C–C scission, in agreement with the BDE analysis above (Fig. 1 A).
During the first 10 s, while the EA C–C scission is the fastest decomposition route, H radicals are mainly being produced by -scission of CH2NH2, a product of the EA C–C scission (Reaction 10 in Figs. 3, 4). As the radical concentration in this system increases, rates of EA H abstraction reactions, mainly by H atoms, become significant, and the dominant EA consumption route becomes the -site H abstraction by H, which is also the fastest H radical consumption pathway in this system (Reaction 4). The higher reactivity of the H bonded to the -carbon relative to other H atoms in EA is also in agreement with the BDE analysis (Fig. 1). The EA -site H abstraction reactions produce CH3CHNH2 radicals, which later become the main source for H radicals in the system (Reaction 9). Since H radicals induced the formation of the -site radicals in the first place, and are formed at a significant rate through this pathway, a chain reaction is formed, leading to an accelerated consumption of EA and to the formation of CH2=CHNH2 (Figure 4). The EA C–N scission reaction (Reaction 2) is the major NH2 source in the system at early times, while -scission of the -site radical CH2CH2NH2 (Reaction 13) becomes the dominant NH2-generating reaction at later times as the concentration of radicals increases.
12
Figure 3. Reactions with highest flux for (A) EA, (B) H, and (C) NH2 at the conditions in Fig. 2. The inset in (A) is a semi-log representation for shorter times.
13
An EA pyrolysis diagram is proposed based on reactions’ ROP (Fig. 4). The diagram illustrates the important chain reaction of EA H abstraction by H at the -site followed by a -scission reaction generating H radicals (Reactions 4, 9). The branching ratio of the major H abstraction reactions of EA could also be qualitatively inferred from this diagram, showing a clear tendency to produce the -site radical. All EA radicals formed by H abstraction have a relatively small quasi-steady state concentration in the system since their production is rate limiting.
The pyrolysis diagram in Fig. 4 represents the major fluxes in the systems at 20 s. At this point in time, the system is close to the peak rate of small radical generating reactions (Fig. 3 B, C), yet the three major initial EA decomposition pathways are still significant.
14
Figure 4. Major reaction pathways in pyrolysis of EA at 20 s at the conditions in Fig. 2. Arrow widths correspond
logarithmically to respective reactions’ ROP. The diagram captures at least 95% of each species consumption pathways; reaction pathways of species with a total consumption rate lower than 10% of the respective production rate were not explored. Major H and NH2 formation routes are highlighted with circles. Pathways marked with an asterisk (*) are pressure-dependent well-skipping isomerization + -scission sequences. Numbers in parenthesis correspond to reaction numbers from Fig. 3.
Many of the channels lead to HCN formation. Both the C–N scission and the NH3 elimination reactions mainly lead to the formation of C2H4 while the C–C scission leads to CH2NH. The pathways via the various H abstraction reactions all involve a more interesting chemistry with more steps. The -site radical leads to the formation of almost equimolar amounts of HCN and CH4 as well as some unsaturated C/C/N structures such as CH2CNH and CH3CN. The -site and N-site radicals, on the other hand, mainly produce C2H2, while the N-site radical produces some HCN as well. Both -site (through CH2CHNH2) and N-site radicals may also be converted into the -site radical. N2 is formed by the NH2 + N reaction.2
15
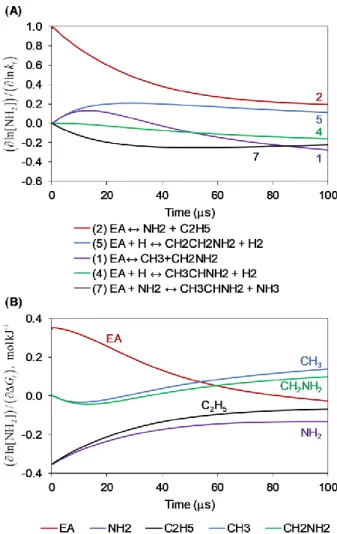
Figure 5. (A) Kinetic and (B) Gibbs Energy change normalized sensitivity coefficients of NH2 at the conditions in Fig. 2 showing the top five influential reactions and species during the first 100 s. Reaction numbers correspond to those from Fig. 3 for consistency.
The branching ratio of EA decomposition is crucial in determining the amount of NH2 formed, as can be seen from the top five reactions to which NH2 levels are sensitive (Fig. 5 A). The two major NH2 production routes, C–N scission and -scission of the -site EA radical (Figs. 3, 4), are reflected in the sensitivity analysis either directly (Reaction 2) or indirectly (Reaction 5). The system is also sensitive to the EA H abstraction at the -site by NH2 (Reaction 7), the major NH2 consumption pathway. The NH2 concentration was most sensitive to the rate of the C–N bond scission reaction, with a normalized sensitivity coefficient in the order of one at relatively early times when this reaction dominates NH2 production.
16
The sensitivity analysis suggests that a better agreement, if desired, between simulated and experimental NH2 levels (Fig. 2) could be obtained by decreasing the uncertainty in rates of major reactions that produce and consume NH2. While EA H abstraction reaction rates by H and NH2 are known at the CBS-QB3 level,33 both C–N and C–C scission reaction rates were estimated by RMG. RMG was recently trained with various C–C scission reactions in hydrocarbon systems calculated at the CASPT2/cc-pvdz level using variable reaction coordinate transition state theory (VRC-TST).53 However, due to insufficient literature data, RMG's estimates of bond scission reaction rates involving nitrogen currently have much greater uncertainties. Since the system discussed herein is sensitive to the C–N scission, it would be beneficial to calculate the rates of reactions of that type. This, however, does not interfere with the present work's objective of demonstrating RMG's ability to generate reasonable models involving reactive nitrogen.
The NH2 concentration was found to be relatively sensitive to the G value of EA, as well as to the products of both the C–C and C–N bond scission reactions (Fig. 5 B). In fact, the normalized sensitivity coefficients of each scission reaction product pairs resemble each other, yet slightly deviate at later times due to the importance of the smaller radicals (i.e., NH2, CH3) for EA H abstraction reactions. The G sensitivity coefficients for C2H5 and NH2 have relatively large absolute values at early times that gradually decrease, similarly to the sensitivity to Reaction 2 (Fig. 5). This decreasing trend stems from the decreasing significance of the C–N scission reaction in NH2 generation (Fig. 3 C).
The sensitivity to the G values of the C–C scission reaction products is negative at first, yet changes its trend after ~10 s and becomes positive, which is consistent with the sensitivity to the rate of Reaction 1 (in an opposite sign). This interesting shift in trends is explained by the role of
17
the C–C scission reaction in the generation of NH2. At first H radicals are mainly produced from CH2NH2, and they are important agents in EA H abstraction reactions including its conversion into the -site radical which is a major source for NH2. However, once the radical pool is established, the chain reaction via the -site radical becomes the dominant source for H radicals (Fig. 3 B), and the C–C scission reaction consumes EA via a pathway which is not constructive to the fastest NH2 generation route.
The sensitivity of NH2 to the G value of EA interestingly decreases with time and becomes slightly negative. The role of EA in NH2 generation is clear, and as expected the sensitivity coefficients to its G value are positive at early times. However, since EA is involved in the major sink of NH2 as well (Reaction 7), the trend of these sensitivity coefficients shifts over time and changes its sign. The thermodynamic parameters of the CH3, NH2, C2H5, and CH2NH2 radicals in the current model are given at the CCSD(T)F12A/cc-pVTZ-F12//B3LYP/6-311++g(d,p) level of theory, taken from an RMG library. The thermodynamic parameters of EA, on the other hand, were taken from Yaws’ Property Data for Chemical Engineers and Chemists handbook;54 further calculations and the uncertainty of these values are discussed in Section 3.5.
3.3. Ethylamine oxidation
The predicted concentration profiles of NH2 and OH radicals during EA oxidation were compared to respective experimental shock tube values under slightly lean fuel conditions (94) as reported by Li et al. (Figure 6).32 Measurements of OH radicals were conducted in a more diluted atmosphere than NH2 measurements to reduce the temperature rise, and consequently reduce the uncertainty in the OH absorption coefficient which is sensitive to the temperature.
18
Figure 6. Concentration profiles of selected radicals during EA oxidation. (A) NH2 concentration vs. time during oxidation of 2000 ppm EA with 8000 ppm O2 in Ar at 1441 K and 2.13 bar. (B) OH concentration vs. time during oxidation of 500 ppm EA with 2000 ppm O2 in Ar at 1399 K and 1.96 bar. The estimated experimental uncertainty for NH2 and OH is 10–30%51,52 and 12%55, respectively.
The model adequately reproduced the rise and fall in NH2 concentration (Fig. 6 A), and predicted a peak NH2 concentration ~60% higher than the experimental peak value. These peaks were observed at relatively close times of 21 and 25 s in the model and experiment, respectively. The model over-predicted the small pre-ignition OH concentration rise, yet captured exceptionally well the OH time profile during ignition as well as the post ignition OH consumption rate (Fig. 6 B). Overall, the mechanism successfully reproduced the NH2 and OH concentration profiles during EA oxidation. The following analysis and discussion relate to the conditions at which the EA oxidation experiment monitoring NH2 was conducted (Fig. 6 A), i.e., 2000 ppm EA, 8000 ppm O2 in Ar at 1441 K and 2.13 bar.
19
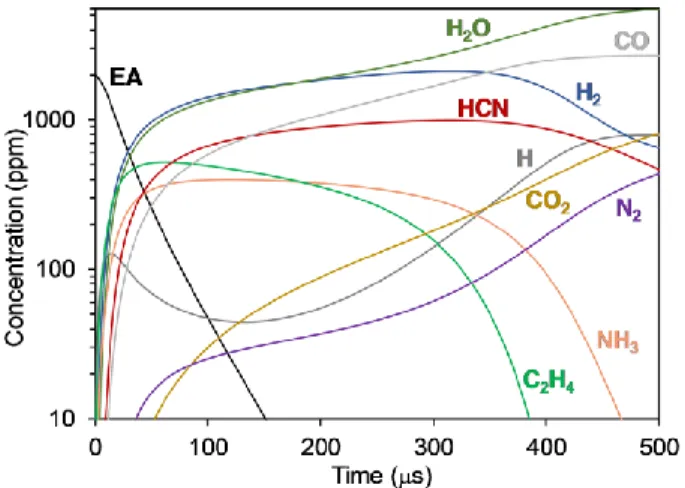
Figure 7. Simulated concentration profiles at the conditions in Fig. 6A during EA oxidation of top 10 species with
the highest concentration except for Ar and O2.
The concentration of EA decreased exponentially, and at 100 s its conversion reached ~98%. The major products of the first 100 s, prior to ignition, are H2O, H2, HCN, CO, NH3, and C2H4. As the oxidation proceeds, H2, HCN, NH3, and C2H4 are consumed, while the concentration of H radicals and N2 increase by an order of magnitude (Fig. 7).
During the first 100 s, H radicals are mainly being produced and consumed via similar pathways as shown and discussed above (Fig. 3 B), with the exception of the important branching reaction H + O2 = OH + O, which significantly consumes H radicals (Reaction A3, Fig. 8). After a chemical induction time required to build the degenerate branching step (~350 s), the system ignites as seen from the increased production and consumption rates of H (Fig. 8 A), consuming NH3 and C2H4 (Fig. 7).
The major NH2 production pathways during the first 100 s resemble those discussed above in the pyrolysis case, namely EA C–N scission which dominates at early times followed by -scission of the -site radical CH2CH2NH2, as well as the well-skipping reaction consuming the N-site radical CH3CH2NH (Reactions B1-B3, Fig. 8). Other than attacking EA principally at the -site (Reaction B4) to form NH3, NH2 is also consumed by reacting with HO2 and O radicals
20
(Reactions B5, B8). During ignition, the NH3 formed initially is converted back into NH2 by the OH radicals (Reaction B7). The NH2 formed in this way is consumed a little later, mainly by reacting with NCO radicals (Reaction B6).
21
22
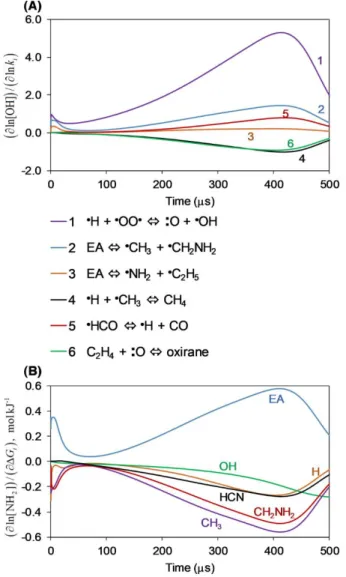
Initially OH radicals are generated via H + O2 or H + HO2 (Reactions C2, C4, Fig. 8), while the main OH consumption routes are -site and N-site H abstractions from EA (Reactions C3, C5). The relatively high sensitivity of OH levels to the EA C–C scission reaction (Fig. 9 A) is due to the role of this scission reaction in determining the initial H concentration in the system, which is essential for the major OH producing reactions. This reaction rate was estimated, and errors in its rate may cause the OH over-prediction by the model at early times (Fig. 6 B).
During ignition, OH participates in classic and well-studied47 small radical chain branching and propagation reactions (Reactions C1, C2, C6, Fig. 8). Its major source is the main branching reaction, H + O2 = OH + O, to which it is also highly sensitive (Fig. 8 C, Fig. 9 A). Since H is the limiting factor in this reaction, OH levels are expected to be relatively sensitive to H-generating reactions. However, the fastest H-producing pathway at these conditions (H2 + OH) consumes one OH radical per OH radical generated from the H product via the main branching reaction. Since the rates of these two reactions are the same order of magnitude at these conditions, OH levels are relatively insensitive to this pathway. It is noted, however, that not all H radicals react this way. The reaction with the second highest flux generating H radicals at these conditions is HCO = H + CO, to which OH levels were indeed found to be sensitive during ignition. During ignition, OH levels were also sensitive to two important chain terminating reactions, H + CH3 = CH4 and C2H4 + O = oxirane, with a negative sensitivity coefficient (Fig. 9 A). Oxirane (cyclic C2H4O) is indeed a known isomer on the C2H4+O surface.56 This experimentally observed but spin-forbidden product forms via intersystem crossing to the singlet surface. At the relatively high temperatures and low pressures considered in this study, reactions via the spin-allowed triplet surface are expected to be formed at rates about 3x higher than the singlet products.57 Here, on the other hand, during the automatic exploration of the pressure-dependent network, RMG predicted the
spin-23
forbidden products (oxirane, CH3+HCO) to be generated at a rate faster by about 3x than the spin-allowed products (CH2+CH2O, and CH2CHO+H). This branching ratio eventually affects the predicted ignition delay in this system. Teaching machines to correctly predict rates involving intersystem crossing remains a challenge, mainly due to the variable position of the crossing point.
Figure 9. (A) Kinetic and (B) Gibbs Energy change normalized sensitivity coefficients of OH showing top six
influential reactions and species during the time ranges 0-100 s and 200-500 s.
The G values that affect the concentration of OH the most are of OH, H, species participating in the initiating C–C scission reaction (EA, CH3, CH2NH2), and HCN (Fig. 9 B). The role of the EA C–C scission reaction in the system and its effect on OH was discussed above. The effect of the G value of HCN on the OH levels may stem from the two reactions H2 + O = H + OH and
24
HCN + O = H + NCO competing for O radicals; if HCN was more reactive, less OH would form. In this model, the thermodynamic values of CH3, CH2NH2, and HCN come from CCSD(T)-F12a calculations. The thermodynamic parameters of EA, on the other hand, were taken from Yaws’ Property Data for Chemical Engineers and Chemists handbook;54 further calculations and the uncertainty of these values are discussed in Section 3.5.
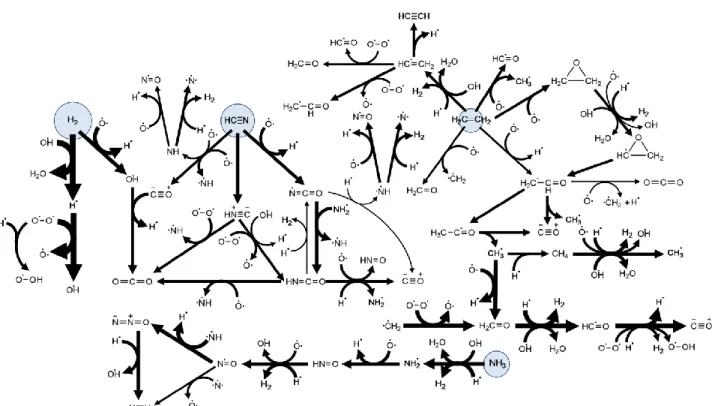
Figure 10. Major reaction pathways in oxidation of EA at 350 s. Arrow widths correspond logarithmically to
respective reactions’ ROP. The diagram captures at least 95% of each species consumption pathways; reaction pathways of species with a total consumption rate lower than 10% of the respective production rate were not explored. Reactions of C2H3 with O and OH are not presented for simplicity. Circles highlight the reactive species with highest concentration (as seen in Fig. 7) and their diameter corresponds logarithmically to their concentration.
Figure 10 shows a qualitative flux diagram of significant reactions during ignition (at 350 s). Four branches that are interconnected by small radical species are shown, each branch stems from one of the high concentration reactive species in the system during ignition, H2, HCN, NH3, or C2H4. Since EA is an N-containing biofuel model molecule, it is interesting to note its nitrogen transformation routes leading to the formation of benign molecular nitrogen. The major identified pathway forming N2 involves H abstraction from HNO and subsequent reaction between the
25
formed NO with NH, yielding N2O. The latter eventually produces N2 by reacting with an H atom. NO also forms N2 by reacting with an N atom.
3.4. Ignition delay
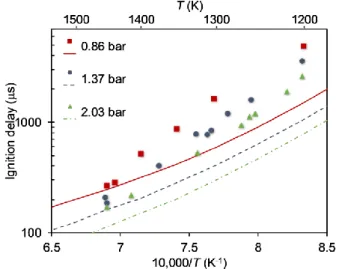
The predicted ignition delay times during EA oxidation were compared to respective experimental shock tube values under stoichiometric conditions at the 1200–1450 K and 0.86– 2.03 bar temperature and pressure ranges, respectively, as reported by Li et al.32 (Figure 11). Since the experimental ignition delay measurements were conducted under different composition, temperatures, and pressures than the model reported above, a new mechanism was generated using RMG to be valid at these new conditions. The ignition delay time is defined herein as the time from the start of the simulation to the global maximum of OH concentration.
Figure 11. Ignition delay times for a stoichiometric mixture (defined by the complete reaction CH3CH2NH2 + 3.75O2 = 2CO2 + 3.5H2O + 0.5N2) of 1.07% EA and 4% O2 in Ar for three pressures vs. reciprocal temperature. Experimental and simulated data are denoted by symbols and lines, respectively.
As expected, the ignition delay times in both the model and experimental results decreased as the pressure or temperature increased. The model under-predicted the ignition delay times at low temperatures by up to a factor of three, which is reasonable for an automatically-generated model
26
without any refinement, and successfully predicted the high temperature (T ≥ 1400 K) values with a discrepancy lower than a factor of 1.5. The ignition delay time trend with pressure is also in agreement between the model and the experimental values. Overall, the model predictions semi-quantitatively match the experimental results of this global parameter, which supports the model’s reliability.
3.5. Updated ethylamine thermodynamic values
Thermodynamic values of EA in the models presented in this work were taken from an RMG library of C\H\N containing species. In this library, the EA H and Cp values were taken from Yaws' Critical Property Data handbook,54 while the S value was derived from a DFT calculation (Table 3). The Yaws value for Hof differs from the NIST webbook value59 by ~10 kJ mol-1. Since the model’s predictions were relatively sensitive to the Gof values of EA (Figs. 5 B, 9 B), EA thermodynamic values were computed at the CBS-QB3 level, with frequencies and force matrix calculated at the B3LYP/CBSB7 level, and hindered rotors at the M06-2X/cc-pVTZ level. The reported 2 dispersion of the CBS-QB3 method is 13.0 kJ mol-1.58
All enthalpy values are well within the 2 dispersion of the CBS-QB3 value (Table 3). Constant pressure heat capacity values were similar throughout the different sources (deviated by ~3% or less). Nevertheless, the entropy value from Yaws' Critical Property Data handbook of -0.04 J mol -1 K-1 substantially deviates from the narrow 283.42–284.0 J mol-1 K-1 range of all other sources.
This egregious disagreement in S suggests that either Yaws' source was using a different standard state, or that its entropy value is either an unsuccessful estimate, or perhaps an editing error; it also leads to a discrepancy in the calculated Gof.
27
It is worth noting that group additivity values were in close agreement with the CBS-QB3 data, emphasizing the advantage of this simple predictive method. It is also noted that the NIST H is based on the liquid phase standard enthalpy change of formation from a work published in 1907,60 which has no reported error bars, and the measured enthalpy change of vaporization, which has an uncertainty of ±2 kJ mol-1.59
The CBS-QB3 calculated values are in fair agreement (within 5 kJ mol-1) with values used throughout this work (RMG’s C/H/N library), and the minor differences had a modest impact on the model predictions (Fig. 12).
Figure 12. Concentration profiles of NH2 vs. time during pyrolysis of 2000 ppm EA in Ar at 1428 K and 1.23 bar, comparing experimental results,32 model predictions using the EA thermodynamic values from the RMG CHN library, and model predictions using the EA thermodynamic values from the CBS-QB3 calculation.
4. Conclusions
This work reports the first automatically generated mechanism for pyrolysis and oxidation of an organic nitrogen-containing species. The model was generated using Reaction Mechanism Generator (RMG), an open source software package for automated rate-based mechanism generation. As part of this work, RMG’s thermochemistry groups, kinetic rate rules, and kinetic
28
libraries were extended to account for reactive nitrogen species. Additionally, RMG was also expanded to recognize two nitrogen resonance classes specific for lone electron pairs.
Pyrolysis and oxidation of ethylamine (EA) were studied, and important reaction pathways in the reaction network were identified. The model was generated for temperature and pressure ranges of 1400–1440 K and 1.2–2.1 bar, respectively, and was in satisfactory agreement with experimental shock tube observations of NH2 and OH as well as ignition delay times.
The weakest bond in EA is the C–C with a dissociation energy value of 348 kJ mol-1, and the weakest C–H bond is at the -site with a dissociation energy value of 386 kJ mol-1. During pyrolysis, prior to the establishment of the radical pool, EA decomposition is dominated by the C– C bond scission reaction, while at later times H abstraction at the -site by H radicals becomes the dominant EA consuming reaction. The H radicals initially originate via -scission of CH2NH2, which is a product of the EA C–C bond scission reaction. At later times H radicals are generated at a higher rate via -scission of CH3CHNH2, which is a product of the EA -site H abstraction reaction. At early times, NH2 is formed via the EA C–N bond scission reaction, while after the establishment of the radical pool it is generated via -scission of the CH2CH2NH2 radical, which is a product of the EA -site H abstraction reaction.
During oxidation, at first the EA concentration diminishes and four major reactive species are formed, H2, HCN, NH3, and C2H4. After a chemical delay time the mixture ignites and H2/O2 ignition chemistry dominates, accompanied by inflation in the H, O, and OH concentrations. As is typical of high temperature oxidation, the major branching reaction is O2 + H OH + O.
During pyrolysis conditions, N2 was mainly generated via NH2 + N, whereas during oxidation its production rate was significantly higher and was mediated by NO and N2O. Reaction network
29
diagrams were constructed for pyrolysis and oxidation conditions, illustrating major nitrogen transformation routes and important chain reactions.
The model predictions were found to be relatively sensitive to the EA C–C and C–N scission reactions, as well as to the thermodynamic values of EA. While the latter were calculated as part of this work at the CBS-QB3 level and uncertainty boundaries were given, both scission reactions were estimated by RMG. Although the software was recently trained using high-level calculations for various C–C scission reactions, calculating the rates of these two reactions is expected to improve the agreement between the model and the experimental observables. However, it is worth noting that even without providing accurate rates for these specific reactions or thermodynamic values for EA, RMG’s predictions using existing database libraries, kinetic rate rules, and group additivity values are reasonable and in semi-quantitative agreement with the experimental results.
This new capability of RMG is expected to prove very helpful as the community incorporates nitrogen chemistry in chemical kinetic models. The present work demonstrates the abilities of RMG and its potential to adequately simulate nitrogenous species, as well as be extended to accurately account for other heteroatoms.
Acknowledgments
We would like to thank Dr. Aäron Vandeputte for supporting quantum chemical calculations. Financial support from the Ed Satell Foundation; the Technion New England Foundation; The Zuckerman STEM Leadership Program; the Swiss National Science Foundation (SNF) Postdoctoral Research Grant PBEZB2-140081; and the Gas Phase Chemical Physics Program of the US Department of Energy, Office of Basic Energy Sciences, Division of Chemical Sciences, Geosciences, and Biosciences (under Award number DE-SC0014901) is gratefully acknowledged.
30
Supplementary Material
1. RMG input file 2. Chemkin input file
3. RMG species dictionary (can be interpreted at http://rmg.mit.edu/)
Bibliography
1. Miller, J.A; Bowman, C.T. Mechanism and modeling of nitrogen chemistry in combustion, Prog Energy Combust Sci 1989, 15, 287–338.
2. Dean, A.M.; Bozzelli, J.W. Combustion chemistry of nitrogen, in: Gas-phase combustion chemistry; Gardiner, W.C., Ed; Springer Science, New York, 1994, pp. 125–341, ISBN: 978-1-4612-7088-1, DOI: 10.1007/978-1-4612-1310-9_2.
3. Glarborg, P; Jensen, A.D.; Johnsson, J.E. Fuel nitrogen conversion in solid fuel fired systems, Prog Energy Combust Sci 2003, 29, 89–113.
4. Shi, Q.; Hou, D.; Chung, K.H.; Xu, C.; Zhao, S.; Zhang, Y. Characterization of heteroatom compounds in a crude oil and its saturates, aromatics, resins, and asphaltenes (SARA) and non-basic nitrogen fractions analyzed by negative-ion electrospray ionization Fourier transform ion cyclotron resonance mass spectrometry, Energy Fuels 2010, 24, 2545–2553. 5. Burchill, P.; Herod, A.A.; Mitchell, C.A. The estimation of primary aromatic amines and other basic nitrogen compounds in some coal liquefaction products, Chromatographia 1986, 21, 67–76.
6. Nagai, M.; Sato, T.; Aiba, A. Poisoning effect of nitrogen compounds on dibenzothiophene hydrodesulfurization on sulfided NiMoAl2O3 catalysts and relation to gas-phase basicity, J Catal 1986, 58, 52–58.
31
7. Zdeněk, V.; Kaluža, L.; Gulková, D. Comparison of nitrogen tolerance of PdMo/Al2O3 and CoMo/Al2O3 catalysts in hydrodesulfurization of model compounds, Fuel 2014, 120, 86– 90.
8. Rangarajan, S.; Mavrikakis, M. Adsorption of nitrogen‐and sulfur‐containing compounds on NiMoS for hydrotreating reactions: A DFT and VdW‐corrected study, AIChE J 2015, 61, 4036–4050.
9. Pritchard, H.O. Thermal decomposition of isooctyl nitrate, Combust Flame 1989, 75, 415– 416.
10 Ickes, A.M.; Bohac, S.V.; Assanis, D.N. Effect of 2-ethylhexyl nitrate cetane improver on NOx emissions from premixed low-temperature diesel combustion, Energy Fuels 2009, 23, 4943–4948.
11. Shell V-Power NiTRO+ Premium Gasoline, Shell United States, retrived from the World Wide Web: http://www.shell.us/vpower (accessed: October 2017).
12. Zamfirescu, C.; Dincer, I. Using ammonia as a sustainable fuel, J Power Sources 2008, 185, 459–465.
13. Grinberg Dana, A.; Shter, G.E.; Grader, G.S. Nitrogen-based alternative fuel: An environmentally friendly combustion approach, RSC Adv 2014, 4, 10051–10059.
14. Mosevitzky, B.; Grinberg Dana, A.; Shter, G.E.; Grader, G.S. Combustion simulations of aqueous urea ammonium nitrate monofuel at high pressures, Combust Flame 2016, 166, 295–306.
15. Grinberg Dana, A.; Shter, G.E.; Grader, G.S. Nitrogen-based alternative fuels: Progress and future prospects, Energy Technol 2016, 4, 7–18.
32
combustion of aqueous urea ammonium nitrate alternative fuel, Fuel 2015, 159, 500–507. 17. Zhang, K.; Zhang, L.; Xie, M.; Ye, L.; Zhang, F.; Glarborg, P.; Qi, F. An experimental and
kinetic modeling study of premixed nitroethane flames at low pressure, Proc Combust Inst 2013, 34, 617–624.
18. Lucassen, A.; Zhang, K.; Warkentin, J.; Moshammer, K.; Glarborg, P.; Marshall, P.; Kohse-Höinghaus, K. Fuel-nitrogen conversion in the combustion of small amines using dimethylamine and ethylamine as biomass-related model fuels, Combust Flame 2012, 159, 2254–2279.
19. Lucassen, A.; Oßwald, P.; Struckmeier, U.; Kohse-Höinghaus, K.; Kasper, T.; Hansen, N.; Cool, T.A.; Westmoreland, P.R. Species identification in a laminar premixed low-pressure flame of morpholine as a model substance for oxygenated nitrogen-containing fuels, Proc Combust Inst 2009, 32, 1269–1276.
20. Li, S.; Davidson, D.F.; Hanson, R.K.; Labbe, N.J.; Westmoreland, P.R.; Oßwald, P.; Kohse-Höinghaus, K. Shock tube measurements and model development for morpholine pyrolysis and oxidation at high pressures, Combust Flame 2013, 160, 1559–1571.
21. Gao, C.W.; Allen, J.W.; Green, W.H.; West, R.H. Reaction Mechanism Generator: Automatic construction of chemical kinetic mechanisms, Comput Phys Commun 2016, 203, 212–225.
22. Song, J. Building robust chemical reaction mechanisms: Next generation of automatic model construction software (2004), Doctoral dissertation, Massachusetts Institute of Technology, https://dspace.mit.edu/handle/1721.1/30058.
23. Green, W.H. Predictive kinetics: A new approach for the 21st century, Adv Chem Eng 2007, 32, 1–50.
33
24. Susnow, R.G.; Dean, A.M.; Green, W.H.; Peczak, P.; Broadbelt, L.J. Rate-based construction of kinetic models for complex systems, J Phys Chem A 1997, 101, 3731–3740. 25. Harper, M.R.; Van Geem, K.M.; Pyl, S.P.; Marin, G.B.; Green, W.H. Comprehensive reaction mechanism for n-butanol pyrolysis and combustion, Combust Flame 2011, 158, 16–41.
26. Merchant, S.S.; Zanoelo, E.F.; Speth, R.L.; Harper, M.R.; Van Geem, K.M.; Green, W.H. Combustion and pyrolysis of iso-butanol: Experimental and chemical kinetic modeling study, Combust Flame 2013, 160, 1907–1929.
27. Allen, J.W.; Scheer, A.M.; Gao, C.W.; Merchant, S.S.; Vasu, S.S.; Welz, O.; Savee, J.D.; Osborn, D.L.; Lee, C.; Vranckx, S.; Wang, Z. A coordinated investigation of the combustion chemistry of diisopropyl ketone, a prototype for biofuels produced by endophytic fungi, Combust Flame 2014, 161, 711–724.
28. Magoon, G.R.; Aguilera‐Iparraguirre, J.; Green, W.H.; Lutz, J.J.; Piecuch, P.; Wong, H.W.; Oluwole, O.O. Detailed chemical kinetic modeling of JP-10 (exo-tetrahydrodicyclopentadiene) high-temperature oxidation: Exploring the role of biradical species in initial decomposition steps, Int J Chem Kinet, 2012, 44, 179–193.
29. Gao, C.W.; Vandeputte, A.G.; Yee, N.W.; Green, W.H.; Bonomi, R.E.; Magoon, G.R.; Wong, H.W.; Oluwole, O.O.; Lewis, D.K.; Vandewiele, N.M.; Van Geem, K.M. JP-10 combustion studied with shock tube experiments and modeled with automatic reaction mechanism generation, Combust Flame 2015, 162, 3115–3129.
30. Vandewiele, N.M.; Magoon, G.R.; Van Geem, K.M.; Reyniers, M.F.; Green, W.H.; Marin, G.B. Kinetic modeling of jet propellant-10 pyrolysis, Energy Fuels 2015, 29, 413–427. 31. Petway, S.V.; Ismail, H.; Green, W.H.; Estupiñán, E.G.; Jusinski, L.E.; Taatjes, C.A.
34
Measurements and automated mechanism generation modeling of OH production in photolytically initiated oxidation of the neopentyl radical, J Phys Chem. A 2007, 111, 3891– 900.
32. Li, S.; Davidson, D.F.; Hanson, R.K. Shock tube study of ethylamine pyrolysis and oxidation, Combust Flame 2014, 161, 2512–2518.
33. Altarawneh, M.; Almatarneh, M.H.; Marashdeh, A.; Dlugogorski, B.Z. Decomposition of ethylamine through bimolecular reactions, Combust Flame 2016, 163, 532–539.
34. Lovas, F.; Clark, F.; Tiemann, E. Pyrolysis of ethylamine. I. Microwave spectrum and molecular constants of vinylamine, J Chem Phys 1975, 62, 1925–1931.
35. Li, S.; Dames, E.; Davidson, D.F.; Hanson, R.K. High-temperature measurements of the reactions of OH with ethylamine and dimethylamine, J Phys Chem A 2014, 118, 70–77. 36. Li, S.; Davidson, D.F.; Hanson, R.K. Shock Tube Study of Ethylamine Pyrolysis and
Oxidation, 8th U.S. National Comb. Meeting, Park City, UT 2013 paper 070RK-0075. 37. Almatarneh, M.H.; Altarawneh, M.; Poirier, R.A.; Saraireh, I.A. High level ab initio, DFT,
and RRKM calculations for the unimolecular decomposition reaction of ethylamine, J Comput Sci 2014, 5, 568–575.
38. Almatarneh, M.H.; Barhoumi, L.; Al-Tayyem, B.; Abu-Saleh, A.A.A.; Marwa, M.; Abuorabi, F.; AlShamaileh, E.; Altarawneh, M.; Marashdeh, A. Computational study for the second-stage cracking of the pyrolysis of ethylamine: Decomposition of methanimine, ethenamine, and ethanimine, Comput Theor Chem 2016, 1075, 9–17.
39. Benson, S.W.; Cruickshank, F.R.; Golden, D.M.; Haugen, G.R.; O'Neal, H.E.; Rodgers, A.S.; Shaw, R.; Walsh, R. Additivity rules for the estimation of thermochemical properties, Chem Rev 1969, 69, 279–324.
35
40. Ashcraft, R.W.; Green, W.H. Thermochemical properties and group values for nitrogen-containing molecules, J Phys Chem A 2008, 112, 9144–9152.
41. Montgomery, J.A.; Frisch, M.J.; Ochterski, J.W.; Petersson, G.A. A complete basis set model chemistry. VII. Use of the minimum population localization method, J Chem Phys 2000, 112, 6532–6542.
42. Socrates, G. Infrared and Raman Characteristic Group Frequencies: Tables and Charts, 3rd ed. John Wiley & Sons, 2004, ISBN: 978-0-470-09307-8.
43. Chang, A.Y.; Bozzelli, J.W.; Dean, A.M.; Kinetic Analysis of Complex Chemical Activation and Unimolecular Dissociation Reactions using QRRK Theory and the Modified Strong Collision Approximation, Z Phys Chem 2000, 214, 1533–1568.
44. Allen, J.W.; Goldsmith, C.F.; Green, W.H. Automatic estimation of pressure-dependent rate coefficients, Phys Chem Chem Phys 2012, 14, 1131–1155.
45. Alecu, I.M.; Zheng, J.; Zhao, Y.; Truhlar, D.G. Computational thermochemistry: Scale factor databases and scale factors for vibrational frequencies obtained from electronic model chemistries, J Chem Theory Comp 2010, 6, 2872–2887.
46. Peterson, G.A.; Malicl, D.K.; Wilson, W.C.; Ochterski, J.W.; Montgomery, J.A.; Frisch, M.J. Calibration and comparison of the Gaussian-2, complete basis set, and density functional methods for computational thermochemistry, J Chem Pys 1998, 24, 1998, 10570–10579.
47. Burke, M.P.; Chaos, M.; Ju, Y.; Dryer, F.L.; Klippenstein, S.J. Comprehensive H2/O2 kinetic model for high-pressure combustion, Int J Chem Kinet 2012, 44, 444–474.
48. Song, J.; Stephanopoulos, G.; Green, W.H. Valid parameter range analyses for chemical reaction kinetic models, Chem Eng Sci 2002, 57, 4475–4491.
36
49. CHEMKIN-PRO 15131, Reaction Design, San Diego, CA, 2013.
50. Goodwin, D.G.; Moffat, H.K.; Speth, R.L. Cantera: An object-oriented software toolkit for chemical kinetics, thermodynamics, and transport processes, 2017. http://www.cantera.org/, Version 2.3.0. doi:10.5281/zenodo.170284.
51. Kohse-Höinghaus, K.; Davidson, D.F.; Chang, A.Y.; Hanson, R.K. Quantitative NH2 concentration determination in shock tube laser-absorption experiments, J Quant Spectrosc Radiat Transfer 1989, 42, 1–17.
52. Cook, R.D.; Pyun, S.H.; Cho, J.; Davidson, D.F.; Hanson, R.K. Shock tube measurements of species time-histories in monomethyl hydrazine pyrolysis, Comb Flame 2011, 158, 790– 795.
53. Klippenstein, S.J.; Georgievskii, Y.; Harding, L.B. Predictive theory for the combination kinetics of two alkyl radicals, Phys Chem Chem Phys 2006, 8, 1133–1147.
54. Yaws C.L. Yaws’ Property Data for Chemical Engineers and Chemists handbook, 2014, ISBN: 978-1-61344-932-5. Online version available at: http://app.knovel.com/hotlink/toc/id:kpYCPDCECD/yaws-critical-property/yaws-critical-property.
55. Herbon, J.T.; Hanson, R.K.; Golden, D.M.; Bowman, C.T. A shock tube study of the enthalpy of formation of OH, Proc Comb Inst 2002, 29, 1201–1208.
56. Nguyen, T.L.; Vereecken, L.; Hou, X.J.; Nguyen, M.T.; Peeters, J. Potential Energy Surfaces, Product Distributions and Thermal Rate Coefficients of the Reaction of O(3P) with C2H4(X1Ag): A Comprehensive Theoretical Study, J Phys Chem A 2005, 109, 7489–7499. 57. Li, X.; Jasper, A.W.; Zádor, J.; Miller, J.A.; Klippenstein, S.J. Theoretical kinetics of O +
37
58. Simmie, J.M.; Somers, K.P. Benchmarking Compound Methods (CBS-QB3, CBS-APNO, G3, G4, W1BD) against the Active Thermochemical Tables: A Litmus Test for Cost-Effective Molecular Formation Enthalpies, J Phys Chem A 2015, 119, 7235–7246.
59. National Institute of Standards and Technology (NIST), U.S. Department of Commerce, NIST Chemistry WebBook, Standard Reference Database number 69, retrieved from the World Wide Web: http://webbook.nist.gov/ (accessed October 2017).
60. Lemoult, M.P. Recherches theoriques et experimentales sur les chaleurs de combustion et de formation des composes organiques, Ann Chim Phys 1907, 12, 395–432.
38
Table 1 New nitrogen resonance classes in RMG
Resonance class Resonance structures
Single-triple bonds / two double bonds
↔ Lone electron pair / radical and partial charge ↔
39
Table 2 The EA kinetic library. Parameters are for the modified Arrhenius expression k = A Tn
exp(–Ea/[RT]).
No. Reaction[a] A[b] n E
a (kJ mol-1) source[c] 1 CH3CH2NH2 + H ↔ CH2CH2NH2 + H2 1.60×10¹³ 0 34.2 [33] 2 CH3CH2NH2 + H ↔ CH3CHNH2 + H2 1.16×10¹³ 0 15.0 [33] 3 CH3CH2NH2 + H ↔ CH3CH2NH + H2 5.47×10¹² 0 28.9 [33] 4 CH3CH2NH2 + CH3 ↔ CH2CH2NH2 + CH3 6.00×10¹² 0 52.8 [33] 5 CH3CH2NH2 + CH3 ↔ CH3CHNH2 + CH3 1.23×10¹² 0 33.1 [33] 6 CH3CH2NH2 + CH3 ↔ CH3CH2NH + CH3 2.23×10¹² 0 39.5 [33] 7 CH3CH2NH2 + NH2 ↔ CH2CH2NH2 + NH3 9.21×10¹² 0 39.3 [33] 8 CH3CH2NH2 + NH2 ↔ CH3CHNH2 + NH3 8.01×10¹² 0 19.8 [33] 9 CH3CH2NH2 + NH2 ↔ CH3CH2NH + NH3 2.14×10¹² 0 24.8 [33] 10 CH3CH2NH2 + OH ↔ CH2CH2NH2 + H2O 7.94×10² 2.97 -4.4 [35] 11 CH3CH2NH2 + OH ↔ CH3CHNH2 + H2O 3.28×10⁵ 2.24 -12.7 [35] 12 CH3CH2NH2 + OH ↔ CH3CH2NH + H2O 1.12×10⁵ 2.36 -12.0 [35] 13 N2H4 + H ↔ N2H3 + H2 1.48×10⁸ 1.69 16.7 pw 14 N2H4 + CH3 ↔ N2H3 + CH4 1.77×101 3.60 14.6 pw 15 N2H4 + NH2 ↔ N2H3 + NH3 2.59×10³ 2.83 2.9 pw 16 CH3CH=NH + H ↔ CH2CH=NH + H2 3.98×10⁴ 2.76 18.4 pw 17 CH3CH=NH + H ↔ CH3CH=N + H2 1.19×10⁷ 1.96 10.0 pw 18 CH2=CHNH2 + H ↔ CH2CH2NH2 3.14×10⁷ 1.77 15.6 pw 19 CH2=CH2 + NH2 ↔ CH2CH2NH2 1.23×10³ 2.76 6.9 pw 20 CH3CHNH2 ↔ CH2=CHNH2 + H 1.14×10⁹ 1.49 146.9 pw 21 CH2=NH + H ↔ CH2NH2 1.48×10⁸ 1.67 9.6 pw 22 CH2CH=NH ↔ CH2=C=NH + H 2.18×10⁷ 2.26 210.5 pw 23 CH3CH=N ↔ CH3 + HC#N 7.52×10¹⁰ 1.10 109.6 pw 24 CH3CH=N ↔ CH3C#N + H 1.49×10⁹ 1.44 113.0 pw 25 CH2CH2NH2 ↔ CH3CHNH2 3.12×10⁴ 2.33 133.1 pw 26 CH2CH=NH ↔ CH3CH=N 9.20×10⁵ 2.16 156.5 pw 27 CH3CH2NH2 ↔ CH2=CH2 + NH3 4.90×10⁴ 2.65 272.4 pw
[a] The ‘=’ sign denotes a double bond, ‘#’ denotes a triple bond.
[b] Units are s-1, or cm3 mol-1 s-1 for first or second order reactions in the forward direction, respectively. [c] pw – present work, calculated at the CBS-QB3 level.
40
Table 3 Thermodynamic properties for gas phase EA. Units are kJ mol-1 (Hof, Gof) and J mol -1 K-1 (Sof, Cp). source Ho f Sof Gof[a] Cp300 Cp400 Cp500 Cp600 Cp800 Cp1000 Cp1500 NIST59 -57.7 – – – – – – – – – Present model[b] -47.49 283.55 -131.99 71.63 88.37 103.89 117.65 138.95 153.76 181.17 Yaws54 -47.49 -0.04 -47.48 71.63 88.37 103.89 117.65 138.95 153.76 181.17 GAV[c] -52.2 283.42 -134.66 71.8 88.91 105.00 118.20 140.25 157.24 186.86 CBS-QB3 -52.4 284.0 -137.03 72.3 88.6 103.7 117.0 139.4 156.6 183.7 [a] Calculated as Go f=Hof–T∙Sof
[b] Taken from the C/H/N RMG thermodynamic library; used in the EA models presented in this work.
[c] Group additivity values39 calculated by RMG; these values were not used in this work and are given here for comparison only.