Publisher’s version / Version de l'éditeur:
Vous avez des questions? Nous pouvons vous aider. Pour communiquer directement avec un auteur, consultez la première page de la revue dans laquelle son article a été publié afin de trouver ses coordonnées. Si vous n’arrivez pas à les repérer, communiquez avec nous à PublicationsArchive-ArchivesPublications@nrc-cnrc.gc.ca.
Questions? Contact the NRC Publications Archive team at
PublicationsArchive-ArchivesPublications@nrc-cnrc.gc.ca. If you wish to email the authors directly, please see the first page of the publication for their contact information.
https://publications-cnrc.canada.ca/fra/droits
L’accès à ce site Web et l’utilisation de son contenu sont assujettis aux conditions présentées dans le site LISEZ CES CONDITIONS ATTENTIVEMENT AVANT D’UTILISER CE SITE WEB.
Lux Europa 2009, 11th European Lighting Conference [Proceedings], pp.
731-738, 2009-09-09
READ THESE TERMS AND CONDITIONS CAREFULLY BEFORE USING THIS WEBSITE. https://nrc-publications.canada.ca/eng/copyright
NRC Publications Archive Record / Notice des Archives des publications du CNRC :
https://nrc-publications.canada.ca/eng/view/object/?id=3d73e696-c813-4a9b-8d6b-10042f9ba7b2 https://publications-cnrc.canada.ca/fra/voir/objet/?id=3d73e696-c813-4a9b-8d6b-10042f9ba7b2
NRC Publications Archive
Archives des publications du CNRC
This publication could be one of several versions: author’s original, accepted manuscript or the publisher’s version. / La version de cette publication peut être l’une des suivantes : la version prépublication de l’auteur, la version acceptée du manuscrit ou la version de l’éditeur.
Access and use of this website and the material on it are subject to the Terms and Conditions set forth at
Energy savings from photosensors and occupant sensors/wall
switches on a college campus
http://www.nrc-cnrc.gc.ca/irc
Ene rgy sa vings from phot ose nsors a nd oc c upa nt se nsors/w a ll
sw it c he s on a c olle ge c a m pus
N R C C - 5 1 3 1 9
B i r t , B . ; N e w s h a m , G . R .
S e p t e m b e r 2 0 0 9
A version of this document is published in / Une version de ce document se trouve dans:
Lux Europa 2009, 11th European Lighting Conference, Istanbul, Turkey,
September 9-11, 2009, pp. 731-738
The material in this document is covered by the provisions of the Copyright Act, by Canadian laws, policies, regulations and international agreements. Such provisions serve to identify the information source and, in specific instances, to prohibit reproduction of materials without written permission. For more information visit http://laws.justice.gc.ca/en/showtdm/cs/C-42
Les renseignements dans ce document sont protégés par la Loi sur le droit d'auteur, par les lois, les politiques et les règlements du Canada et des accords internationaux. Ces dispositions permettent d'identifier la source de l'information et, dans certains cas, d'interdire la copie de documents sans permission écrite. Pour obtenir de plus amples renseignements : http://lois.justice.gc.ca/fr/showtdm/cs/C-42
Energy savings from photosensors and occupant sensors/wall switches on a
college campus
Benjamin J. Birt1, Guy R. Newsham1
Abstract
We report the savings realized by the use of lighting controls across a college campus in southern Ontario, Canada. The campus had an extensive lighting system of addressable dimming ballasts, controlled and monitored centrally. Of the 2295 luminaires from which we recovered data, 87 were controlled by 62 photosensors; these were in rooms that also featured a manual control system (wall switch/dimmer/preset scenes) and occupancy sensor. The site was monitored from mid-April to mid-July, 2008. Substantial energy savings were realised by the control system, though savings varied greatly by control type, room type, and by day. Manual use of wall switches and switching by occupancy sensors contributed most to savings. Meaningful additional savings were contributed by dimming, either by a photosensor or use of preset scenes. We provide a detailed breakdown of the savings by control and room type. Note that in a large space occupant sensors/wall switches affected all luminaires, whereas photosensors affected only those luminaires close to windows or skylights.
Keywords: Lighting Controls, Energy Efficiency, Daylighting, Occupancy 1. Introduction
Lighting is responsible for a large fraction of institutional building energy use. In 2006, lighting accounted for 10% of the total energy end-use in the commercial/institutional sectors in Canada [1]. Therefore, reducing the lighting load while still satisfying occupant needs will go a long way in reducing overall energy use. There are several methods available to reduce the lighting load of a building. For example, lights could be automatically switched off when a room is not in use, or dimmed when there is sufficient natural light entering the room.
Lighting control systems can range from a very simple manual on/off switch that is operated by the occupant, to a system of addressable ballasts, dimmers, photosensors and occupant sensors all controlled by a central computer. Such systems are widely available, and are encouraged by energy codes and green building rating systems [2], yet there are limited studies of the long-term performance of such systems in the field. For example, Jennings et al. [3] found that private offices with occupancy sensors saved 20-26% compared to the manual operation of a wall switch alone. In offices where automatic daylight dimming controls were installed and properly commissioned additional savings of 21% were obtained over a seven-month period. Galasiu et al. [4] measured a saving of up to 70% in an open plan office with the combined use of an occupancy sensor, photosensor and a personal dimming control. Had the various controls been installed individually they would have saved, on average: occupancy sensors 35%, photosensors 20% and individual dimming controls 11%. Automatic and manual controls in private offices in a study by Morrow et al. [5] saved 61% of the energy over a 10 hour schedule; 46% of the savings were due to motion sensors and automatic dimming while the remaining 15% was due to occupant switching and dimming.
2. Methodology
Data was collected continuously for 94 days from mid-April to mid-July, 2008 from seven buildings on a college campus located in southern Ontario, Canada; up to 49 conventional working days were used in the final analysis for individual ballasts. The buildings contained classrooms, both private and shared offices, circulation areas and mixed-use areas. In total the campus had 2295 addressable luminaires with dimmable ballasts that were monitored and controlled centrally. Luminaires were controlled locally by a number of controls including occupancy sensors, photosensors, and manual wall switches (with dimmers). A number of classrooms and offices also had the additional option of preset scene selection. The central control software recorded every change of state of each dimmable ballast. The system had been in operation for approximately one year before the commencement of the study. Ambient lighting was provided by ceiling-recessed, lensed direct-indirect luminaires with two 3500K T5 1220 mm (4 ft.) fluorescent lamps. In some spaces the lamps were 28 W, and in others they were 54 W HO (high output).
1
The power draw of each ballast at any given time was determined from the recorded dimming values, using dimmer level vs. power draw curves supplied by the lighting system manufacturer.
In this paper we focus on rooms containing ballasts controlled by a photosensor, there were 53 such rooms with a total of 62 photosensor-controlled ballasts. The 53 individual rooms could be broken down into 3 main categories: classrooms (36), corridors (9) and offices (8).
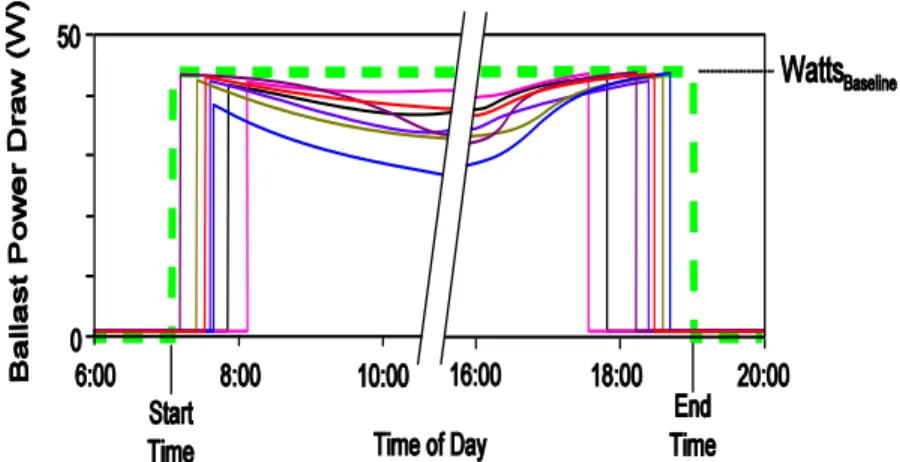
To calculate the savings due to the various controls, the operating schedule and baseline wattage for each room were required to determine a baseline energy use. The operating schedule was determined for each individual room by overlaying the daily power profile for all normal days in the measurement period on the same graph and determining a start and end time that encompassed the room’s general power profile (Figure 1). The start time was selected as the earliest time (to the nearest half hour) that the lights were usually turned on in the morning (left hand side of Figure 1). Similarly, the end time was the latest time that the lights were turned off towards the end of the day (right hand side of Figure 1). Occasionally there were days when the lights were operated outside of these times; the usages were contributed by either security walk-throughs, cleaning staff, or work being performed out of normal hours; unusual active periods such as these were ignored in the analysis. The baseline maximum wattage,
WattsBaseline was the maximum wattage that the luminaire drew during periods with no daylight, which was
typically 80% of full output (as chosen by the host site). These values were used to calculate the theoretical daily energy use over the course of the schedule time (equation 1).
Baseline Baseline
End
time
Start
time
Watts
Energy
=
(
−
)
×
(1)This choice of baseline strikes a balance between the conservative option of treating each day for each room separately, and the liberal option of developing a schedule for each room type that encompassed all common start and end times for all rooms in that room type.
Figure 1. Determination of the start and end times of the schedule for each room. A suitable time was selected that encompassed the first switch on times and the last switch off times.
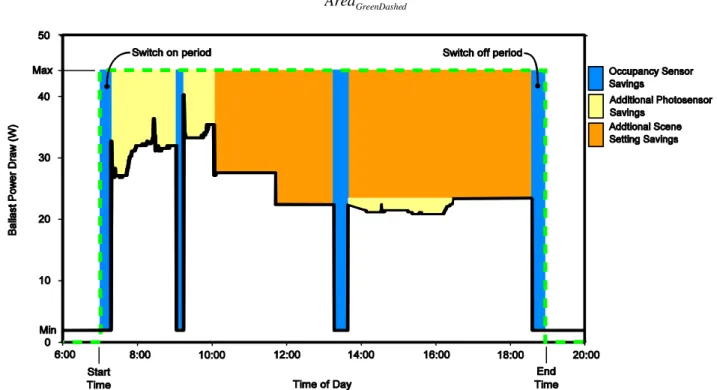
Savings by each of the control systems was determined from a specially written program to analyse the dataset of over 5 million records. Figure 2 shows an example of a ballast in a classroom, illustrating the method used to determine the various savings. The black solid line is the actual power drawn by the luminaire. The green dashed line represents the theoretical baseline operation of the luminaire if centrally controlled on and off at the start and end of the schedule, and operating at the baseline wattage.
Due to the on/off nature of both wall switches and occupant sensors and the information we had from the system, we were not able to unequivocally separate savings from these two sources. Savings due to the occupancy sensor/wall switch are the blue (dark grey) shaded areas (determined using equation 2), and were considered to accrue whenever the power value was equal to the minimum (1.8 W in this case) during the baseline schedule. The occupant sensor/wall switch therefore saved the difference between maximum and minimum power draw of the ballast. The daily saving was the integration over the schedule period.
100 Savings(%) Switch l Sensor/Wal Occupant = × d GreenDashe Blue Area Area (2)
Figure 2. The power consumed by an example light fixture on a particular day. The green dashed line is the maximum use based on the standard schedule for that room. The black line shows the actual use on that day. The blue (dark grey) areas are the energy saved due to the occupant sensor or wall switch. The orange (medium grey) area shows the additional savings due to using a preset scene. The yellow (light grey) shaded area highlights the additional savings due to a photosensor.
Additional savings were made via the dimming of the luminaires. All rooms considered in this paper dimmed the lights in response to available daylight entering the room via a photosensor. In classrooms and some offices users also had the option of using preset lighting scenes to manually dim the lights below their normal maximum. To determine only photosensor savings on each of the photosensor-controlled ballasts, it was necessary to match each of the photosensor-photosensor-controlled ballasts to other ballasts in the same zone. Once matched, the additional daily scene savings from dimming the lights using the preset scenes (equation 3) could be subtracted from the total dimming savings on the photosensor-controlled ballast (equation 4).
100 (%) Savings Scene = × d GreenDashe Orange Area Area (3) 100 (%) Savings Total = + × d GreenDashe Orange Yellow Area Area Area (4) To determine either the daily total additional savings due to all forms of dimming, or the scene setting only
savings, the following criteria was followed. If the power draw on a per minute interval was greater than the minimum (lamp on) and less than the maximum wattage then the savings will be due to some form of dimming. Savings on a per minute interval was the difference between the maximum power draw and the actual ballast draw. Integration of the savings over the scheduled period gave the daily savings. Photosensor only savings for a zone with preset scenes being used was calculated by subtracting the daily scene setting savings as calculated from other ballasts in the zone from the daily total savings as calculated on the photosensor-controlled ballast. Preset scene usage in Figure 2 is characterised by the static dimmed value and the savings are highlighted as the orange area. Dimming due to a photosensor is characterised by a fluctuating curve, with yellow areas denote the savings.
3. Results
A brief description of the rooms from which data was obtained is in Table 1.
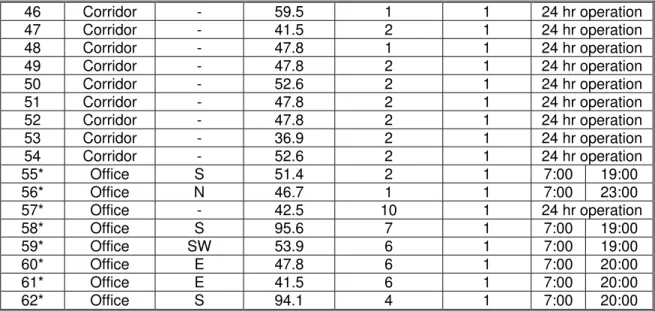
Table 1. Rooms and zones analyzed. Orientation is the direction that the window faces. ‘SKY’ - skylight installed, ‘-‘ - direction was unable to be determined, A and B - correspond to the same room that had two photosensors installed (one of the photosensors was influenced by a skylight and the other by a window, differentiation between the two was not possible). Asterisks indicate zones in which the photosensor-controlled ballast could not be matched with other ballasts in the zone, and therefore a separation of scene savings and photosensor savings was not possible.
Zone
Number Room Type Orientation
Max Power Draw (W) Ballasts per Room Ballasts Controlled Start Time Finish Time 1 Classroom N 44.6 9 2 7:00 19:00 2 Classroom N 46.7 12 1 7:00 19:00 3 Classroom S 42.5 5 1 7:00 19:00 4 Classroom W 46.7 4 1 7:00 23:00 5 Classroom NW 46.7 6 2 7:00 21:00 6 Classroom N 46.7 9 2 7:00 21:00 7 Classroom N 46.7 9 3 7:00 23:00 8 Classroom N 46.7 9 1 7:00 23:00 9 Classroom SW 47.8 6 1 7:00 23:00 10* Classroom SKY 47.8 25 4 7:00 23:00 11* Classroom SKY 47.8 7:00 23:00 12 Classroom N 44.6 19 5 7:00 23:00 13 Classroom E 44.6 12 1 7:00 23:00 14 Classroom E 47.8 12 2 7:00 18:00 15 Classroom SW 44.6 9 1 7:00 20:00 16 Classroom SW 46.7 9 1 7:00 23:00 17* Classroom B 29.0 22 7 7:00 19:00 18* Classroom A 53.9 7 7:00 19:00 19 Classroom E 47.8 12 1 7:00 19:00 20 Classroom E 38.7 11 1 7:00 19:00 21 Classroom E 44.6 12 1 7:00 18:00 22* Classroom SW 47.8 18 1 7:00 18:00 23* Classroom SW 41.5 1 6:30 19:00 24* Classroom SW 41.5 1 6:30 19:00 25* Classroom SW 46.7 1 6:30 0:00 26* Classroom SW 36.9 1 6:30 0:00 27 Classroom W 41.5 12 1 7:00 17:00 28 Classroom W 46.7 12 1 7:00 19:00 29 Classroom W 46.7 12 1 7:00 20:00 30 Classroom W 46.7 7 1 7:00 16:00 31 Classroom N 32.8 12 1 7:00 21:00 32* Classroom NE 59.5 12 1 7:00 20:00 33 Classroom E 40.6 12 1 7:00 23:00 34 Classroom E 36.9 12 1 5:00 19:00 35 Classroom E 40.6 12 1 7:00 19:00 36 Classroom SE 47.8 12 1 7:00 20:00 37* Classroom N 42.5 12 2 7:00 19:00 38* Classroom N 36.9 1 7:00 19:00 39* Classroom NE 43.5 12 1 7:00 19:00 40* Classroom NE 43.5 1 7:00 19:00 41 Classroom E 42.5 12 1 7:00 21:00 42 Classroom E 42.5 1 7:00 21:00 43 Classroom E 46.7 12 1 7:00 22:00 44 Classroom E 43.5 12 1 7:00 22:00 45 Classroom SE 46.7 12 1 7:00 22:00
46 Corridor - 59.5 1 1 24 hr operation 47 Corridor - 41.5 2 1 24 hr operation 48 Corridor - 47.8 1 1 24 hr operation 49 Corridor - 47.8 2 1 24 hr operation 50 Corridor - 52.6 2 1 24 hr operation 51 Corridor - 47.8 2 1 24 hr operation 52 Corridor - 47.8 2 1 24 hr operation 53 Corridor - 36.9 2 1 24 hr operation 54 Corridor - 52.6 2 1 24 hr operation 55* Office S 51.4 2 1 7:00 19:00 56* Office N 46.7 1 1 7:00 23:00 57* Office - 42.5 10 1 24 hr operation 58* Office S 95.6 7 1 7:00 19:00 59* Office SW 53.9 6 1 7:00 19:00 60* Office E 47.8 6 1 7:00 20:00 61* Office E 41.5 6 1 7:00 20:00 62* Office S 94.1 4 1 7:00 20:00
3.1 Occupant sensor and wall switch savings
Average savings across all room types for the combination of occupant sensors and manual wall switches was 52.9% (standard deviation 32.8%) over 49 days. Investigating the three room types separately: classrooms (36 rooms, 45 separate ballasts) had the largest savings in energy, saving 60.3% (s.d. 30.3%). This is as expected with their potentially long daily schedule (evening classes were common) but sporadic use during this schedule; average actual occupancy (period for which lighting was actually in use) was 5.0 hr (s.d. 4.3 hr) over an average 13.5 hr (s.d. 2.1 hr) daily baseline schedule. As expected, corridors (n = 9) exhibited the least savings, 23.5% (s.d. 25.0%), due to their frequent use. On average, corridor lighting was on for up to 18.1 hr (s.d. 6.2 hr) over a 24 hr period. Offices (n = 8) on average saved 44.2% (s.d. 33.2%). Office schedules and savings were more consistent, with average occupancy of 7.6 hr (s.d 5.0 hr) per day in a possible 14.4 hr (s.d. 4.4 hr) schedule. The long schedule observed in the office classification of rooms was likely due in part to luminaires in open offices or in general circulation/use areas of the offices; for example, reception areas and printing rooms were required to be on for longer periods due to the later finish time of some classes.
Figure 3 displays the total average daily energy savings due to an occupancy sensor and wall switch combined for each control zone. The zone number corresponds to the number in column 1 of Table 1. The error bars show the standard deviation using daily values from the use of occupancy sensors and manual wall switches combined. To gain a better understanding of the source of the savings we subdivided the total savings into three bins, as shown by the stacked bars in Figure 3: 1) savings between the start time in the baseline schedule and the first time the lights were switched on (this includes cases when the lights were off all day), 2) savings between the last time the lights were switched off and the end time in the baseline schedule, and 3) any savings between these two times. The greatest savings were due to waiting for the initial switch on for the day: average across all room types 28.3% (s.d. 34.1%). The average savings due to the final switching of the lights off at the end of the day across all room types was 13.7% (s.d. 19.3%), with the average savings made in the middle of the period of the schedule was 10.8% (s.d. 16.4%).
As stated earlier, with the information we have we cannot unequivocally attribute these savings to occupancy sensors or manual use of the wall switches. Nevertheless, it is probably reasonable to assume that the start of day savings are most likely attributed to the wall switches. There is a greater likelihood that some of the savings during the middle of the day and at the end of the day were due to occupancy sensors, though whether it was a majority or minority of the savings is unknown. Interestingly, Pigg et al. [6] conducted a field study in private offices that had both wall switches and occupancy sensors, and concluded that manual switch use was reduced when occupants knew that an automatic system to switch off lights was present.
Figure 3. Average energy saving per ballast obtained using an occupant sensor and manual wall switch. The energy savings are subdivided into three bins: 1) savings between the start time in the baseline schedule and the first time the lights were switched on (“Switch on”); 2) savings between the last time the lights were switched off and the end time in the baseline schedule (“Switch off”); and, 3) any savings between these two times (“Other”).
0 10 20 30 40 50 60 70 80 90 100 1 11 21 31 41 51 A v era g e Sa v ings due to Oc c upa nc y Sensor/Wall Sw itch (% ) Zone Number 61 Switch off Other Switch on
Classrooms Corridors Offices
3.2 Additional dimming savings
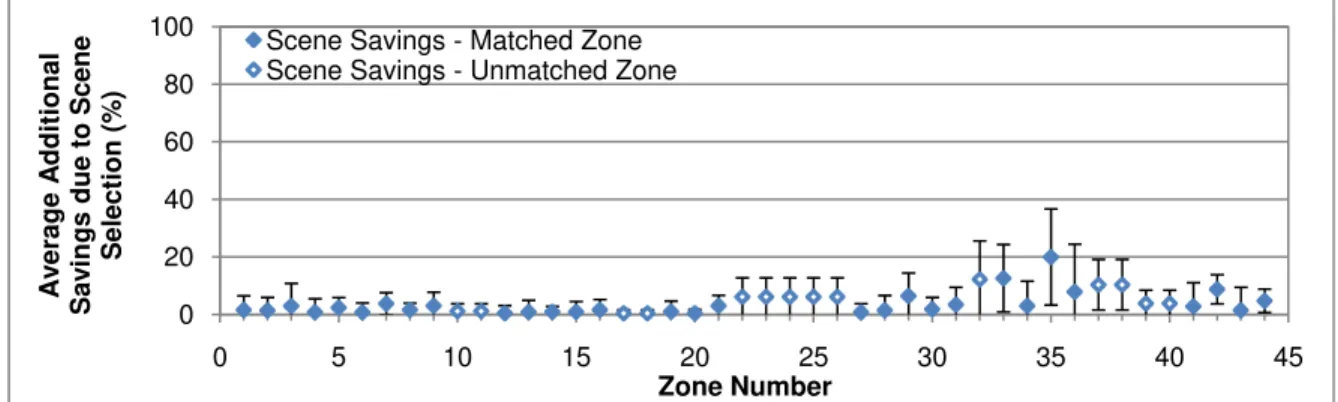
Additional energy savings were also realised by dimming the luminaires either by daylight detection with a photosensor or manual dimming using preset scenes. Classrooms were the predominant room type where preset scene selection was available. Scene setting was also available in some offices but it was not possible to separate scene savings from photosensor savings; ballasts in corridors were assumed to not have preset scene functions available for use by the occupants. For classrooms, ballasts in each of the zones that were not controlled by a photosensor were analysed to determine the additional savings made from dimming the lights via scene setting. On average the use of preset scenes in classrooms saved an additional 4.1% (s.d. 8.2%) of the daily baseline energy, Figure 4 shows these savings by zone. A solid symbol is used for zones where the photosensor-controlled ballast could be uniquely matched to a non-photosensor ballast in the same room. An open sensor is used when unique matching was not possible, and a room average estimate is provided.
Figure 4. The average additional savings made from the use of selecting different preset scenes in classrooms. 0 20 40 60 80 100 0 5 10 15 20 25 30 35 40 45 A v era g e A dditiona l Sa v ings due to Sc e n e Selectio n (% ) Zone Number Scene Savings - Matched Zone
Scene Savings - Unmatched Zone
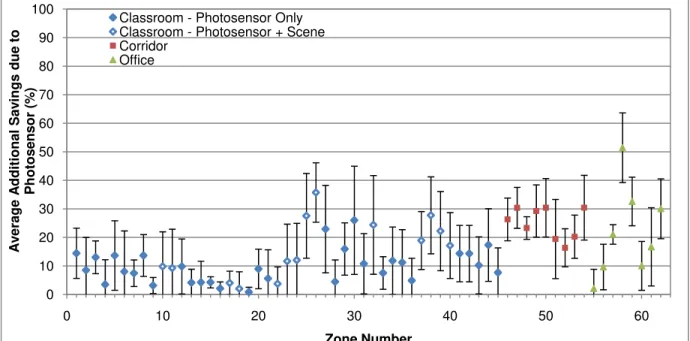
Figure 5, shows the additional savings due to photosensors, across all room types. For ballasts in classrooms that were able to be matched to a particular zone the additional savings due to use of preset scene selection has been subtracted from the total savings (solid symbol). In the remaining classrooms the savings due to scene setting could not be uniquely determined, and therefore the savings shown are for photosensors and scene setting combined (open symbols). Error bars show the standard deviation
across days. By room type, average additional savings were classrooms (photosensor only, n = 1523 analysis days) 9.8% (s.d. 11.2%); classrooms (photosensor + scene, n = 700 analysis days) 16.4% (s.d. 15.7%); corridors (n = 450 analysis days) 25.1% (s.d. 10.3%); and offices (n = 400 analysis days) 21.7% (s.d. 17.6%). A small portion of the savings in offices may be attributed to the use of preset scene selection. Note that these savings only accrue when the lights are on, and are therefore in addition to the savings provided by occupancy sensors and wall switches.
Figure 5. Average energy savings per ballast through the use of a photosensor. Error bars show standard deviation
o extrapolate the savings per zone into savings per room, one must consider how many ballasts in the
avings expressed as a percentage are highly dependent on the baseline chosen for comparison, which
. 0 10 20 30 40 50 60 70 80 90 100 0 10 20 30 40 50 60 A v era g e A dditiona l Sa v ings due to Ph o to sen so r (% ) Zone Number Classroom - Photosensor Only
Classroom - Photosensor + Scene Corridor
Office
T
room were controlled by each control type. Typically, all ballasts may be controlled by an occupancy sensor/wall switch, but only those near windows may be controlled by a photosensor. At the study site, a system reset had resulted in the loss of photosensor zoning, such that often only one ballast per room was controlled by the photosensor. In rooms with multiple ballasts this meant that room-level savings due to photosensors were drastically reduced from what they could have been. In this extreme case this meant that photosensors only saved on average 1.7% (s.d. 1.6%) of the total lighting energy in classrooms and 4.7% (s.d. 3.2%) in offices. This emphasizes the importance of matching controls to space types, and on-going maintenance. This low total savings per room would have a dramatic impact on the payback period of the use of such technologies. A more effective use of the output of the photosensor in controlling several fixtures near the window would allow for more energy to be saved on a per room basis.
S
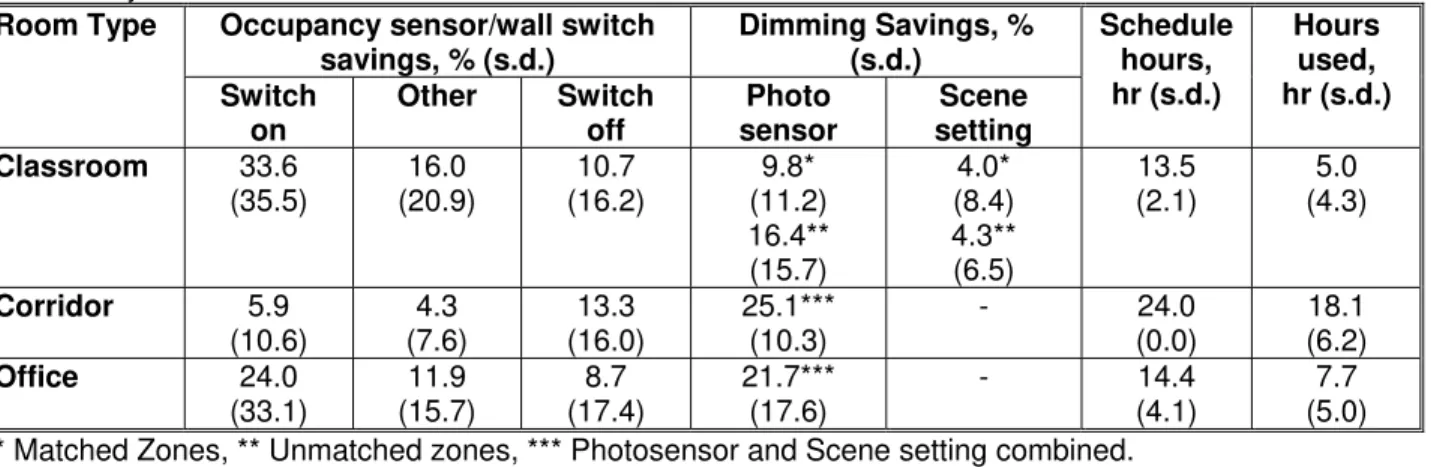
was not straightforward in a campus setting. To aid in interpretation, Table 2 summarizes the average energy savings from each of the control types in percentage terms, relative to the average baseline daily schedule, for each room type. Table 2 also shows the average number of hours per day the lighting system was actually in use (i.e. scheduled hours minus the savings due to the occupancy sensors and wall switches). Savings due to an occupancy sensor/wall switch may only be referenced to the scheduled hours, but the photosensor and scene savings may also be referenced to the actual hours of use. For example, the average energy saving for a ballast connected to a photosensor in a classroom was 9.8%. This might sound quite small, but it is relative to an average baseline schedule of 13.5 hr. This means that the photosensor saved the equivalent of 1.3 hr (13.5 x 0.098) of full ballast output per day, or 26% (1.3/5.0 x 100) of full output during the period the lighting was in use.
Table 2. The average energy savings from each of the control types in percentage terms, relative to the average baseline daily schedule, for each room type. Also shown is the average number of hours per day the lighting system was actually in use
Room Type Occupancy sensor/wall switch savings, % (s.d.) Dimming Savings, % (s.d.) Schedule hours, hr (s.d.) Hours used, hr (s.d.) Switch on Other Switch off Photo sensor Scene setting Classroom 33.6 (35.5) 16.0 (20.9) 10.7 (16.2) 9.8* (11.2) 16.4** (15.7) 4.0* (8.4) 4.3** (6.5) 13.5 (2.1) 5.0 (4.3) Corridor 5.9 (10.6) 4.3 (7.6) 13.3 (16.0) 25.1*** (10.3) - 24.0 (0.0) 18.1 (6.2) Office 24.0 (33.1) 11.9 (15.7) 8.7 (17.4) 21.7*** (17.6) - 14.4 (4.1) 7.7 (5.0) * Matched Zones, ** Unmatched zones, *** Photosensor and Scene setting combined.
4. Conclusion
The college campus had a wide range of room types, operational hours and uses. As a result, the energy saved due to the control types present varied greatly depending upon room type and occupancy. Rooms that were occupied sporadically during the day, such as classrooms, benefited the greatest from the installation of manual wall switches and occupancy sensors. Individual lighting fixtures in rooms that were on for large portions of the day (e.g. offices) had some of the largest potential to save energy via the use of a photosensor.
Despite the detailed considerations described above, in simple terms this study demonstrates that substantial energy savings were realized with multiple controls in a field setting over many days and room types. Further, the host site was very pleased with the performance of the system and, using their own cost-benefit analysis, viewed the lighting control system as a very good investment.
Acknowledgments
This research was sponsored by the National Research Council Canada (NRC), the Program on Energy Research & Development, and Public Works & Government Services Canada (PWGSC), and by the Lighting Research Office, Electric Power Research Institute (EPRI) with the support of the J.H. McClung Lighting Research Foundation. Of the many generous people who facilitated our work, we are particularly grateful to: Jeff Choma, Sandy Hancock, Rob Mongrain, Mat Lefler (Georgian College); Chris Rigatti, Chris Ballard (Lutron Electronics Co. Inc.); Phil Santia (e-Lumen International Inc.); We also thank all of the building occupants, who accepted our presence in their work/study places.
References
1. National Resources Canada. Commercial/Institutional Secondary Energy Use by Energy Source, End-Use and Activity Type. 2009 [cited 6th April 2009]; Available from:
http://www.oee.nrcan.gc.ca/corporate/statistics/neud/dpa/tableshandbook2/com_00_1_e_3.cfm?attr=0#sources. 2. Canada Green Building Council, (2004) LEED green building rating system: reference package for new
construction & major renovations: LEED Canada-NC version 1.0. Version 1.0 ed., Ottawa: Canada Green
Building Council.
3. Jennings, J.D., et al. (2000) Comparison of control options in private offices in an advance lighting controls testbed. Journal of the Illuminating Engineering Society, 29(2), p. 39-60.
4. Galasiu, A.D., et al. (2007) Energy saving lighting control systems for open-plan offices: a field study. Leukos,
4(1), p. 7-29.
5. Morrow, W., et al., High performance lighting controls in private offices: A field study of user behaviour and
preference, in World Workplace. 1998: Chicago, Illinois.
6. Pigg, S., M. Eilers, and J. Reed. (1996) Behavioral aspects of lighting and occupancy sensors in private offices: a case study of a university building. ACEEE Summer Study on Energy Efficiency in Buildings, 8, p. 161-170.