d
Beyond the Seaport: Assessing the Inland Container Transport Chain
Using System Dynamics
by
Mamoun Toukan
Bachelor of Commerce in Finance and Economics, University of Toronto, 2011 and
Hoi Ling Chan
Master of Science in China Business Studies, The Polytechnics University of Hong Kong, 2007 Bachelor of Business Administration, The City University of Hong Kong, 2005
SUBMITTED TO THE PROGRAM IN SUPPLY CHAIN MANAGEMENT IN PARTIAL FULFILLMENT OF THE REQUIREMENTS FOR THE DEGREE OF
MASTER OF APPLIED SCIENCE IN SUPPLY CHAIN MANAGEMENT AT THE
MASSACHUSETTS INSTITUTE OF TECHNOLOGY JUNE 2018
© 2018 Mamoun Toukan and Hoi Ling Chan. All rights reserved.
The authors hereby grant to MIT permission to reproduce and to distribute publicly paper and electronic copies of this capstone document in whole or in part in any medium now known or hereafter created.
Signature of Authors ... Mamoun Toukan Department of Supply Chain Management
May 11, 2018 Signature of Authors ………... Hoi Ling Chan Department of Supply Chain Management
May 11, 2018 Certified by... Dr. Christopher Mejía Argueta Director of the MIT SCALE Network for Latin America
Capstone Advisor Certified by... Dr. Nima Kazemi Postdoctoral Research Associate, Center for Transport and Logistics Capstone Co-Advisor
Accepted by... Dr. Yossi Sheffi Director, Center for Transportation and Logistics Elisha Gray II Professor of Engineering Systems
Beyond the Seaport: Assessing the Inland Container Transport Chain
Using System Dynamics
by Hoi Ling Chan Mamoun Toukan
Submitted to the Program in Supply Chain Management on May 11, 2018 in Partial Fulfilment of the
Requirements for Master of Applied Science in Supply Chain Management
Abstract
The significance of seaports in enabling global trade and impacting global supply chains require them to operate efficiently. Due to the required interactions, seaports are not only affected by their operations, but by other parties in the transport chain. The existing interactions between multiple parties in the transport chain add complexity to the system. Using Jordan as a case study, and focusing on containerized transport, this paper develops a System Dynamics framework that assesses the impact of alternative strategies on the container transport chain. The paper first identifies the sub-systems in the Jordanian container transport chain, to introduce a conceptual model that illustrates the causal relations in the system. A System Dynamics framework is then presented to assess the impact of different strategies on the container transport chain. Based on industry trends in reducing container delivery time and adding capacity at the terminal, three different alternatives are introduced and simulated under multiple scenarios. The list of alternative strategies includes: investing in the hinterlands, implementing technology to reduce documentation processing time and a combination of both. The simulation output shows while the first alternative reduces the dwell time by over six days, it does not reduce delivery time. The second alternative is extremely effective in reducing delivery time but does not add resilience to the terminal’s capacity. The third alternative is the highest ranking in terms of delivery time and container turnaround. Simulating the third alternative again over a longer period shows that it outperforms the current alternative for up to 275 days only. The third alternative resulted in an increase in fleet utilization, which ultimately leads to a congestion in the terminal. Thus, a holistic view needs to be taken when assessing the impact of different strategies and ensuring the right KPIs are chosen. The presented framework is highly relevant to decision makers including policy makers and investors in Jordan and elsewhere. For Jordan, with government plans to reduce container dwell time, the framework provides added insights for decision makers, beyond the seaport.
Thesis Advisor: Dr. Christopher Mejía Argueta
Title: Director of the MIT Supply Chain and Global Logistics Excellence (SCALE) Network for Latin America
Thesis Co-Advisor: Dr. Nima Kazemi
Acknowledgement
It is with great pleasure to present our capstone project as part of the first graduating cohort of MIT’s Supply Chain Management Blended program. Foremost, we would like to thank our advisors Dr. Christopher Mejía Argueta and Dr. Nima Kazemi, for their continuous support and feedback throughout the project.
We thank our data sponsoring company, Aqaba Container Terminal, especially Mr Vincent Flament, COO of ACT, for supporting us with using ACT as a case study for the project. We are also extremely grateful to the industry experts whom have provided us with insights. The list includes but is not limited to: Mr. Jeppe Jensen – former CEO at Aqaba Container Terminal, and Mr. Sa’ad Nabulsi – Head of Operations at Arab Transit.
Our level understanding of System Dynamics modelling is highly credited to Professor David Keith, MIT lecturer in System Dynamics and Mr. Aditya Thomas, System Dynamics teaching assistant.
We also thank Toby Gooley for her feedback on the paper’s writing and structure. Our SCM family have provided us with the perfect environment to learn and share knowledge. Finally, and certainly not least, we thank MIT’s MicroMasters team for being pioneers in education and making the blended program a reality.
Table of Contents
1. Introduction ... 1
2. Literature Review... 5
2.1 Industry Trends ... 5
2.2 System Dynamics (SD) ... 6
3. Case Study: Jordan ... 9
3.1 Brief History of Aqaba ... 10
3.2 The Case for Investing in the Hinterlands ... 11
4. Methodology ... 12
4.1 Process Mapping ... 12
4.2 Conceptual Model ... 13
4.3 Simulation Model ... 13
4.4 Model Testing & Review ... 14
5. Data Collection ... 16
5.1 Container Volumes ... 16
5.2 Terminal Yard Capacity ... 16
5.3 Dwell Time ... 17
5.5 Trucking Capacity ... 17
6. Conceptual Model ... 18
6.1 Mapping the Import Process ... 18
6.2 Causal Loop Diagram... 20
6.2.1 Defining the Variables ... 20
6.2.2 Feedback Loops ... 21
7. Simulation Model... 23
7.1 Objective ... 23
7.2 Assumptions ... 23
7.3 Container Transport Chain Stock & Flow Model ... 25
7.3.1 Quayside Sub-System ... 27
7.3.2 Documentation Sub-System ... 27
7.3.3 Inland Container Transport Chain – Based on Current Infrastructure ... 27
7.3.4 Export Bookings Sub-System ... 28
7.4 Output – Base Case – Only One Ship – 30 Days ... 29
8. Assessing Alternative Plans ... 30
8.3 Alternative 3: Hinterland Move & Technology Implementation ... 31
8.4 Alternatives Output Under Base Scenario ... 31
8.5 Scenario Analysis ... 33
8.6 Simulation Under a One-Year Period ... 35
8.7 Discussion of Results ... 36
9. Conclusion and Future Research ... 38
Appendix ... 40
Appendix A – Jordan’s Economy ... 40
Appendix B – Data Collection ... 42
Appendix C – Causal Loop Diagram ... 44
Appendix D – Stock & Flow Model ... 45
Appendix E – Simulation Model ... 51
List of Figures
Figure 1. Summarized Methodology ... 12
Figure 2. Jordan's Containerized Import Process ... 18
Figure 3. Jordan's Container Transport Chain CLD Model ... 20
Figure 4. Quayside Sub-System ... 26
Figure 5. Documentation Sub-System ... 26
Figure 6. Inland Container Transport Chain ... 26
Figure 7. Export Booking Sub-System ... 26
Figure 8. Container Terminal Yard Capacity ... 26
Figure 9. Trailers Turnaround ... 26
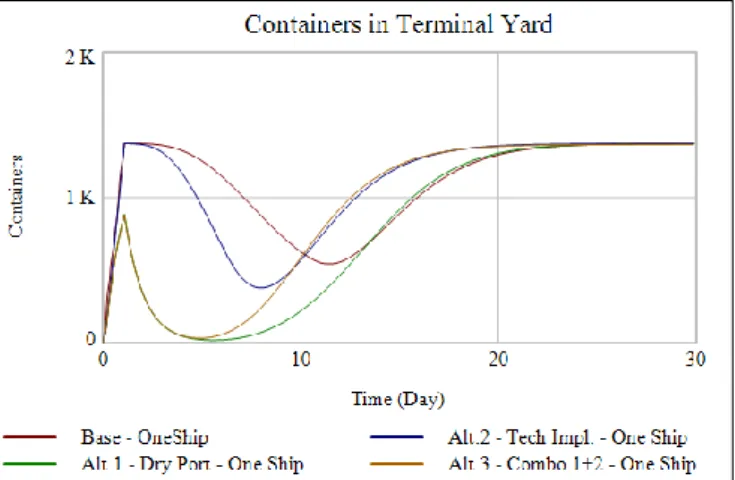
Figure 10. Containers Turnaround for Different Alternatives Under Base Scenario ... 31
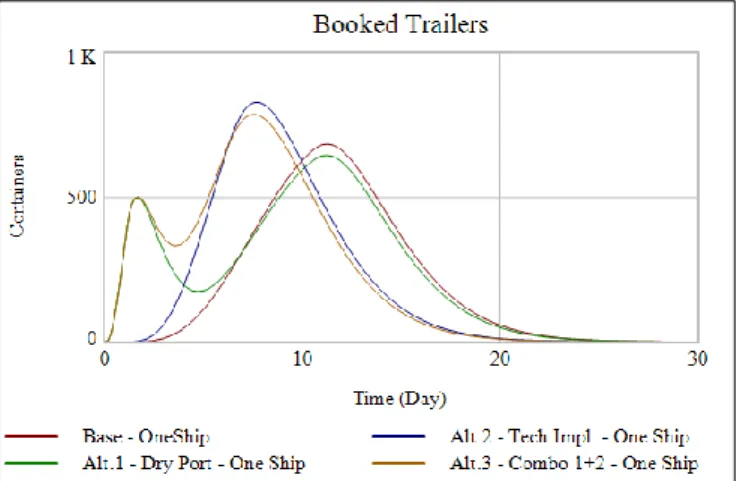
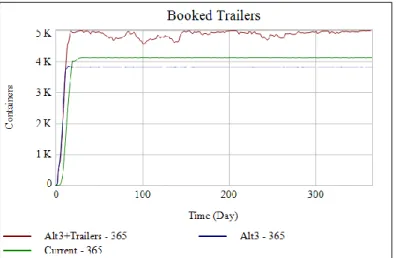
Figure 11. Booked Trailers for Different Alternatives Under Base Scenario... 32
Figure 12. Containers Deliveries for Different Alternatives Under Base Scenario ... 32
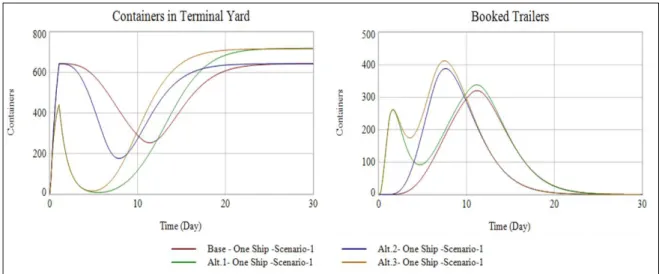
Figure 13. Alternatives Output Under Scenario 1 ... 33
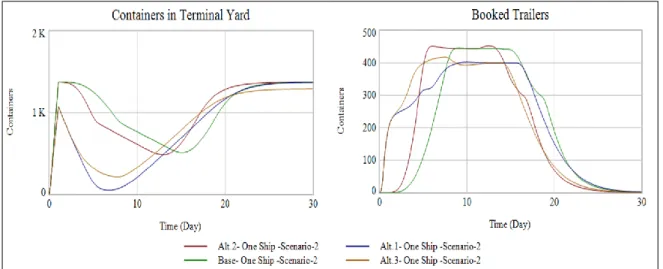
Figure 14. Alternatives Output Under Scenario 2 ... 34
Figure 15. Alternatives Output Under Scenario 3 ... 34
Figure 16. Booked Trailers - One-Year Simulation... 35
Figure 17. Containers Turnaround - One-Year Simulation ... 35
Figure A. 1. Jordan's GDP Growth ... 40
Figure A. 2. Jordan's Population Growth ... 40
Figure A. 3. Global Logistics Performance Index in 2016 ... 41
Figure B.2. 1.Aqaba Container Terminal's Throughput ... 42
Figure B.2. 2. Breakdown of Full Containers ... 42
Figure B.2. 3. Import Containers Dwell Time ... 43
Figure D. 1. Inland Container Chain - Extended Model ... 50
Figure E.3. 1. Containers Ready for Pick-up Stock Under Base Case ... 53
Figure E.3. 2. Containers Turnaround Under Base Case ... 53
Figure E.3. 3. Daily Booked Trailers Under Base Case ... 53
Figure E.3. 4. Base Case – Stock Values – One Ship Only – Scenario 0 Output ... 54
Figure E.3. 5. Alternatives Outputs – Stock Values – One Ship Only – Scenario 1 ... 54
Figure E.3. 6. Alternatives Outputs – Stock Values – One Ship Only – Scenario 2 ... 55
Figure E.3. 7. Alternatives Outputs – Stock Values – One Ship Only – Scenario 3 ... 55
Figure E.3. 8. Available Trailers Under One-Year Period ... 57
Figure E.3. 9. Container Acceptance Under One-Year Period ... 58
List of Tables
Table 1. Literature Contribution Table ... 8Table 2. CLD Feedback Loop Descriptions ... 21
Table 3. Alternatives Ranking Under Each Scenario ... 34
Table C. 1. CLD Variables Description ... 44
List of Abbreviations
Abbreviation Description
ACT Aqaba Container Terminal
CLD Causal Loop Diagram
GDP Gross Domestic Product
IMO International Maritime Organization
JV Joint Venture
KPI Key Performance Indicator
LPI Logistics Performance Index
SD System Dynamics
1. Introduction
Seaports play an instrumental role in enabling global trade and can significantly impact global supply chains. According to the International Maritime Organization (IMO), Maritime transport accounts for 90% of global trade activities (UN, 2018), of which containerized trade value is believed to account for approximately 60% (Statista, 2017). To compete globally seaports are no longer seeking solutions within their grounds, but rather looking beyond their gates to offer greater integration into the inland transport chain.
The movement of containers from and to seaport requires interactions between multiple subsystems which involve different stakeholders and processes. Delivering a container from the terminal, requires interactions with the following parties: container terminal, customs, inspection authorities, ship agents, freight forwarders and carriers. These interactions add complexities to the container transport chain. The impact of an improvement in one process may be limited because of a constraint in another. For example, reducing the number of days to complete import documentations may not result in improving the container delivery time to destination if trucking capacity is limited.
Understanding the complexities in the container transport chain is important to policy makers, investors and all stakeholders in the system. Failure to consider the subsystem interdependencies can result in suboptimal solutions (Ng & Lam, 2010), or worse, create congestion in the terminals. Evidence of that was seen in 2003 in Jordan, when it’s only outlet to the sea, Aqaba, experienced the worst congestion and ships waited 150 hours to berth (WorldBank, Trading Across Borders - Case Study: Jordan, 2008). At the time the container terminal was operated by the government and limited measures were taken to avoid a severe congestion. This prompted the government to take measures and invite international container operators to operate the port and relieve the terminal from congestion. APM Terminals was
1. Introduction
then awarded a two-year management contract, and based on performance, were invited to get into a joint venture agreement with Aqaba Container Terminal (ACT).
Despite ACT’s success, Jordan’s logistics infrastructure remains relatively weak, according to World Bank’s Logistics Performance Index (LPI) (LPI, 2016). Jordan’s growing population and Gross Domestic Product (GDP) suggest greater volumes of import containers, and more so if cargo to Iraq and Syria are transited through Jordan again. To avoid potential backlogs and higher costs, the policies and infrastructure in place should be able to accommodate the increase in container volumes.
The objective of the study is to develop a framework that assess the impact of policy and investment changes related to cargo movement on the container transport chain. The developed framework focuses solely on the Jordanian container transport chain. As the paper’s findings present: to increase container turnaround and reduce the container delivery time, a holistic view is needed to assess the impact of different alternatives. Hence, to implement the right strategies, it is vital policy makers and other stakeholders understand the complexities that exist in the container transport chain.
By limiting the scope to the delivery time of containerized cargo, and using Jordan as a case study, the paper answers the following:
1. What are the main subsystems affecting the container delivery time?
2. How do the identified subsystems relate to one another and affect the container delivery time and the container transport chain, as a whole?
3. How can System Dynamics be used to assess the impact of changes in any of the identified subsystems on the container transport chain?
The paper defines Jordan’s containers transport chain as the sequence of processes involved in moving import containers from the port, to the receiver, and back, as empty or full, for exporting. The first and second questions are addressed by mapping the containerized import process in Jordan. The process was mapped after conducting interviews with local
stakeholders, which included the container terminal, customs brokers, transporters and freight forwarders. Data from the Container Terminal provided historical records of volumes and trends of container movements. To answer the third question, and fill the gap in literature, the study develops a System Dynamics (SD) framework that assesses the impact of policy and investment changes on Jordan’s container transport chain.
The developed SD model provides the relevant stakeholders in Jordan’s container transport chain with key insights into how they and the system are impacted under different decisions and scenarios. The benefits of having such a framework provides decision makers with a tool to assess the effectiveness on a policy and investment change on the container transport chain. In addition, the framework can also be used to evaluate the container transport chain’s level of resilience and ability to accommodate shocks in the system, like surges in container volumes. The developed framework is significantly relevant to Jordan, and other areas that are highly dependent on their seaports. The study does not provide any investment or policy change recommendations but provides examples alternatives to showcase how the framework can be used. The study’s made possible by the support of Aqaba Container Terminal, operated by APM Terminals, providing data and information to support the research.
The alternative decisions simulated are based on recent trends in the industry and expected decisions and improvements to be made in Jordan. The alternatives included: an investment in a dry port, investment in technology to reduce documentation processing time and investment in both dry port and technology. Based on the model’s output, the paper emphasizes the importance of leveraging System Dynamics to understand the complexities in the system and effectively assess alternative decisions. The developed model provides a starting point into how SD can be used in the container transport chain, and further developments are outlined in the conclusion and future research section.
1. Introduction
The subsequent parts of the paper are as the follows: Section 2 presents a literature review on industry trends and System Dynamics modelling. Section 3 provides an overview of Jordan and its Container Terminal. Section 4 outlines the methodology that has been used. Section 5 presents data collected relating to Jordan’s container transport chain. Jordan’s container transport chain is presented along with a conceptual SD model in Section 6. A stock and flow SD model is introduced in Section 7, and a list of alternatives are simulated under multiple scenarios in Section 8. Finally, conclusions and the areas of future research are drawn in Section 9.
2. Literature Review
In this part of the study, the literature review includes industry trends and work on applying systems-thinking in the maritime industry. The industry trends focused on methods employed by container terminals to reduce congestion and achieve faster deliveries, which are used as basis for determining alternatives in the simulation model. Industry trends relating to greater integration across the chain further reinforce the importance of taking a holistic view when assessing decision impacts.
2.1 Industry Trends
To achieve greater economies of scale, ocean carriers are heavily investing and deploying mega-ships, with capacities greater than 8,000 TEUs (Prokopowicz, A. & Berg-Andreassen, J. , 2016). With the larger volumes of containers transported, ports are under tremendous pressure to discharge and load containers in a short period of time. The rise of containerized trade and lack of capacity at the terminals are increasing bottlenecks in the landside transport system serving the seaports (Roso, V. & Lumsden, K. , 2009).
The progress in the maritime part of the transport chain, without improvements in the seaport side is not sufficient for the entire containerized transport chain to function (Roso & Lumsden, 2010). Moreover, current industry trends show carriers and terminals are widening their scopes, through vertical integration (Van De Vorrde & Vanelslander, 2009) , i.e. combining container shipping, ports and logistics business. Terminal operators are investing and owning stakes in rail operators and inland subsidiaries to complement their services. In addition, the trend is also in line with the shippers increasingly demand efficient and suitable multimodal transport services (Veenstra, Zuidwijk, & Van Asperen, 2012).
To accommodate for the surge in container volumes while being constraint in capacity, the development of dry ports in the hinterlands became an urgency (Acciaro, M. & McKinnon, A., 2013). A dry port is an inland intermodal terminal connected to seaports, where customers
2. Literature Review
can drop off and collect containers as if they are directly doing so at the seaport (Roso, 2002). The advantages resulting from dry ports include: better customer service, lower transport cost, increased value-added services, faster delivery times, simplified documentation and lower storage rates (Roso & Lumsden, 2010).
Between 2004 – 2005, an unpredicted rise in the volumes of containers from China reached Europe, congesting terminals between Hamburg to the Le Havre range and an extreme idea emerged: The Extended Gate Concept (EGC). Under EGC, congestion can be reduced by having the container terminals be able to push blocks of containers to nearby dry ports, instead of having to wait for import containers to be picked up by importers (Veenstra, Zuidwijk, & Van Asperen, 2012).
New technology implementation shortened the overall documentation time. Container giant Maersk and IBM formed a joint venture with apply blockchain. The technology enabled permissioned parties access to trusted data in real time to reduce the total documentation time (Aitke, 2018). An Israel-based start-up carried a pilot to streamline the documentation process by using blockchain and it was drastically expedited shipping documentation process from 10 days to 2.5 hours. (Shalev, 2017).
The current trends indicate the industry seeks to achieve economies of scale by employing bigger vessels, which requires moving containers faster and greater coordination across the chain. Through the studied literature the industry is currently following two main trends: expanding capacity and increasing integration. To expand constrained capacity investments in the hinterlands are being made. Technology can be used to increase integration across the chain.
2.2 System Dynamics (SD)
With the rapid advances in technology, expanding boundaries and uncertainties in the global economic landscape, complexities in the maritime industry continue to increase (Ng &
Lam, 2010). System Dynamics is a methodology for studying and managing complex feedback systems (Forrester, 1961). As an application of systems thinking, SD identifies the underlying structure of a system to gain insights into behaviours, focusing on the interactions between components of a system (Sterman, 2000). SD allows stakeholders to design policies that seek to eliminate unwanted patterns of behaviour through modifying the underlying system structure (Kirkwood, 1998).
SD methodology had proved to be an appropriate approach to study complex maritime transportation system (Oztanriseven et al, 2014). There have been several applications on SD in maritime, ranging from modelling of freight rates evolution in global shipping, (Veenstra and Lundema, 2003), to determining the number of crude oil tankers to be chartered (Coyle, 1978).
As for port competitiveness evaluation, Ho and Hui (2008) studied the investment decisions ports can take to improve their operational capabilities. Caballini et al. (2012) have simulated the port rail process in Italian ports using SD. Ng and Lam (2010) employ a SD holistic approach to the evolution of global container ship capacity. Cheng et al. (2010) demonstrated the relationship between berth and yard system for assisting the terminal managers in decision making. Croope and McNeil (2011) used SD to help decision maker to understand the variables involved in the strategies to improve resilience of critical infrastructure systems and recognized the impact of diesters. Yeo et al. (2012) applied SD to simulate policy change – with implementing port security related regulations.
Literature did not create a System Dynamics framework for the inland container transport chain, which assesses the impact of different policies on the transport chain, as a whole. In addition, no literature reviewed the Jordanian container transport system. See at Table 1. for summary of literature contribution.
2. Literature Review
Table 1. Literature Contribution Table
Authors, Year Title Dry Port Technology SD Approach
Van De Vorrde & Vanelslander, 2009)
Market power and vertical and horizontal integration in the maritime shipping and port industry.
Qualitative
Veenstra, Zuidwijk, & Van Asperen, 2012
The Extended Gate Concept for Container Terminals: Expanding the Notion of Dry Ports.
Qualitative
Acciaro & McKinnon, 2015
Efficient hinterland transport infrastructure and services for large container ports
Qualitative
Shalev, 2017 Blockchain Pilot Drastically Expedites Shipping Documentation Process
Qualitative Oztanriseven, et
al, 2014
A Review of System Dynamics in
Maritime Transportation.
Quantitative
Caballini, Sacone, & Siri, 2012
The Port as a System of Systems: a System Dynamics Simulation Approach
Quantitative Ng and Lam,
2011
Dynamic Maritime Systems
Inquiry: The Driver Approach
Quantitative
Cheng et al. (2010)
Understanding the complexity of container terminal operation through the development of system dynamics model
Quantitative
This Study, 2018 Beyond the Seaport: Assessing the Inland Container Transport Chain Using a System Dynamic Approach
3. Case Study: Jordan
Located in the Middle East, Jordan has a population just over nine million, and a GDP of USD 38.74 billion in 2016 according to figures by the World Bank (WorldBank, The World Bank Data, 2016). Jordan is known to have insufficient supplies of water, oil and other natural resources, underlying the government’s heavy reliance on foreign assistance (CIA, 2018). Figure A.1 presents Jordan’s GDP and the growth rate from 2008 – 2016, and Figure A.2 depicts the country’s population and growth rate in the same period. Jordan’s population has experienced a 45% growth between 2008 and 2016. GDP grew by 75% in the eight-year period between 2008 and 2016, and GDP per capita has increased by 21% in that same period (WorldBank, The World Bank Data, 2016).
Jordan currently ranks 67 in the Logistics Performance Indicator, LPI, an indicator developed by the World Bank in 2016 (LPI, 2016). The LPI compares the following factors to the global community: the customs clearance process, infrastructure, ease of arranging international shipments at competitive prices, logistics competence, tracking and tracing and timeliness. Figure A.3 presents Jordan’s LPI ranking benchmarked against other countries.
Jordan is an import-dependent country, with Aqaba being its only access to the sea. The country imports almost everything from raw materials and food stuff to manufactured goods and industrial equipment. Main exports include potash, Sulphur, fertilizers, cloths, and other products (CIA, 2018). Due to the geographic location and political stability of the country, Aqaba has not only been Jordan’s access to the sea but has also acted as a gateway to Jordan’s neighbouring countries and more specifically to Iraq. With the political turmoil in Iraq and Syria, both borders were completely shut since 2013 and transit business to these areas via Aqaba was completely halted, refer to Figure B.2.2.
3. Case Study: Jordan
3.1 Brief History of Aqaba
Aqaba is in the northern Red Sea, at the junction of trading routes between five countries; Iraq, Israel, Palestine, Saudi Arabia and Syria. Because of its multi-modal transport system, it emerged in the 1980s as the third largest Red Sea port, after Suez in Egypt and Jeddah in Saudi Arabia (UNDP, 2012). Aqaba has three ports: Aqaba Main Port (bulk terminal – operated by a governmentally owned company, the Industrial Ports (owned by the same governmentally owned company) and Aqaba Container Terminal (handles all container vessels – JV between APM Terminals and Aqaba Development Corporation). Aqaba Container Terminal is the focus of the study.
It took a crisis to bring about the recognition that the terminal needed serious change. In mid-2003 the terminal came to a standstill, experiencing the worst congestion in its history. Vessels docking at the port often faced anchorage-waiting times of 150 hours (WorldBank, Trading Across Borders - Case Study: Jordan, 2008). The congestion compelled some local traders and shipping lines serving Iraq to use ports in more distant Lebanon and Syria. Aqaba Development Corporation (ADC), signed a 2-year management contract with APM Terminals in March of 2004. ADC is a government entity with the purpose of looking after investments in Aqaba. Based on APM’s performance a joint venture agreement forming ACT in 2006 (WorldBank, Trading Across Borders - Case Study: Jordan, 2008).
The increase in population and GDP means Jordan should expect a greater volume of cargo in the future, given it’s an import dependent country. Moreover, the reopening of the Iraqi border, may results in a rise in transit cargo through Aqaba. To ensure Aqaba remains competitive for domestic and transit cargo, policy makers must assess the impacts of policies and investments on the total logistics costs. The total logistics cost includes the costs associated to transportation, documentations and delays.
The dwell time, or the average time to have an import gate out of ACT was nine days in 2016, refer to Figure B.2.3 ADC seeks to reduce the dwell time to three days through improvements in custom clearance process and infrastructure investments (Times, Jordan Times, 2017).
3.2 The Case for Investing in the Hinterlands
As per a local news article in the Jordan Times, Amman Customs, the second largest custom point in Jordan after Aqaba, is expected to move to a new facility. The new Amman Customs will have an area potentially to host an inland terminal and may in the future be linked by rail to Aqaba (Times, Jordan Signs Deal for Amman Customs Centre, 2017).
The move to the hinterlands presents a decision to be made by investors and policy makers. Questions that should be asked are what would the impact be on the container turnaround time? The delivery times? And other stakeholders in the transport chain?
4. Methodology
4. Methodology
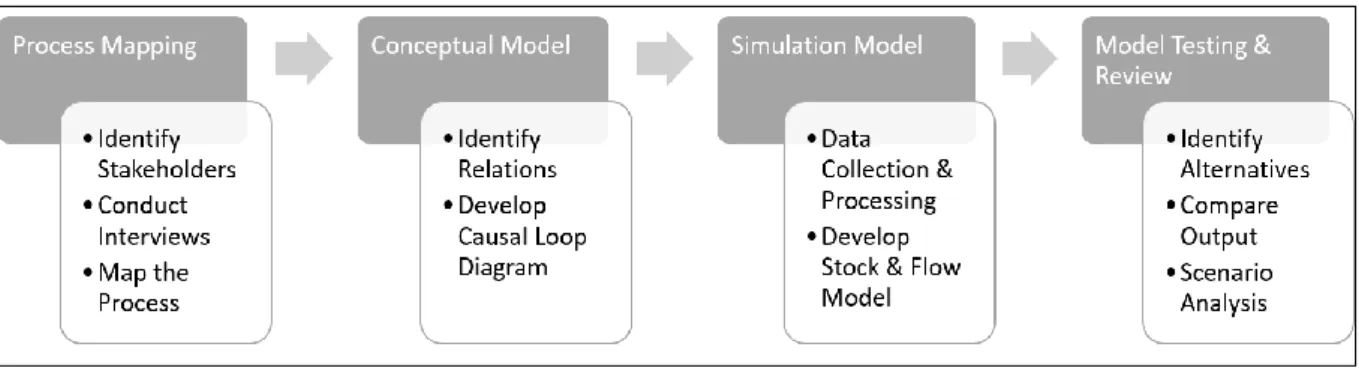
This section outlines the methodology used to answer the paper’s research questions. The first and second questions relating to identifying the main subsystems in Jordan’s container transport chain were addressed by mapping the import process. The process was mapped by conducting interviews with local stakeholders and leveraging both authors experience in the industry. A Causal Loop Model (CLD) was constructed to understand the relations and complexities Jordan’s transport chain. To answer the third question, a stock and flow SD framework was modelled to assess the impact of the alternative decisions on the container transport chain. A list of alternative decisions and KPIs were identified to showcase how the framework can be used to compare alternatives under different scenarios. Figure 1 summarizes the methodology followed by the study.
Figure 1. Summarized Methodology
4.1 Process Mapping
To map the container import, process the relevant stakeholders had to first be identified. The import process was initially mapped using both authors experience in the industry followed by an interview with ACT, Jordan’s main gate-way to containerized trade. After interviewing ACT, stakeholders were identified, and interviews with several stakeholders representing each sector was conducted. In addition to ACT, the stakeholders interviewed included: local freight forwarders, ship agents, transporters, and customs brokers. Each stakeholder was asked what they perceive the process is, and what their role in the transport chain is. The aim of the interviews was to understand the complexities that existed in the container transport system.
To better understand the complexities, interviews were conducted in form of open-ended discussions. A full import container cycle was finally constructed mentioning the average times to complete each process. Moreover, findings showed that the lack of integration between processes caused delays in the import container pickups. Refer to Appendix B for list of interviewees.
4.2 Conceptual Model
After understanding the process, a CLD was constructed to illustrate the conceptual relationship that exists between the stakeholders and processes. To do so, the variables that affect each subsystem were identified, and connected with an arrow showing the polarity relationship, positive or negative. A positive relation means an increase in a variable will increase the connected variable, for example an increase in container volumes will increase terminal utilization. While a negative relation means an increase in a variable causes a decrease in another. The CLD provides additional insights into how different elements in the system interact to generate feedback loops. The CLD focused on how changes in the variables will ultimately affect time delays, and the terminal’s competitiveness in the long run. The CLD was developed using Vensim, part of the Ventana Simulation Suite.
4.3 Simulation Model
Data collection complemented the understanding of the process and provided additional insights into recent trends, which were used as basis of assumptions in the simulation model. Since Jordan is an import dependent country with full containerized imports representing over 75% of full containerized trade 1 more emphasis have been placed on the import containerized movement process. Data relating to container flows were collected through secondary sources, which included Aqaba Container Terminal for container volumes and Jordan’s Land Transport
4. Methodology
Regulatory Commission for data relating to trailers. Data collected included annual TEU throughput and its break-downs since 2006 (since APM Terminals began operating ACT), container dwell time over a two-year period, weekly vessel schedules over the past 2 years, daily trucking flows. In addition, terminal capacity has been looked at and how much the terminal space being utilized over the year was analysed. Road is the only mode of inland container transport. To limit framework’s level of complexity and focus on the main objective several assumptions were made. Data were aggregated accordingly.
To create a framework that assess the impact of alternatives on the container transport chain, a stock and flow model was built. The model provides quantifiable outcomes based on behaviours in the system, which provide added insights compared to the CLD. Vensim was used to create a Stock & Flow diagram that can be simulated.
4.4 Model Testing & Review
A list of alternatives was introduced to showcase how the framework can be used to assess the alternatives under different scenarios. Three alternatives in addition to the status quo (the base case) were identified. The alternatives identified were based on industry trends and initiative decisions expected to be taken in Jordan over the coming year. Investment in a dry port, technology implementation, and a mix of both dry port and technology implementation, are the three alternatives compared.
To further compare alternatives three KPIs are defined and each alternative output is ranked relative to the others. The best output performance is given a rank of 4, and the lowest is given a rank of 1. The alternatives are compared against three KPIs: Container turnaround (the number of days for a container to leave and return to the terminal), trailers occupancy (the number of trailers/ trips required to complete a container turnaround), and delivery time (number of days to deliver a container). Though container dwell time seems to be an area of concern for ADC, it was not selected as a KPI, as a reduction in container dwell time does not
mean a reduction in delivery time. However, a reduction in delivery time, meant that the dwell time was reduced.
The alternatives were also tested under three scenarios and ranked. The scenarios included constraints in the following: container terminal yard capacity, trucking capacity and documentation capacity. The simulation model was run under a thirty-day period and one ship arrival. The reasoning is to showcase clearly the container turnaround cycle.
The highest-ranking alternative was then simulated over a one-year period with a daily ship arrival. The longer period simulation showcases if it still outperforms and what additional insights are gained when simulating the model in longer time-periods.
Due to the paper’s scope and limited data from stakeholders outside the terminal, the simulations conducted were not based on actual numbers. The simulation output graphs portray the general trend that is expected based on the system’s complexities identified. Following the assessment of the alternatives under different scenarios the conclusion section provides what steps are needed to further develop the framework and employ it practice.
5. Data Collection
5. Data Collection
Secondary sources were mainly used to for data collection. Due to the lack of available data centers for processing times and transport times, interviews with locals in the industry were conducted to estimate the delays. Secondary sources, data from Aqaba Container Terminal and Jordan’s Trade & Transport Commission were collected to estimate capacities and annual moves. The data collected served as basis for the chosen inputs in the simulation model. Appendix B provides details on the collected data from ACT.
5.1 Container Volumes
Total TEU throughput has increased by 95% from 405,658 in 2006 to 792,841 in 2016, as outlined in Figure B.2.1. TEU throughput is defined as the number of containers, both imports, transhipment and exports, in twenty-foot equivalent units handled by a container terminal per year. Figure B.2.2 presents the breakdowns of the full container flows. Import containers represent the highest number of full containers handled at the Terminal, at 75% in 2016. Exports represent about 23% of full containers, and transit containers represent less than 2%. The average number of TEUs discharged per vessel in 2017 was 1,909. Based on a 46% and 54% share of 20’ft and 40’ft containers, respectively, the average number of containers per vessel is 1,394.
5.2 Terminal Yard Capacity
The stacking area of Aqaba Container Terminal is 450,000 m2 which can accommodate 113,527 TEU per day2. According to container data from ACT between 2014 – 2016, 20’ft and 40’ft container sizes were represented at 46% and 54%, respectively. Assuming the same ratio of 20’ft to 40’ft containers, the maximum terminal capacity will be 82,876 containers3.
2 Calculation: Stack area: 450,000 m2, area of a standard 20-ft container: 14.8645m2. Each stack allows 4 layers of
containers. Assuming ¼ area was aisle area. The maximum capacity (TEU): 450,000m2/14.8645m2) *4-
(450,000m2/14.8645m2)*¼ = 113,527 TEU.
3 Total TEU in terminal: 13,527 TEU. 46% of the total containers were 20’ft TEU, meaning 113,527 TEU*0.46 = 52,223
5.3 Dwell Time
Container dwell time is the number of days to pick up an import full container. According to 2016 data, the average dwell time was around 9 days. Figure 5 illustrates the containers dwell time distribution at Aqaba for 2017. To compute the number of days to deliver a container and return empty back to the terminal, interviews were relied upon to provide estimated input values.
5.5 Trucking Capacity
According to the Jordanian Land Transport Regulatory Commission in 2017, the numbers of container registered trucks were 4,661, of which 26% and 75% were owned by trucking companies and individual owners, respectively.
6. Conceptual Model
6. Conceptual Model
6.1 Mapping the Import Process
To understand the physical, information and money flow of the process, interviews were conducted with ACT, local transporters and freight forwarders in Jordan listed in Appendix B. The interviews also provided the time estimates of process times that couldn’t be validated due to lack of data. In addition, both authors have years of experience in containerized transport, one worked in a major shipping line and the other worked in a logistics company based in Jordan. Mapping the import process identified the parties involved, as well as their responsibilities in the Jordanian containerized transport chain.
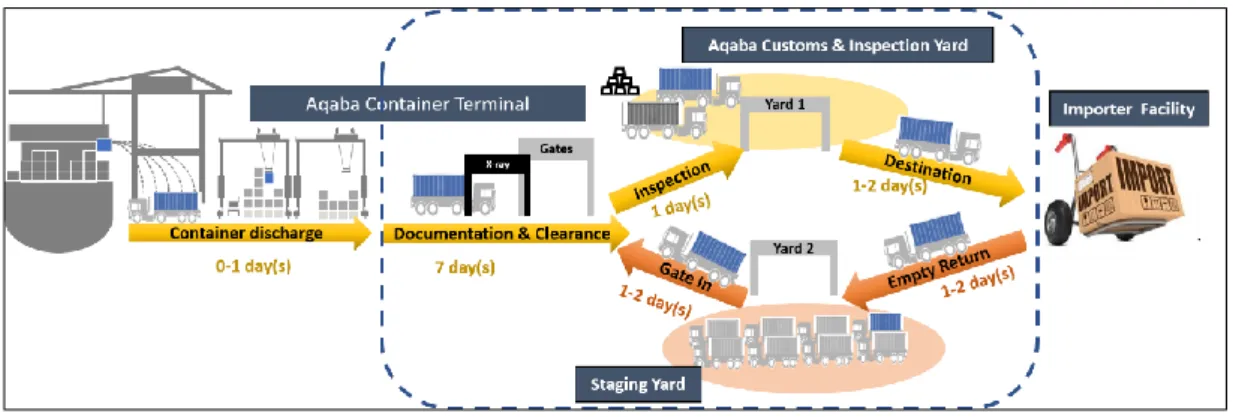
Figure 2. Jordan's Containerized Import Process
Figure 2 depicts the physical flow of a typical dry, general cargo import container at Aqaba, and presents the time delay that exists. The containerized import process is summarized as follows:
1. Prior to vessel arrival: the ship agent submits the custom manifests, and load and discharge list to ACT and custom. Carrier vessels calling ACT usually have time windows, where vessels arrive in a specific time slot and the Terminal services them. 2. On average it takes 1-2 days depending on containers to discharge/ load for operations
to be completed from vessel berthing.
3. After discharging is complete, the ship agents, located in Amman, issues the delivery orders to consignees or their representatives upon the submission of the bills of lading.
4. The delivery order is then couriered to Aqaba, which arrives the following morning, and custom formalities start in Aqaba.
5. Custom declaration is issued within hours. Depending on the cargo type, the declaration would mention what type of inspection is needed, in case any.
6. Charges on the declaration as well as port dues (THC and storage, if any) are paid, and a trucking permit is issued.
7. Trucking permit is sent to a trucking company, who will book a trailer which will proceed to picking up container.
8. Depending on traffic at the terminal, trailer gates-in and picks up the container, and proceeds to inspection yard (in case inspection needed). The inspection yard (also known as Yard 4) is located approx. 28 KM away from the terminal.
9. Container is inspected while on trailer (only during business hours) and can then proceed to destination.
10. The container can then be delivered to the destination, with 70% chance the final destination is Amman (according to interview with Jordan’s Land Transport Regulatory Commission). The trip takes about 1-2 day for container to arrive destination and be unloaded.
11. The empty container will then be returned. Based on the liner agent’s preference the empty container can either be returned to a deport in Amman or to the terminal. Empty containers are returned to depots in Amman, when exports are expected to be booked, which usually are a small fraction of the exported containers.
6. Conceptual Model
6.2 Causal Loop Diagram
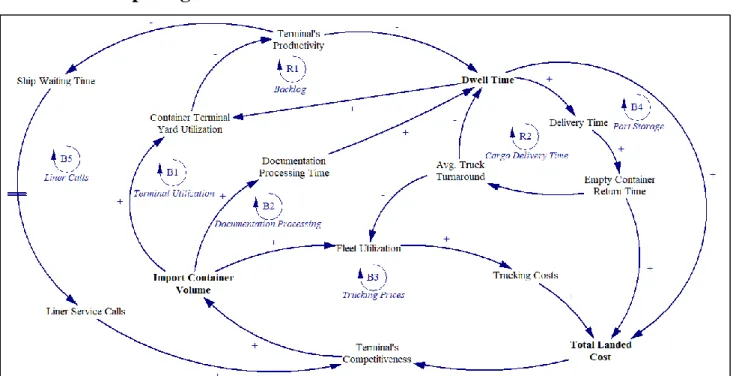
Figure 3. Jordan's Container Transport Chain CLD Model
6.2.1 Defining the Variables
The variables identified in the system were based on the process mapped in Figure 2. To keep the CLD concise, the Documentation Processing Time, combined both the ship agent and custom formalities part, as they both had a similar impact on the container flow. To avoid redundancies, some variables were skipped, such as custom inspection time, and container pick up time, as they are affected by the Dwell Time and affect the Delivery Time. An increase in the dwell time, will increase the container pick up time, which will result in a delay in inspection, and affect the delivery time. Table C.1 defines the CLD variables. Since the CLD is used to conceptually explain the interactions quantitative formulations are not defined. Figure 3 provides a holistic view of the elements in Jordan’s container transport chain, and how they influence once another and the overall system.
The CLD model focuses on the variables that would affect one another in the container transport system in an unconstrained time frame. Outside factors, which are beyond the system’s control, such as macroeconomic and political factors, have been excluded.
6.2.2 Feedback Loops
The CLD model depicted in Figure 3 presents the conceptual relations between the variables in the container transport chain system. Understanding the feedback loops is critical to identifying the strengths and weaknesses in the system. Reinforcing feedback loops are denoted with an “R”, while the balancing loops are denoted with a “B”. The model looks at how changes in any variable affects others, and the time delays, which ultimately impacts the total landed cost. As the total landed cost increases, which reduces the terminal’s competitiveness, and businesses will seek alternatives to using Aqaba, thereby reducing the container cargo volume. It is vital to keep the concept of “all else equal” in mind when trying to understand the feedback loops. The feedback loops can also have different magnitudes at different points in time.
Table 2. CLD Feedback Loop Descriptions
Loop Loop Name Description
B1 Terminal Utilization
As import container volumes increase, the terminal’s yard occupancy increases, increasing the yard utilization. With time, the number of containers in the yard get close to capacity, terminal productivity will be reduced, which will affect the time it takes to service container pick-ups by trucks and increasing the dwell time. As containers stay longer at the port, the total landed cost increases, from the port storage incurred, and container detention. Increase in costs and time to delivery reduces the Terminal’s competitiveness, and thus reducing the future import container volumes.
B2 Documentation Processing
With the increased in container volumes, it would take more time for documents to process, leading to a higher dwell time, higher cost, and ultimately a higher total landed cost. A higher total landed and time to deliver reduces the Terminal’s competitiveness. B3 Trucking
Prices
The increased in container volumes increases the demand for trucking, leading to a higher utilization of trucks. As trucking monthly capacity is limited, prices will be driven upwards, increasing the total landed cost and reducing the Terminal’s competitiveness. B4 Port Storage The longer time it takes to pick up a container, the higher the port storage charges will be
incurred, leading to a reduction in terminal’s competitiveness.
B5 Liner Calls The reduction in the Terminal’s Productivity, means that arriving ships may need to wait longer to be serviced. This would increase the cost on the carrier, and with time carriers will either introduce surcharges, or halt certain services that call Aqaba. Halting services or introducing surcharges will reduce the terminal’s competitiveness.
R1 Backlog The increase the Container Terminal Yard Utilization, leads to lower productivity, which leads to a higher dwell time. As containers stay longer at the Terminal, they Terminal’s utilization increases further, ultimately leading to longer waiting times.
R2 Cargo
Delivery Time
As the time to deliver container increases, the time to return the empty container back to the Terminal increases, leading to a lower turnaround time for the trucks. As truck turnaround decreases the time to pick up a container increases, ultimately leading to a further reduction in truck turnaround and increase in delivery time.
6. Conceptual Model
Balancing loops arise when any of the variables have a constraint. The container terminal is constraint by the yard capacity, employees, and equipment. Documentation is constraint by the number of employed ships agents, custom brokers, customs and inspection personal. Trucking is constraint by the number of trucks, drivers, and the regulatory allowed number of monthly trips they can make. Certain constraints can be increased by hiring more; however, training will be needed, which makes hiring not an immediate solution. Other constraints might require additional investments in land and equipment, and these would take time. An improvement in any of the variables may not always lead to an improvement in the overall system. For example, investment in additional capacity in the terminal would not reduce chances of being congested in the long-term if the documentation and trucking capacities are not adjusted.
7. Simulation Model
7.1 Objective
The objective of the developed stock and flow is to showcase how SD can be used to assess the impact of alternative strategies on the inland container transport chain. The model was designed to follow Jordan’s current import container flow as modelled in Figure 2. and adds the empty return and export process. The assessment of the alternative strategies on the container transport chain are measured against time in days.
The import container movement is the trunk of the model and it is affected by the following sub-systems: quayside, documentation, trucking, container terminal yard, and container movement (both imports and exports). Further details about the model’s formulations are included in Appendix D.
7.2 Assumptions
Several assumptions have been made to maintain simplicity, as the paper’s scope is limited to showcasing how a SD framework can be used. The following are the list of assumptions are made:
• Containers are the units of measure; size and types are assumed to be the constant. • Trailer sizes are assumed to be constant, and one trailer loads one container only. • Berthing rates based on berthing availability and container availability of space in the
container terminal yard.
• Terminal productivity affects ship discharging and loading rate and assumed to be at a constant rate of 100%, and only drops to 0% when yard utilization becomes 100%. • The documentation process includes the documentation processed by the ship agent, the
custom clearance and customs. A third order delay is assumed. A third order delay is a cascade of three orders of delays, which is a good representation of the number of delays that in the documentation process.
7. Simulation Model
• Import documentation process begins once containers are discharged to the terminal yard. • Empty containers for exports are picked up from a container depot only, and not from
the container terminal.
• To fulfil an export booking, the number of containers requested must be available in the empty depot. The number of empty containers that are dropped off at the depot can be predetermined before the simulation run.
• When the stock of containers in the yard reach the container terminal yard’s capacity, no container can be discharged, and empty and export containers cannot gate-in, until the stock of containers are reduced.
• A triangle distribution has been assumed as the number of containers to be discharged from each ship.
• The vessel load capacity, which is the number of containers that can be loaded, is equal to the number of containers that have been discharged from the vessel.
• Trailers pick up containers instantaneously, no delays occur caused from communications or trailers repositioning have been assumed.
• The initial stock values are nil at time zero. • Time are in unit of days.
Any of the stated assumptions can be relaxed, it is up to the user to determine the marginal benefits of the increased complexity that will result. To add robustness to the model, the user can alter the gaming variables affecting the flows.
The complete model, including the sub-systems are presented in section 7.3. Definitions of the endogenous and gaming variables and units are defined in Appendix D. Rather than using constants, the variables have been defined as gaming variables to add robustness to the model. In addition, the user will be able to easily update certain constants, like delivery time
or inspection time, and maintain the model’s relevance. The gaming variables provide the user with the ability to generate a wide range of what-if scenarios.
7.3 Container Transport Chain Stock & Flow Model
The stock and flow model represent each sub-system separately and connects them using shadow variables; the variables between parentheses. The container transport chain has been divided into the following sub-systems: Quayside Sub-system, Documentation Processing, Import Container Movement and Export Container Movement. The container acceptance is dependent on the containers occupying the yard, and the yard’s capacity. The available trailers are based on the difference between the national fleet size and occupied trailers. Both container acceptance and trailer availability have been modelled separately, in the Container Terminal Yard and the Trailer Turnaround model, respectively.
7. Simulation Model
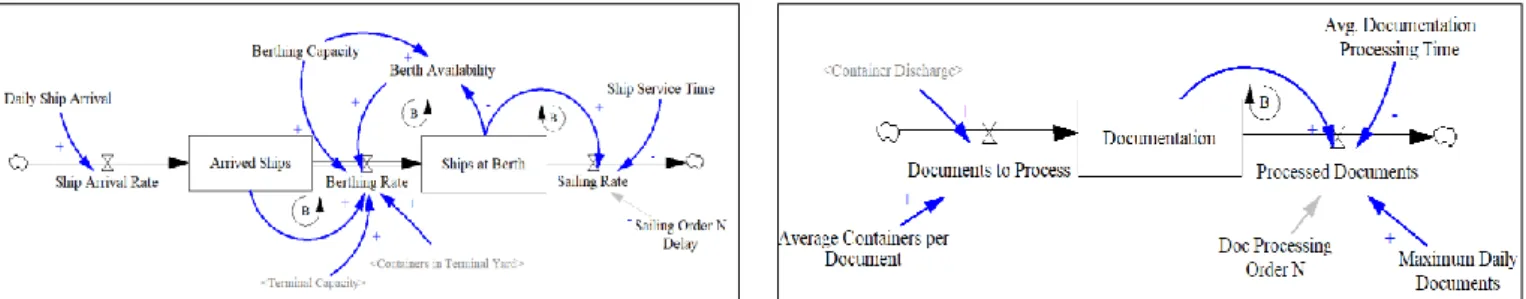
Figure 4. Quayside Sub-System Figure 5. Documentation Sub-System
Figure 6. Inland Container Transport Chain
Figure 7. Export Booking Sub-System
7.3.1 Quayside Sub-System
Figure 4. presents the quayside sub-system. The daily ship arrival is the number of ships that are expected to arrive on daily basis. Arrived ships are the ships arrived at Aqaba and have yet to berth and discharge/ load containers. The berthing rate is based on the berthing capacity and the availability of space in the container terminal yard to store containers, which is determined based on Figure 8. The berthed ship sails, and berth becomes free to accommodate next vessel.
7.3.2 Documentation Sub-System
The average documentation processing time accounts for the time it takes to have the delivery order issued and have it in Aqaba for custom clearance and time to complete custom clearance. The documentation sub-system is illustrated in Figure 5. Since the main driver is number of documents, and the numbers of containers per document may differ, the average containers per variable has been identified as a gaming variable. The maximum daily documents processed is based on customs daily capacity. Due to the multiple steps in the documentation processing a third-order delay has been assumed, as mentioned in section 7.2.
7.3.3 Inland Container Transport Chain – Based on Current Infrastructure
Figure 6 portrays the inland container transport chain, based on the current infrastructure. The import container discharge rate is based on the ship berth rate, based on the quayside sub-system, and the number of containers per vessel. Containers are discharged in the terminal yard (given there is sufficient capacity).
The documentation process begins once containers are discharged and based on the documentation sub-system. The “processed documents” determine the change in container status to “ready for pick-up”, and based on the trailers availability, containers are picked up. Picked up containers are either routed to the inspection yard (30% of the time, as per inspection rate) or become in-transit. Additional delays occur in the inspection yard, the first is from the
7. Simulation Model
transport of the container to the inspection yard, waiting to get inspected. The second is based on time to inspect. Containers in transit reach destination, the “delivery” delay depends on time to reach destination and the have the container unloaded.
Based on the level of desired empty containers stock to hold in depots, some containers are dropped off in a depot, and others are routed back to the terminals. When trailers drop an empty container at a depot, the trailer becomes “available” and can proceed to pick up another container.
In Figure 7 empty containers are booked for export and will need to be picked up by a trailer, given a trailer is available. If no trailer is available, containers will wait until one becomes available. Both empty containers and export containers must go through the “staging yard” prior to gating into the terminal. The staging yard are being containers queue prior to gating in, in-case the terminal hits capacity, then trailers will wait for a longer time before being gated-into the terminal yard. The staging yard stock is a measure of the backlog and indicates that the terminal yard is reaching capacity. Ideally the staging yard stock should be constant at zero, as trailers waiting should be out in less than a day.
The yellow stock boxes represent the stock of containers in the Terminal Yard, as illustrated in Figure 8. The container acceptance variable is determined by the difference between the stock of containers in the yard and the terminal capacity. The green stock boxes represent the number of Booked Trailers as depicted Figure 9. The available trailers are determined by the difference between the national fleet size and number of booked trailers.
7.3.4 Export Bookings Sub-System
A normal distribution has been assumed for export bookings. The distribution can be updated based on data distribution. As Figure 7 illustrates, export booking can only be fulfilled if there is an available empty container at the depot and will only be transported to the container terminal when a trailer is available. The pre-carriage time is the time it takes to pick up an
empty container, transport it to shipper’s facility, have it loaded and transported to the staging yard (the area where trailers queue before being admitted into the yard).
7.4 Output – Base Case – Only One Ship – 30 Days
The model can be simulated over a wide range of scenarios and time frames. A thirty-day period with one ship has been chosen to present the impact of variable changes on the whole transport chain in a controlled environment. The reason for choosing a thirty-day period and one ship to discharge was to clearly show the container turnaround cycle. The base scenario variables are identified in Appendix E.1. The simulations were run using a Lenovo T440p laptop with Intel Core i7-47M4710MQ CPU @ 2.50GHz, ram of 8.00GB, and Windows 64-bit OS. Simulation outputs took seconds to run.
Under the base case, containers are fully discharged by day one from vessel arrival. Documentation starts immediately after discharge, and containers statuses are converted to “ready for pick-up”, refer to Figure E.3.1. The processed documentation peaks at day eight converting 200 container to “ready for pick-up” that day. It takes an average of ten days to deliver containers to the destination, and thirteen days to have containers transported back to for exporting. Moreover, the container turnaround was around 19 days, the number of days it takes to have discharged containers out and back to the terminal, as per depicted in Figure E.3.2 and Figure E.3.3 presents the maximum number of trailers booked in one day was 685, meaning there was sufficient trailer capacity in the system to accommodate for greater volume.
8. Assessing Alternative Plans
8. Assessing Alternative Plans
Literature review has provided the basis for the alternative strategies that can be made to reduce delivery time and the container cycle time. Three different set of alternative plans have been simulated to showcase the framework’s effective in assessing the impact of each alternative on container turnaround.
The three alternatives have been compared against the Base Alternative over a thirty-days period, with only one ship arrival. Under the one-ship scenario export containers were left at the terminal and not exported. To maintain consistency, no stochasticity was assumed in container discharge or export bookings. The alternatives were also run against multiple constraints in capacities, terminal yard capacity, national fleet capacity and documentation processing capacity. The capacity constraint scenarios present how well, or worse, an alternative does in comparison to others in extreme conditions.
8.1 Alternative 1: The Hinterland Move
Under alternative one, a dry port is built in the hinterlands, and containers can be immediately transported there after being discharged from the ships, given the availability of trailers. Figure D.1 presents an extension to the current model to include a binary “open dry port” variable. The dry port binary variable is equal to one, import containers are directly delivered to the hinterland using trucks. Documentation processing and customs inspection will be performed at the hinterland (indicated red dotted box). After getting delivery order and customs approval document at the hinterland, the trucker can pick up the container at the same area. The blue boxes present the accumulation of containers in the dry port, yellow are the accumulation in the container terminal yard and the green boxes present the accumulation of containers loaded on trailers (or the number of trailers occupied). All other variables, including documentation processing are assumed to be constant. The dry port investment is similar to a strategy expected to be implemented in Jordan as presented in Section 3.2.
8.2 Alternative 2: Technology Implementation - Reducing Documentation
Time
The second alternative tests the impact of implementing technology to streamline the documentation process to have discharged containers ready for pick up sooner. The dry port binary variable was assumed zero, i.e. no dry port. Only the time and capacity to process documents have been altered.
8.3 Alternative 3: Hinterland Move & Technology Implementation
Alternative three has been defined as a combination of the implementation of a dry port and technology to reduce documentation processing time.
8.4 Alternatives Output Under Base Scenario
The list of alternatives were compared based on the container turnaround time, the trucking utilization and delivery time, as Figure 10, Figure 11, and Figure 12 portray, respectively.
8. Assessing Alternative Plans
Figure 11. Booked Trailers for Different Alternatives Under Base Scenario
Figure 12. Containers Deliveries for Different Alternatives Under Base Scenario
Though the dry port alternative reduces the container dwell time, it does not outperform the base alternative in delivery time. As Figure 10 portrays Alt.1 gets containers out of the terminal faster compared to Alt.2 but returns containers later. An insight drawn from the alternatives analysis suggests an investment in the hinterlands may reduce the dwell time in the container terminal, but results in similar delivery time, if no improvement is done in the documentation process. Alt.1 and Alt.3 result in a greater number of trailers booked during the period, as containers are first transported to the dry port, and again to the final destination. The gaming variables for each alternative are listed in Appendix E.1.
8.5 Scenario Analysis
The three alternatives were run against different capacity constraints; terminal capacity, fleet size and maximum daily documents that can be processed. Scenario one, Figure 13, limited the container terminal capacity, while scenario two, Figure 14, limited the fleet size, and scenario three, Figure 15, limited the number of daily documents processed. More details about the scenario variables are presented in Appendix E.2. The alternatives were compared against the identified KPIs: Container turnaround (the number of days for a container to leave and return to the terminal), trailers occupancy (the number of trailers/ trips required to complete a container turnaround), and delivery time (number of days to deliver a container). Moreover, due to the limited terminal capacity in scenario one, the alternatives without a dry port rejected some containers to be discharged from the ship. Hence a fourth KPI was introduced for scenario one: container acceptance (the number of containers accepted for discharging). Refer to section E.3.3 for more details on the rankings. Table 3 presents a summary of the rankings for each alternative under the four scenarios.
8. Assessing Alternative Plans
Figure 14. Alternatives Output Under Scenario 2
Figure 15. Alternatives Output Under Scenario 3
Table 3. Alternatives Ranking Under Each Scenario
Scenario Base Alt.1 Alt.2 Alt.3
Base Scenario 1 2 3 4
Scenario One 1 2 3 4
Scenario Two 1 2 4 3
Scenario Three 1 2 3 4
Overall Ranking 1 2 3 4
The alternatives with dry ports reduced the dwell time to a maximum of four days, with most containers being delivered between one and two days. However, the delivery time was only reduced when technology was used to reduce the documentation processing time. The technology alternative (Alt.2) outperforms the “hinterland move” alternative (Alt.1) in delivery time. In times of capacity constraints Alt.1 outperforms Alt.2, as it can accommodate more
containers with the container terminal reaches capacity. Alt.3 which is a combination of the hinterland move and technology improvement received the highest ranking and adds a greater resilience to the system. Refer to Appendix E.3.2 for additional output graphical depictions.
8.6 Simulation Under a One-Year Period
To find the long-term impact of investing in technology and moving to the hinterlands (alternative three) compared to the status quo, the model is simulated again for a period of one year. Refer to Appendix E.3.4 for the input details. Interestingly, the third alternative outperforms the status quo (current) for only a period of 275 days. Beyond day 275 the container acceptance rate in the terminal drops, due to the backlog in the terminal that results from a shortage in trucking.
8. Assessing Alternative Plans
8.7 Discussion of Results
The SD framework provides insights into the impact of alternatives under a set of scenarios on the whole container transport chain. The balancing feedback loops are evident when improvements in one sub-system do not improve the efficiency of the entire system. Investing in the hinterlands resulted in a lower dwell time of import containers at the terminal, but not a faster delivery time. Reducing the documentation processing time, through technology investments resulted in faster dwell time and delivery time. However, when the terminal yard capacity is an issue, having faster documentation processing time alone does not solve the capacity issue at the terminal. Leveraging both the hinterlands and technology provides the container terminal with a greater capacity and achieves lower delivery time but will require more trucking trips. As trucking trips increase, if fleet size isn’t adjusted, fleet utilization increases, and will eventually result in backlog of containers at the terminal.
Under the assumption that the same pool of trucks is used to transport containers from the terminal to the dry port and then to destination, fleet utilization increases significantly. As depicted in Figure 16 if fleet capacity doesn’t increase with the hinterland move, trailers become a constraint in the system. Thus, limiting the number of containers that can be moved out of the terminal, leading to an increase in yard utilization. The yard utilization continues increasing until capacity is reached on day 275, and the container terminal cannot accept any additional containers. The trailers loaded with containers will not be able to return containers back, and thus cannot pick up imports. In addition, ships cannot load export containers as the terminal cannot accept the discharge of imports. Refer to Figure 17 for graphical output of the containers stock in the terminal yard. Alt.3 does not outperform the Current alternative when fleet size is not considered when a hinterland move is implemented.
The alternative comparisons under different scenarios and time frames showcase the complexities that exist in the container transport chain. In addition, the output results further
emphasize the need to take a holistic approach when assessing the impact of different alternatives on the container transport chain.