HAL Id: hal-02428137
https://hal.archives-ouvertes.fr/hal-02428137
Submitted on 5 Jan 2020
HAL is a multi-disciplinary open access
archive for the deposit and dissemination of
sci-entific research documents, whether they are
pub-lished or not. The documents may come from
teaching and research institutions in France or
abroad, or from public or private research centers.
L’archive ouverte pluridisciplinaire HAL, est
destinée au dépôt et à la diffusion de documents
scientifiques de niveau recherche, publiés ou non,
émanant des établissements d’enseignement et de
recherche français ou étrangers, des laboratoires
publics ou privés.
Analysis of Signal-Averaged Electrocardiogram
Performance for Body Surface Recordings
Nolwenn Tan, Laura Bear, Mark Potse, Stéphane Puyo, Marianna Meo, Rémi
Dubois
To cite this version:
Nolwenn Tan, Laura Bear, Mark Potse, Stéphane Puyo, Marianna Meo, et al.. Analysis of
Signal-Averaged Electrocardiogram Performance for Body Surface Recordings. CinC 2019 - Computing in
Cardiology 2019, Sep 2019, Singapour, Singapore. �hal-02428137�
Analysis of Signal-Averaged Electrocardiogram Performance for Body Surface
Recordings
Nolwenn Tan
1, Laura Bear
1, Mark Potse
1,2,3, Stéphane Puyo
1, Marianna Meo
1, Rémi Dubois
11
Institute of Electrophysiology and Heart Modeling (IHU Liryc), Foundation Bordeaux University,
Pessac-Bordeaux, France
2
CARMEN Research Team, Inria Bordeaux Sud-Ouest, Talence, France
3
Univ. Bordeaux, IMB, UMR 5251, Talence, France
Abstract
To test the performance of signal averaging on body surface electrocardiograms (SAECG), a comparative analysis of four sources of perturbation, 1) uncorrelated noise, 2) beat alignment, 3) physiological variability and 4) respiratory movement was performed. The first two cases were assessed using a computer model of a ventricular beat. The other two cases were tested using high resolution body surface signals recorded from a torso tank (N= 2) and patient data (N= 4) respectively. In the first case, SAECG successfully removed a high level of noise made up of white Gaussian noise (WGN) with σ = 10 µV and 50 Hz noise with a signal to noise ratio (SNR) of 9 dB since the root mean square error of the noise (RMSEnoise)
was 0.65 ± 0.01 µV and 1.30 ± 0.01 µV, respectively. The RMSE of the averaged QRS ����� was slightly changed by physiological variability (����� =
. ± . µ� when comparing the SAQRS resulting
from the average of 100 different beats taken from the same recording. While SAQRS are distorted by respiration
artefacts, the beats selected during the exhalation phase produced the least distortion to the SAQRS with a
����� = 16.28 ± 12.58 µV.
To conclude, SAECG can efficiently de-noise signals in presence of uncorrelated noise without distorting the SAQRS. However, respiration motion introduces amplitude
shift between SAQRS.
1.
Introduction
Signal averaging of an ECG (SAECG) is a non-invasive technique to reduce noise or increase the signal to noise ratio (SNR) without the distorting effects of filtering on the QRS [1]. This technique is mostly used in the detection of
low amplitude signals called “late potentials” [2], [3], [4],
markers for sustained ventricular arrhythmias embedded in
the QRS but usually hidden by skeletal muscle activity and by external noise localized at the end of the QRS. The SAECG is also used to evaluate the risk for atrial fibrillation focusing on prolonged P wave [5] and for non-invasive electrocardiographic imaging [6].
Another potential application is the detection of His bundle activation from body surface signals [7]. However the very small potential associated to the His bundle activity combined with residual noise make this detection very challenging.
A high efficiency of SAECG to de-noise electrocardiograms (ECG) is imperative to identify low amplitude variations of ECG in part responsible for some arrhythmias. In this study, we aim to report the performance of SAECG in terms of noise reduction and SAQRS modification testing various sources of signal
perturbation, with the goal of setting an optimal workflow for future studies.
2.
Materials and methods
2.1.
Datasets
Three datasets were used to accomplish this study. (i) A computer model (N=1) from a torso model with 252 body surface recordings at 1000Hz [8] composed of a ventricular beat duplicated into multiple beats equally spaced (RR interval = 909 ms (66 bpm)) or randomly spaced (RR interval =800 +/- 59 ms (75 bpm)). (ii) 5-minutes of experimental data (N=2, sinus rhythm and left ventricular pacing) obtained from a torso tank with 256 surface signals recorded at 2048 Hz simultaneously with 108 epicardial signals from a pig heart suspended inside and (iii) clinical data (N=4) composed of 128 body surface signals and breathing signal recorded simultaneously from a respiratory belt at 2048 Hz were used.
2.2.
Comparisons methods
The efficacy of SAECG was assessed using 3 metrics:
1- the RMSE of noise (RM�E ise) based on the average of the squared differences between a signal without noise (RM�E ise= 0) and the noise measured over an interval of 50 ms during the ST segment;
2- the RMSE of the SAQRS(RM�E A ) that measures
the root mean square error between the “SAQRS gold
standard” and the SAQRS obtained after SAECG. The
“SAQRS gold standard” chosen is detailed for each case in
Section 2.3;
3- the correlation coefficient of the SAQRS
(CorrCoeff A ) calculated between the “SAQRS gold
standard” and the SAQRS obtained after SAECG.
The results presented for these 3 metrics were computed from beat averaging for all the recorded leads. The mean of all the averaged leads was computed (252 channels for the computing model, 256 channels, for the experimental data, and 128 channels for the clinical data) and then the mean over the N sets of data available was computed. For the experimental data N=2, for the clinical data N=4 and for the computer model N=15 as 15 random choices of 200 consecutives beats were used to compute the mean. Variables were reported as mean±SD.
2.3.
Methods
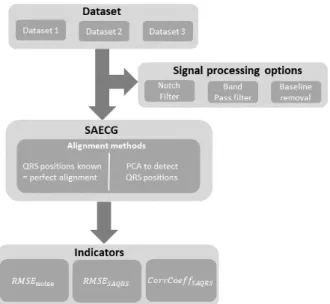
The first step of SAECG was the creation of a virtual lead and a virtual template used for beat detection and alignment using a principal component analysis (PCA) [9]. PCA is a dimension-reduction technique used to reduce a large set of correlated variables to a smaller set of linearly uncorrelated variables called principal components. The first principal component contains the largest variance and was used in this study. The virtual template is compared with each beat of the virtual lead, by cross correlation. The positions for the alignment were determined as the position where the cross correlation was maximal. Finally beat averaging was performed over all recorded and aligned beats for each lead. Each case was processed using SAECG with or without signal processing tools (notch filter, band pass filter (BPF), baseline removal) to finally compute the three metrics presented in Section 2.2 (Figure 1). Signal processing algorithms were developed using Matlab (2015Rb).
Four sources of perturbation were analyzed to study the performance of SAECG.
Case 1: additive noise
To study the efficiency of SAECG to remove noise, a WGN (σ =10 µV) was added to the simulated data (RR interval constant) and independently a 50 Hz noise with a SNR of 9 dB was added (RR interval non constant). For the latter, the use and performance of a notch filter was
analyzed. The alignment was perfect as the known positions of each ventricular beat was used for averaging. The RM�E A and the CorrCoeff A were computed between the SAQRS (gold standard) without any noise.
Figure 1: Workflow to test the SAECG performance. For
each dataset signal processing methods can be applied independently, combined with each other or not used. Then SAECG is performed for each dataset using perfect alignment for case 1 and case 3 while QRS detection and alignment are determined with PCA method for case 2 and case 4. Finally, the three indicators can be computed.
Case 2: alignment perturbation
To study the effect of a bad alignment on the SAQRS, a 50
Hz noise with a SNR of 9 dB, a WGN (σ =30 µV) and baseline noise (created by fitting a spline to a patient dataset) were added to the simulated data (RR interval non constant). The use and performance of a notch filter and a BPF at 0.01Hz to 30 Hz were compared. The RM�E A and the CorrCoeff A were computed between the SAQRS obtained from dataset 1 after adding the different
noises exposed previously 1) based on the average of perfectly aligned beats (SAQRS gold standard) and 2) the
SAQRS based on PCA to set the positions of the beats
(SAQRS observed).
Case 3: physiologic variability
To study the impact of physiological variability on the SAQRS using the experimental data, electrograms from the
sock, because of the sharper QRS complex recorded, were used to set the QRS positions and to avoid any misalignment. To eliminate noise a notch filter with a band frequency of 1 Hz and baseline removal were applied. SAQRS from five subsequences (100 beats each) of
recording from dataset 2 were compared with each other (10 comparisons in total) to evaluate the variability of the SAQRS as explained in Figure 2.
Figure 2: Workflow to compute the RMSESAQRS for the
physiological variability and the respiration motion study (for the latter case only three comparisons were
performed).
Case 4: respiratory artefacts
To study the impact of respiration on the SAQRS using the
clinical data, three scenarios were compared: 1) only the beats in the exhalation respiratory phase were averaged, 2) only the beats during the inhalation respiratory phase were averaged, and 3) all the beats were averaged independently of the respiration. Baseline removal was used as a processing step. Three SAQRS made from the average of
100 beats each along the same recording were compared with each other (3 comparisons in total) to evaluate the variability of the SAQRS.
3.
Results
Case 1: additive noise
Adding a WGN with σ =10 µV to the recording shows that after SAECG, RM�E ise decreases as expected in σ
√N e since RM�E ise=0.65+0.01 µV with Nbeats (number of
averaged beats) = .In the presence of a 50 Hz noise (SNR = 9 dB) the use of a notch filter with a band frequency (BF) of 1 Hz reduced highly the noise in the signal (RM�Enoise=1.30±0.01 µV with notch filter vs 2.40±1.70 µV without notch filter), with a minimal distortion of the SAQRS in terms of amplitude though the
difference without notch filter was around half the RMSESAQRS value while using a notch filter
(RM�E�AQR� =1.43±0.00 µV with notch filter vs 2.30±1.67 µV without notch filter).
Our results also demonstrated that it is better to use a notch filter when the SNR of a 50 Hz noise is lower than 19 dB. However with higher SNR, the use of a notch filter is not necessary. Moreover these results are valid for 200 averaged beats. To conclude, 50 Hz and WGN noises can
easily be removed by SAECG.
Case 2: alignment perturbation
Using a BPF was better than a notch filter to reduce noise (RM�Enoise = 1.41±0.01 µV vs 3.08±0.5 µV). While the
Coeff_corr�AQR� in both cases was equal to 1, the BPF led to a smaller RM�E�AQR� than the notch filter
RM�EA = 0.51±0.20 µV vs RM�E A = 2.15±1.00 µV). As the levels of noise in case 1 (beat
alignment is perfect) and case 2 are about the same range, we can conclude that a bad detection of alignment does not affect the SAQRS in terms of distortion.
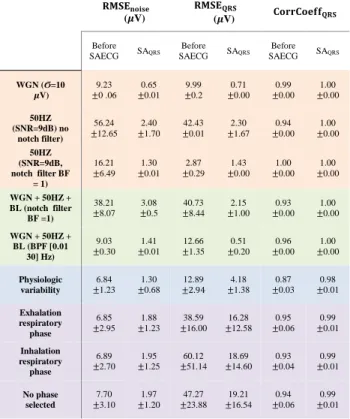
Table 1: Table summary of the results
BF = Band Frequency BPF = Band Pass filter WGN = White Gaussian Noise BL = Baseline SNR = Signal to Noise Ratio
Case 3: physiological variability
Physiological variability has no effect on the SAQRS
correlation coefficient (CorrCoeff A = 0.98±0.01) and a minimal impact on the RM�EA RM�E A = 4.18±1.38 mV) while averaging 100 beats.
Case 4: respiratory artefacts
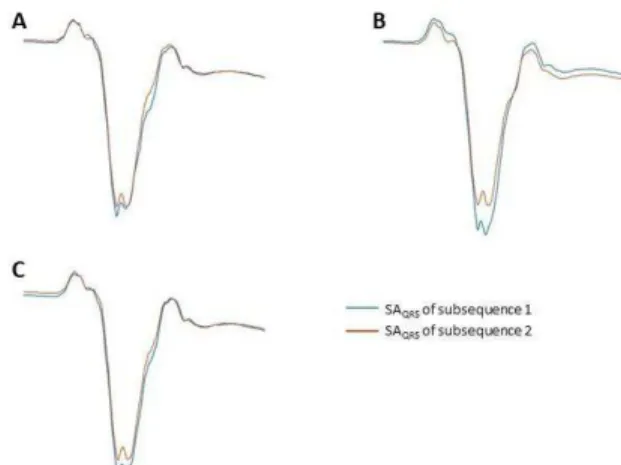
SAECG in different phases of respiration demonstrated that selecting the beats during the exhalation phase produced the least change in the QRS waveforms amplitude (Figure 3A) when compared to the inhalation phase (B) or without any preliminary selection of the beats
��������� (�V) ������� (�V) ������������ Before SAECG SAQRS Before SAECG SAQRS Before SAECG SAQRS WGN (Ϭ=10 �V) ±0 .06 9.23 ±0.01 0.65 ±0.2 9.99 ±0.00 0.71 ±0.00 0.99 ±0.00 1.00 50HZ (SNR=9dB) no notch filter) 56.24 ±12.65 ±1.70 2.40 ±0.01 42.43 ±1.67 2.30 ±0.00 0.94 ±0.00 1.00 50HZ (SNR=9dB, notch filter BF = 1) 16.21 ±6.49 ±0.01 1.30 ±0.29 2.87 ±0.00 1.43 ±0.00 1.00 ±0.00 1.00 WGN + 50HZ + BL (notch filter BF =1) 38.21 ±8.07 ±0.5 3.08 ±8.44 40.73 ±1.00 2.15 ±0.00 0.93 ±0.00 1.00 WGN + 50HZ + BL (BPF [0.01 30] Hz) 9.03 ±0.30 ±0.01 1.41 ±1.35 12.66 ±0.20 0.51 ±0.00 0.96 ±0.00 1.00 Physiologic variability 6.84 ±1.23 ±0.68 1.30 ± . 12.89 ±1.38 4.18 ±0.03 0.87 ±0.01 0.98 Exhalation respiratory phase 6.85 ±2.95 1.88 ±1.23 38.59 ±16.00 16.28 ±12.58 0.95 ±0.06 0.99 ±0.01 Inhalation respiratory phase 6.89 ±2.70 ±1.25 1.95 ±51.14 60.12 ±14.60 18.69 ±0.04 0.93 ±0.01 0.99 No phase selected 7.70 ±3.10 ±1.20 1.97 ±23.88 47.27 ±16.54 19.21 ±0.06 0.94 ±0.01 0.99
(C). This is quantified by an RMSESAQRS of 16.28±12.58
µV compared to RM�E�AQR�= 18.69± 4.60 µV and
RM�E�AQR�= 19.21±16.54 µV respectively. However, the
correlation coefficient (CorrCoeff A = 0.99±0.1) was similar for the three scenarios indicating there is minimal deformation of the QRS waveform.
Figure 3: Comparison between two SAQRS from two
subsequences (100 beats averaged) within the same recording from dataset 3.
A. SAQRS selected during the exhalation respiratory
phase.
B. SAQRS selected during the inhalation respiratory
phase.
C. SAQRS with no preliminary selection of the beats.
4.
Discussion
The presented results demonstrate that SAECG is a performant technique to remove uncorrelated noise and to reveal the true underlying QRS complex. These results are consistent with previous studies showing the efficiency of SAECG, especially to detect small electrical components as the late potentials.
While the present study has supplied much useful information about the efficiency of SAECG, it has several limitations that must be acknowledged. Firstly, the results of this study could be more accurate using larger and longer experimental and clinical datasets. Finally, the correlation coefficient of the SAQRS was computed on the
entire SAQRS complex leading to correlation coefficient
superior to 0.9 in most cases. However, when using SAECG to detect late potentials for instance a very small distortion of the QRS can affect their detection but will not deteriorate the correlation coefficient much. Therefore, the results of this study would have to be interpreted according to each specific application.
5.
Conclusion
SAECG is a powerful signal processing technique to
de-noise the ECG without distorting the signals.
50 Hz noise, WGN and baseline artefacts while using SAECG (coupling to certain filtering process in some cases) do not disturb the alignment, are easily removed and SAQRS distortion is minimal. Physiological variability has
a weak impact on the SAQRS distortion with SAQRS using
different beats within the same recording showing only very small deformations. On the other hand, the respiratory motion can deteriorate the SAQRS, but by selecting the beats
during the exhalation phase can reduce the amplitude shift effects of the SAQRS.
Acknowledgments
This work was supported by the French National Research Agency, grant reference ANR-10-IAHU04-LIRYC. This work was granted access to HPC resources of CINES under GENCI allocation 2019-A0050307379.
References
[1] L. Sörnmo, E. Trägårdh, and M. B. Simson, “The
Signal-Averaged Electrocardiogram,” 2010, pp. 1793–1821.
[2] M. SIMSON, “Use of Signals in the Terminal Qrs Complex To
Identify Patients With Ventricular-Tachycardia After Myocardial-Infarction,” Circulation, vol. 64, no. 2, pp. 235– 242, 1981.
[3] P. Lander, E. J. Berbari, C. V Rajagopalan, P. Vatterott, and R.
Lazzara, “Critical analysis of the signal-averaged
electrocardiogram. Improved identification of late potentials.,”
Circulation, vol. 87, no. 1, pp. 105–117, Jan. 1993.
[4] J. A. GOMES et al., “A Comparative Analysis of Signal Averaging of the Surface QRS Complex and Signal Averaging of Intracardiac and Epicardial Recordings in Patients with
Ventricular Tachycardia,” Pacing Clin. Electrophysiol., vol.
11, no. 3, pp. 271–282, 1988.
[5] J. S. Steinberg, S. Zelenkofske, S. C. Wong, M. Gelernt, R. Sciacca, and E. Menchavez, “Value of the P-wave signal-averaged ECG for predicting atrial fibrillation after cardiac
surgery.,” Circulation, vol. 88, no. 6, pp. 2618–2622, Dec.
1993.
[6] L. R. Bear, P. R. Huntjens, R. D. Walton, O. Bernus, R.
Coronel, and R. Dubois, “Cardiac electrical dyssynchrony is
accurately detected by noninvasive electrocardiographic
imaging,” Hear. Rhythm, vol. 15, no. 7, pp. 1058–1069, Jul.
2018.
[7] N. C. FLOWERS, L. G. HORAN, and W. YANG, “Application
of Beat-to-Beat Techniques,” Pacing Clin. Electrophysiol., vol. 13, no. 12, pp. 2148–2155, Dec. 1990.
[8] M. Potse, “Scalable and Accurate ECG Simulation for
Reaction-Diffusion Models of the Human Heart,” Front. Physiol., vol. 9, p. 370, Apr. 2018.
[9] F. Castells, P. Laguna, L. Sörnmo, A. Bollmann, and J. M.
Roig, “Principal Component Analysis in ECG Signal Processing,” EURASIP J. Adv. Signal Process., vol. 2007, no.
1, p. 074580, Dec. 2007.
Address for correspondence: Nolwenn TAN
IHU LIRYC
Avenue du Haut-Lévêque, 33604 Pessac, France