Constitutive Equations for Superelasticity in
Crystalline Shape-Memory Materials
MASSACHUSETTS rSITUTEby
__OF
TECHNOLOGYbyOCT
2
520
Prakash Thamburaj a
B.Eng. Mechanical Engineering
LIBRARIES
Imperial College of Science, Technology and Medicine, 1996
BARKER
S.M. Mechanical Engineering
Massachusetts Institute of Technology, 2000
Submitted to the Department of Mechanical Engineering
in partial fulfillment of the requirements for the degree of
Doctor of Philosophy
at the
MASSACHUSETTS INSTITUTE OF TECHNOLOGY
September 2002
©
Prakash Thamburaja, MMII. All rights reserved.
The author hereby grants to MIT permission to reproduce and
distribute publicly paper and electronic copies of this thesis document
in whole or in part.
Author ...
Department of Mechanical Engineering
August 9, 2002
Certified by...
...
Lallit Anand
Professor of Mechanical Engineering
Thesis Supervisor
a
Accepted by...
...
Ain A. Sonin
Chairman, Department Committee on Graduate Students
Constitutive Equations for Superelasticity in Crystalline
Shape-Memory Materials
by
Prakash Thamburaja
Submitted to the Department of Mechanical Engineering on August 9, 2002, in partial fulfillment of the
requirements for the degree of Doctor of Philosophy
Abstract
A crystal-mechanics-based constitutive model for polycrystalline shape-memory
ma-terials has been developed. The model has been implemented in a finite-element program. Finite-element calculations of polycrystal response were performed using two methods: (1) The full-finite element method where each element represents a single crystal chosen from a set of crystal orientations which approximate the initial crystallographic texture; (2) A simplified model using the Taylor assumption (1938) where each element represents a collection of single crystals at a material point. The macroscopic stress-strain responses are calculated as volume averages over the entire aggregate.
A variety of superelastic experiments were performed on initially-textured Ti-Ni
rods and sheets. The predicted stress-strain curves from finite-element calculations are shown to be in good accord with the corresponding experiments.
For the Ti-Ni sheet, strain-temperature response at a fixed stress was also ex-perimentally studied. The model was also shown to accurately predict the results from these important experiments. Further, by performing superelastic experiments at moderately high strain rates, the effects of self-heating and cooling due to the phase transformations are shown to be captured well by the constitutive model. The thermo-mechanically-coupled theory is also able to capture the resulting inhomoge-neous deformations associated with the nucleation and propagation of transformation fronts.
Finally, an isotropic constitutive model has also been developed and implemented in a finite-element program. This simple model provides a reasonably accurate and computationally-inexpensive tool for purposes of engineering design.
Thesis Supervisor: Lallit Anand
Acknowledgments
First and foremost, I would like to thank my advisor Prof. Lallit Anand for his support. His high academic standards and great vision will always be a source of inspiration to me. I would also like to thank Prof. Mary Boyce, Prof. David Parks and Prof. William Carter for serving on my committee.
We are also thankful to Gao Shan and Prof. Yi Sung of the Nanyang Technological University, Singapore for supplying us with the raw material and the experimental results for their Ti-Ni sheet.
To the Mechanics and Materials group - Nicoli Ames, Jeremy Levitan, Matt Busche, Jin Yi, Cheng Su, Theodora Tzianetopoulou, Hang Qi, Rajdeep Sharma, Mats Danielsson, Ethan Parsons, Franco Capaldi and others, thank you very much for all the great conversations and good times we have had. I wish all of you the best of luck in your future endeavors.
To Ray Hardin and Leslie Regan, thank you very much for taking care of all the administrative details and providing me with your unerring advice.
To Brian P. Gearing, my colleague and most of all friend for the last six years, thank you very much for all that you have done for me. May success shine on you constantly.
To my family, Drs. Thamburaja and Surabi, Sree Priya and Jeyalakshmi, your constant love, affection and support have been very instrumental throughout my life journey thus far. Thank you very much for everything.
The financial support for this work was provided by the National Science Foun-dation under Grant CMS0002930.
Contents
1 Introduction 16
2 Crystal-mechanics-based constitutive model 29
2.1 Single-crystal constitutive equations . . . . 29
2.2 Evaluation of the constitutive model for a polycrystalline Ti-Ni alloy : R od-texture . . . . 36
2.2.1 Taylor m odel . . . . 45 2.2.2 Effect of temperature on the deformation of polycrystalline Ti-Ni 46
2.3 Evaluation of the constitutive model for a polycrystalline Ti-Ni alloy : Sheet-texture . . . . 48
3 Isotropic-based constitutive model 82
3.1 Constitutive m odel . . . . 82 3.2 Evaluation of the constitutive model for polycrystalline Ti-Ni alloy . . 88 3.2.1 Sheet m aterial . . . . 88 3.2.2 Rod m aterial . . . . 94
3.3 Deformation of a Ti-Ni biomedical stent . . . . 96
4 Conclusion and future work 115
A Time-integration procedure : Crystal-mechanics-based constitutive
model 123
C Algorithm to calculate the austenite-martensite transformation
sys-tems using the crystallographic theory of martensite 135
C.1 Results of the CTM theory . . . . 137
D Example of a fortran code to calculate the austenite-martensite
transformation systems using CTM 146
E Time-integration procedure : Isotropic-based constitutive model 185
F Hypo-elastic form for the isotropic-based constitutive equations 189
F.1 Increm ental form . . . . 194 F.2 Time integration procedure . . . . 197 F.3 Jacobian M atrices . . . . 199
G Simple shear problem in the isotropic-based constitutive model 203
H Anisotropic superelasticity of textured sheet Ti-Ni 206
I Operating procedure for the RigaKu200 & 300 X-ray Diffraction
List of Figures
1-1 (a) Shape-memory alloy-based actuation device (Baron et al., 1994).
(b) Scanning Electron Microscope (SEM) image of a Scimedt"' artery
stent (Serruys, 1997). . . . . 24 1-2 Schematic diagram of the (a) superelastic, and (b) strain-temperature
cycling response. A-M denotes the austenite-to-martensite transforma-tion whereas M-A denotes the martensite-to-austenite transformatransforma-tion. 25 1-3 Experimental stress-strain curves for Ti-Ni rod at 0 = 298 K in simple
tension and simple compression. For compression the absolute values of stress and strain are plotted. . . . . 26
1-4 Experimental stress-strain curves for Ti-Ni sheet at 0 = 300 K in simple
tension along the rolling and transverse direction . . . . 27 1-5 Experimental stress-strain curves for a Ti-Ni sheet at 0 = 300 K in
simple tension at strain rates of 0.00003/sec, 0.00084/sec, and 0.002/sec. 28
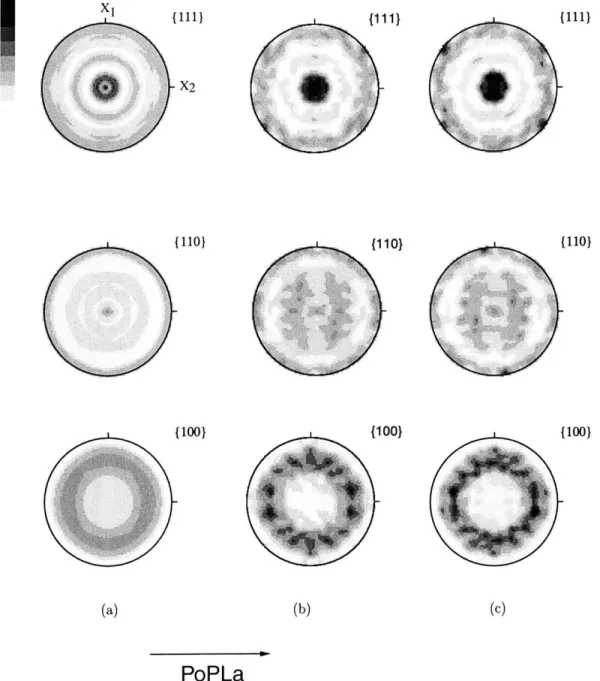
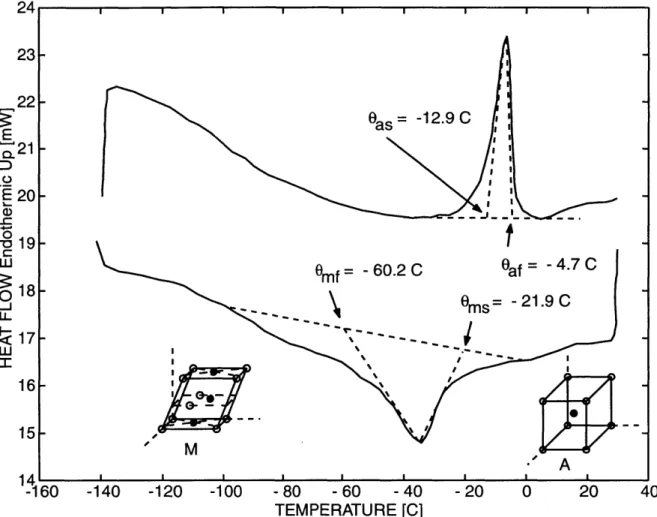
2-1 (a) Experimentally-measured texture in the as-received Ti-Ni rod, (b) its numerical representation using 729 unweighted discrete crystal ori-entations, and (c) its numerical representation using 343 unweighted discrete crystal orientations. Pole-figure data were obtained using PoPLa. 55 2-2 Differential scanning calorimetry thermogram for polycrystalline rod
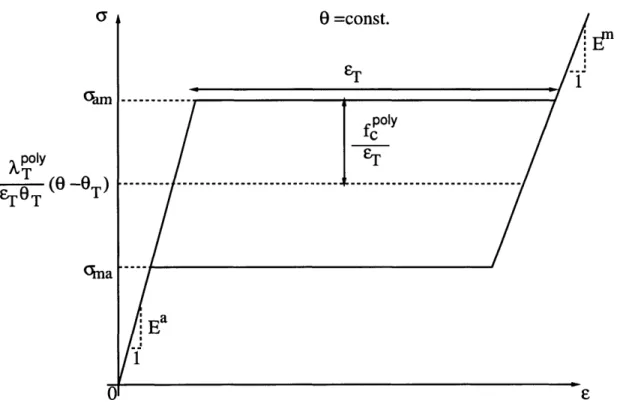
Ti-Ni used in experiments. . . . . 56 2-3 Schematic of an isothermal superelastic stress-strain response in simple
tension . . . . . 57
2-5 (a) Undeformed mesh of 729 ABAQUS C3D8R elements. (b) Deformed mesh at a tensile strain of 6%. Contours of martensite volume frac-tion are shown. (c) Superelastic stress-strain curve in tension. The experimental data from this test was used to estimate the constitutive parameters. The curve fit using the full finite element model of the polycrystal is also shown. . . . . 59 2-6 (a) Undeformed mesh of 729 ABAQUS C3D8R elements. (b) Deformed
mesh at a compressive strain of 5%. Contours of martensite volume fraction are shown. (c) Superelastic stress-strain curve in compression. The absolute values of stress and strain are plotted. The prediction from the full finite-element model for the polycrystal is also shown. . 60 2-7 Comparison of the predicted response from tension and
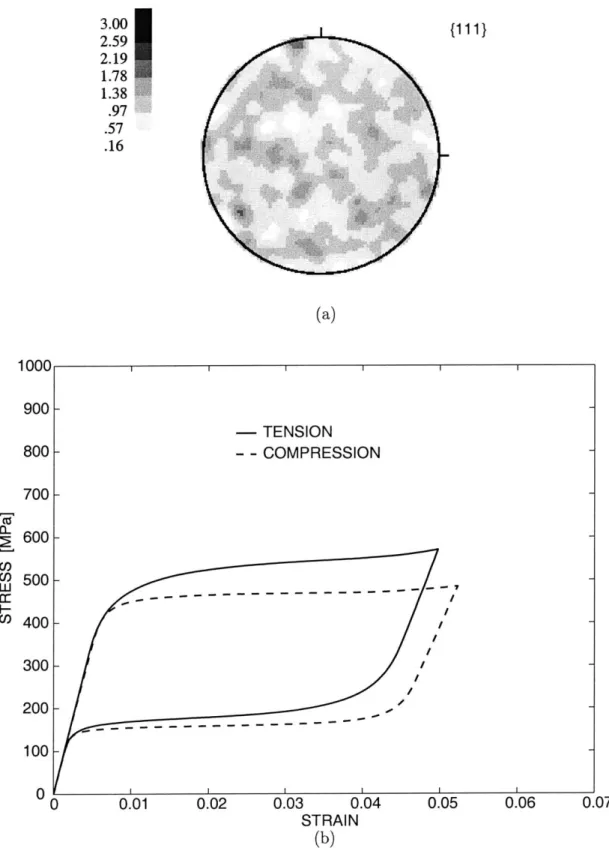
compres-sion simulations to demonstrate the numerically predicted tencompres-sion- tension-compression asymmetry for (a) the polycrystal material and (b) single crystal oriented in the {111} direction. . . . . 61 2-8 (a) {111} pole figure corresponding to a random initial texture. (b)
Comparison of the predicted stress-strain response in tension and com-pression using a random initial texture. . . . . 62 2-9 Specimen geometry for torsion experiments. . . . . 63
2-10 (a) Undeformed mesh of 720 ABAQUS C3D8R elements. (b) Deformed mesh at a shear strain of 9%. Contours of martensite volume fraction are shown. (c) Superelastic stress-strain curve in torsion. The pre-diction from the full finite-element model for the polycrystal is also show n . . . . 64
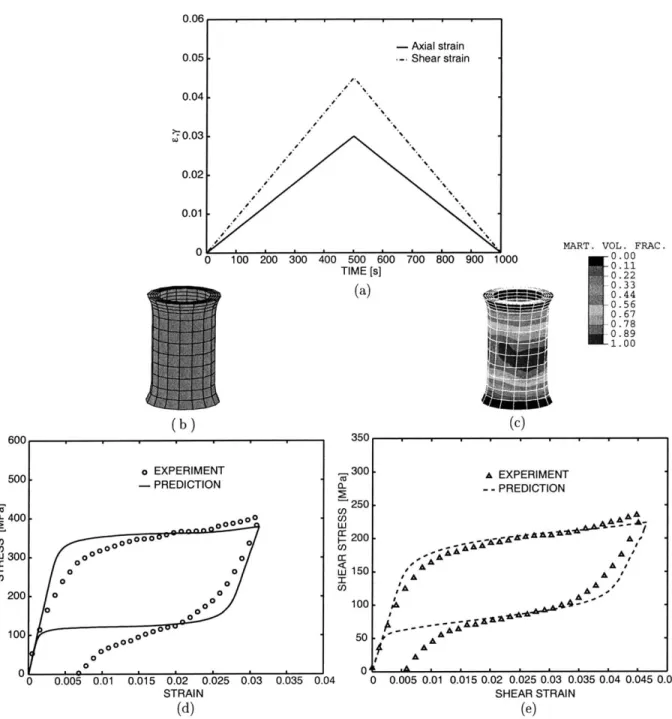
2-11 (a) Loading program for combined tension-torsion experiment. (b)
Undeformed mesh of 768 ABAQUS C3D8R elements. (c) Deformed mesh at a tensile strain of 3% and a shear strain of 4.5%. Contours of martensite volume fraction are shown. (d) Superelastic stress-strain curve in tension. (e) Superelastic stress-strain curve in shear. The prediction from the full finite element model for the polycrystal is also show n . . . . 65
2-12 (a) Loading program for the path change tension-torsion experiment.
(b) Undeformed mesh of 768 ABAQUS C3D8R elements. (c) Deformed
mesh at a tensile strain of 3% and a shear strain of 7%. Contours of martensite volume fraction are shown. (d) Superelastic stress-strain curve in tension. (e) Superelastic stress-strain curve in shear. The prediction from the full finite element model for the polycrystal is also
shown... ... 66 2-13 Comparison of the Taylor model against experiment and full
finite-element calculation in (a) simple tension, (b) simple compression, and (c) shear. . . . . 67
2-14 Response of the Taylor Model compared against the path change tension-torsion experiment and full finite element calculation in (a) tension and (b) shear. . . . . 68 2-15 Superelastic stress-strain curves in tension (Shaw and Kyriakides,
1995) at three temperatures (a) 9 = 333.2 K, (b) 0 = 343.2 K, and (c) 0 = 353.2 K. Full finite-element and Taylor model prediction from
the constitutive model are also shown. The material parameters for the Ti-Ni of Shaw and Kyriakides is obtained from the data at 343.2 K. 69
2-16 Simulation of austenite-martensite-austenite shape memory effect (Shaw
and Kyriakides, 1995): Isothermal stress-strain response for straining at constant strain rate (ABC) at 6 = 303.2 K followed by a temperature (CD) to 0 = 305.8 K. . . . . 70
2-17 (a) Experimentally-measured texture in the as-received Ti-Ni sheet;
and (b) its numerical representation using 48 weighted crystal orienta-tion s. . . . . 7 1 2-18 (a) Geometry of the tensile specimen (drawing is not to scale). (b)
Undeformed finite-element mesh of the tensile specimen using 446
ABAQUS three-dimensional elements. The gage width of the
speci-men is linearly tapered from 3.85 mm to 3.65 mm as shown in (a). . . 72 2-19 Schematic diagram of the variation of resolved forces on an active
trans-formation system i with temperature. . . . . 73
2-20 Nominal superelastic stress-strain curves from tension tests on 0'-oriented specimens. The tests were conducted under isothermal con-ditions at (a) 289 K, (b) 300 K, and (c) 306 K. The experimental data from these tests were used to estimate the phase transformation param-eters. The curve fit from the finite-element simulations is also shown. 74 2-21 A superelastic finite-element simulation of an experiment conducted
under isothermal conditions at 300 K. Contour plots of the marten-site volume fraction are also shown. The set of contours on the left shows the transformation from austenite-to-martensite during forward transformation, while those on the right show the transformation from martensite-to-austenite during reverse transformation. Note that be-cause of the slight taper in the gage width, the austenite-to-martensite transformation nucleates at the right grip-end and propagates toward the opposing grip-end. . . . . 75
2-22 Experimental superelastic stress-strain curves in tension at 300 K: (a)
450 orientation; (b) 90' orientation. The corresponding predictions
from the finite-element simulations are also shown. . . . . 76 2-23 Strain-temperature cycling experiments conducted on 0-oriented
spec-imens at stress levels of (a) 150 MPa; and (b) 250 MPa. The pre-dictions from the finite-element simulations are also shown. . . . . . 77
2-24 Superelastic stress-strain curves in tension along the rolling direction at nominal strain rates of 2 x 10- /sec, 8.4 x 10⁻⁴ /sec, and 3 x 10- /sec
("isothermal condition"). The predictions from the theory are also show n . . . . 78 2-25 A superelastic finite-element simulation of an experiment conducted at
a nominal strain rate of 2 x 10- /sec. The set of the martensite volume fraction contours on the left show the transformation from austenite-to-martensite during forward transformation, while those on the right show the transformation from martensite-to-austenite during reverse transformation. Note that because of the boundary conditions, both the forward and reverse transformations nucleate from the grip-ends and propagate towards the center of the specimen. . . . . 79 2-26 A superelastic finite-element simulation of an experiment conducted at
a nominal strain rate of 2 x 10- /sec. The set of contours on the left shows the temperature increase during transformation from austenite-to-martensite, while those on the right show the temperature decrease during transformation from martensite-to-austenite. During forward transformation the temperature increases by as much as 22'K above the ambient temperature of 300'K due to the exothermic austenite-to-martensite transformation, whereas it decreases by as much as 22'K below the ambient temperature during the reverse endothermic trans-formation from martensite-to-austenite. . . . . 80 2-27 (a) Nominal strain versus time profile for the tension-hold experiment
at a baseline nominal strain rate of 1.25 x 10- /sec and initial tem-perature of 300 K. (b) Superelastic stress-strain curve measured in the experiment. The prediction from the finite-element simulation is also shown. ... ... 81
3-1 Comparison of the implicit and explicit finite-element solution of the tension specimen shown in Figure 2-18b at a tensile strain-rate of 0.002/s at an initial temperature of 0 = 300 K using the material pa-ram eters in Section 3.2.1. . . . . 99 3-2 (a) Schematic of an isothermal superelastic stress-strain response in
simple tension. (b) Schematic diagram of the variation of the nucle-ation stresses -am and -ma with temperature. . . . . 100 3-3 Nominal superelastic stress-strain curves from tension tests on
0'-oriented specimens. The tests were conducted under isothermal con-ditions at (a) 289 K, (b) 300 K, and (c) 306 K. The experimental data from these tests were used to estimate the phase transformation pa-rameters. The curve fit from the finite-element simulations is also shown. 101 3-4 A superelastic finite-element simulation of an experiment conducted
under isothermal conditions at 300 K. Contour plots of the marten-site volume fraction are also shown. The set of contours on the left shows the transformation from austenite-to-martensite during forward transformation, while those on the right show the transformation from martensite-to-austenite during reverse transformation. Note that be-cause of the slight taper in the gage width, the austenite-to-martensite transformation nucleates at the right grip-end and propagates toward the opposing grip-end. . . . . 102
3-5 Strain-temperature cycling experiments conducted on 0W-oriented spec-imens at stress levels of (a) 150 MPa; and (b) 250 MPa. The pre-dictions from the finite-element simulations are also shown. . . . . . 103 3-6 Superelastic stress-strain curves in tension along the rolling direction at
nominal strain rates of 2 x 10⁻³ /sec, 8.4 x 10⁻⁴ /sec, and 3 x 10⁻⁵ /sec ("isothermal condition"). The predictions from the theory are also show n . . . . . 104
3-7 A superelastic finite-element simulation of an experiment conducted at
a nominal strain rate of 2 x 10- /sec. The set of the martensite volume fraction contours on the left show the transformation from austenite-to-martensite during forward transformation, while those on the right show the transformation from martensite-to-austenite during reverse transformation. Note that because of the boundary conditions, both the forward and reverse transformations nucleate from the grip-ends and propagate towards the center of the specimen. . . . . 105 3-8 A superelastic finite-element simulation of an experiment conducted at
a nominal strain rate of 2 x 10⁻³ /sec. The set of contours on the left shows the temperature increase during transformation from austenite-to-martensite, while those on the right show the temperature decrease during transformation from martensite-to-austenite. During forward transformation the temperature increases by as much as 25'K above the ambient temperature of 300 K due to the exothermic austenite-to-martensite transformation, whereas it decreases by as much as 25'K below the ambient temperature during the reverse endothermic trans-formation from martensite-to-austenite. . . . . 106 3-9 (a) Nominal strain versus time profile for the tension-hold experiment
at a baseline nominal strain rate of 1.25 x 10- /sec and initial tem-perature of 300 K. (b) Superelastic stress-strain curve measured in the experiment. The prediction from the finite-element simulation is also shown. ... ... 107 3-10 (a) Superelastic stress-strain curve in tension. The experimental data
from this test were used to estimate the constitutive parameters. The curve fit using the constitutive model is also shown, and (b) Superelas-tic stress-strain curve in torsion. The prediction from the constitutive m odel is also shown. . . . . 108
3-11 (a) Loading program for combined tension-torsion experiment. (b)
Undeformed mesh of 768 ABAQUS C3D8R elements. (c) Deformed mesh at a tensile strain of 3% and a shear strain of 4.5%. Contours of martensite volume fraction are shown. (d) Superelastic stress-strain curve in tension. (e) Superelastic stress-strain curve in shear. The prediction from the constitutive model is also shown. . . . . 109 3-12 (a) Illustration of the SciMed stent. The 14-mm stent consists of five
segments attached to each other at three sites. This design allows for good support without gaps, and high flexibility, and (b) Scanning electronic microscopic picture of the SciMed stent with full expansion. (Taken from the Handbook of coronary stents, (Serruys, 1997)). . . . 110
3-13 (a) Geometry of diamond-shaped strut test specimens; all dimensions
are in millimeters. The sheet form which the specimens were machined is 0.53 mm thick. (b) Initial finite-element mesh of one-quarter of the specimen. . . . .111 3-14 Superelastic force-displacement curve of the diamond-shaped strut test
specimen in tension and compression. The corresponding prediction from the finite-element simulation is also shown. . . . . 112
3-15 (a) The physical position of the diamond-section stent, and (b) the
cor-responding finite-element mesh with contours of the martensite volume fraction . . . . 113 3-16 (a) Initial finite-element mesh of a segment of the stent.(b) The fully
crimped state of the stent with contours of martensite volume fraction. (c) Predicted axial load-displacement curve from the finite-element sim ulation. . . . . 114
B-i (a) Schematic diagram of an austenite-twinned martensite transforma-tion system, and (b) a magnified schematic diagram of the twinned m artensite. . . . . 134
G-1 Comparison of the shear-stress versus shear-strain response in simple
shear predicted by the non-standard flow rule versus that predicted by the standard-Mises type flow rule. The nonstandard flow rule predicts the expected closed flag-type hysteresis loop. . . . . 205
H-1 (a) Experimentally-measured texture in the as-received Ti-Ni sheet, and (b) its numerical representation using 420 discrete unweighted crystal orientations. . . . . 209
H-2 (a) Undeformed mesh of 420 ABAQUS C3D8R elements used to rep-resent a textured polycrystal aggregate. (b) Superelastic stress-strain curve in tension along the rolling direction. The experimental data from this test were used to estimate the constitutive parameters. The curve fit using the full finite-element model of the polycrystal is also
shown... ... 210
H-3 (a) Superelastic experiment conducted along the (a) 100 and (b) 20'
direction. The prediction from the finite-element simulations are also show n . . . . . 211 H-4 (a) Superelastic experiment conducted along the (a) 30' and (b) 40'
direction. The prediction from the finite-element simulations are also show n . . . . 212
H-5 (a) Superelastic experiment conducted along the (a) 500 and (b) 60'
direction. The prediction from the finite-element simulations are also show n . . . . 213 H-6 (a) Superelastic experiment conducted along the (a) 70' and (b) 80'
direction. The prediction from the finite-element simulations are also show n . . . . 214
H-7 (a) Superelastic experiment conducted along the transverse direction.
The prediction from the finite-element simulations is also shown, and
(b) Superelastic experiment along the rolling direction compared with
the transverse direction. The finite-element simulation along the trans-verse direction is also shown. . . . . 215 H-8 Comparison of the nucleation stresses of the differently-oriented
speci-mens during the forward and reverse transformation at 2% strain with respect to the prediction from the finite-element simulations. . . . . . 216
Chapter 1
Introduction
Shape-memory alloys (SMAs) are finding increased use as functional/smart-materials for a variety of applications (see Figure 1-1). The individual grains in these polycrys-talline materials can abruptly change their lattice structure in the presence of suitable thermo-mechanical loading. This capability of undergoing a solid-solid, diffusionless, displacive phase transformation leads to the technologically-important properties of superelasticity and shape-memory.
Currently, the near-equiatomic Ti-Ni alloys are the most popular shape-memory materials for applications. The reversible transformations between the various phases observed upon changing the temperature, under zero stress, in the case of Ti-Ni are as follows. The transformation sequence upon cooling from a high-temperature body-centered-cubic superlattice, B2, austenite phase is first to a rhombohedral R-phase, and then to a monoclinic martensite phase. Upon heating, the reverse transforma-tion takes place; however, the R-phase is not observed. Under certain conditransforma-tions, the R-phase may be suppressed, and the only transformation in a specimen is the cubic-to-monoclinic transition. Under zero stress, shape-memory materials are dis-tinguished by the following four temperatures: Oms, martensite start temperature; 9mf, martensite finish temperature; 0as, austenite start temperature; and Oaf,
austen-ite finish temperature.
As mentioned previously, an important characteristic response of shape-memory materials is superelasticity. A schematic diagram for the superelastic response is shown in Figure 1-2a. This is a consequence of a stress-induced transformation from austenite to martensite and back when a sample is tested in cyclic uniaxial extension, between zero and a finite but small (~5%) strain, under quasi-static conditions at a constant ambient temperature above its austenite finish temperature, Oaf. There is little or no permanent deformation experienced by the specimen in such a strain cy-cle; this gives an impression that the material has only undergone elastic deformation, and hence the term superelastic. However, there is hysteresis; the mechanism respon-sible for the hysteresis is the motion of sharp interfaces between the two material phases. For a given material, the size and other qualitative features of the "flag-type" hysteresis loops usually change with the loading rate and the temperature at which the test takes place. Superelastic response can also be triggered by a change in temperature after a pre-stress is applied on the shape-memory material. This is widely known as the strain-temperature cycling response. A schematic diagram for the strain-temperature cycling response is shown in Figure 1-2b.
The shape-memory effect by transformation occurs when a material which is ini-tially austenitic is first tested in isothermal uniaxial extension at a temperature 0ms < 0 < Oaf. During forward loading, a transformation from austenite to marten-site occurs, but upon reversal and unloading to zero stress, the transformation strain does not recover until the temperature is subsequently raised to 0 > Oaf.
If the temperature is lower than the martensite finish temperature, 0 < Omf, the material is initially in the martensitic state. In this condition SMAs can also exhibit superelastic and shape-memory effects, but the inelastic strain is caused by reorientation of the martensitic variants, and not by transformation (e.g. Saburi and
Nenno, 1981; Miyazaki and Otsuka, 1989; Otsuka and Wayman, 1999).
There is substantial activity worldwide to construct suitable constitutive models for shape-memory materials, and several existing one-dimensional constitutive models can capture the major response characteristics of SMAs reasonably well (e.g. Liang and Rogers, 1990; Abeyaratne and Knowles, 1993; Ivshin and Pence, 1994; Bekker
and Brinson, 1997).
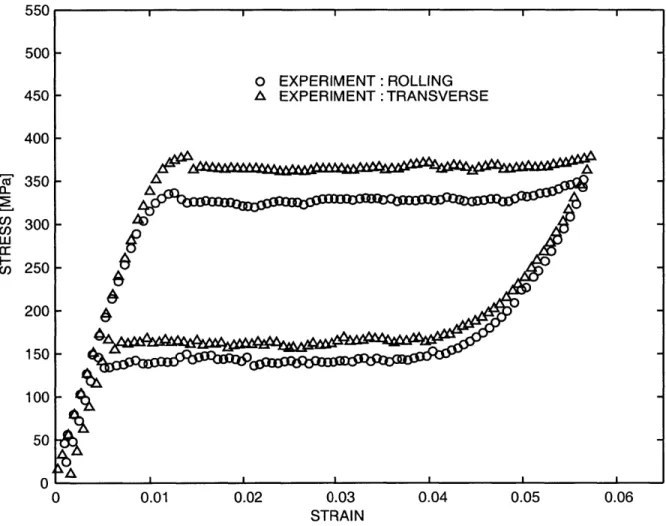
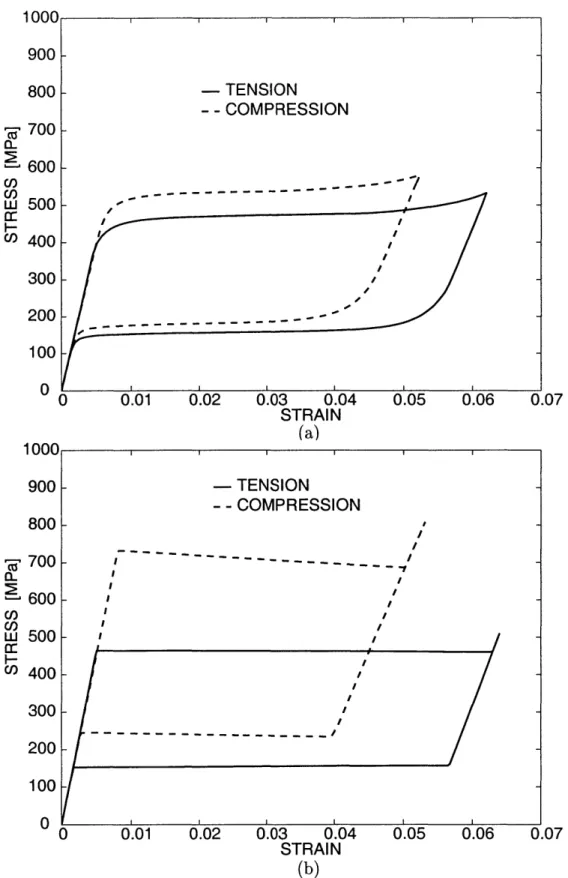
Prominent amongst the three-dimensional models are the ones proposed by Sun and Hwang (1993a,b), Boyd and Lagoudas (1994,1996), Patoor et al. (1996), Au-ricchio and Taylor (1997), Lu and Weng (1998), Gao et al. (2000) and others, but most of these models have been shown to work best for uniaxial loading. It is dif-ficult to test the applicability of these models in real three-dimensional situations because there is a lack of pedigreed multi-axial experimental data, although some nice experiments have been recently reported by Lim and McDowell (1999). Indeed, the predictions from these models which have been calibrated from data for simple tension, have not even been verified for the case of simple shear. Also, these models do not adequately capture the asymmetry observed between tension and compression superelastic experiments, where it is found that at a given test temperature: (i) the stress level required to nucleate the martensitic phase from the parent austenitic phase is considerably higher in compression than in tension; (ii) the transformation strain measured in compression is smaller than that in tension; and (iii) the hysteresis loop generated in compression is wider (measured along the stress axis) than the hysteresis loop generated in tension. These major differences between the tension and compres-sion response of a Ti-Ni rod alloy in superelasticity experiments (to be described more fully later) are shown in Figure 1-3. Anisotropic effects are even manifested in a Ti-Ni sheet alloy, as shown in Figure 1-4 where the superelastic tensile response along the rolling and transverse direction is shown. Further investigation on superelastic behavior at various deformation rates also show that : (i) The stress-strain response "hardens" more as the rate of deformation increases; and (ii) the hysteresis loops get wider (measured along the stress axis) as the deformation rate increases. These experimental results on a Ti-Ni sheet conducted at various deformation rates at the same ambient temperature are shown in Figure 1-5.
It is now well recognized that shape-memory materials derive their unusual and inherently nonlinear and anisotropic properties from the fine-scale rearrangements of phases, or "microstructures," and that the strain produced by the superelastic-ity effect depends on crystal orientations. Specially-oriented single crystals of some
shape-memory materials can produce sizeable strains (~ 10%) due to phase
trans-formations. In applications, shape-memory materials are typically polycrystalline in nature, and are usually processed by casting, followed by hot-working (drawing for rods and wires, and rolling for sheet) and suitable heat treatments. Polycrystalline SMAs so produced are usually strongly textured, and various researchers have recently emphasized that crystallographic texture is very important in determining the overall properties of SMAs (e.g. Inoue et al., 1996; Zhao et al., 1998; Shu and Bhattacharya,
1998; Gall and Sehitoglu, 1999).
Shu and Bhattacharya (1998) have developed an analytical geometric model to estimate the effects of initial crystallographic texture on the amount of recoverable strains in SMAs. They show that texture is important in determining the amount of shape-memory effect in polycrystals. In particular, they qualitatively show that even though Ti-Ni and Cu-Zn-Al based SMAs both undergo cubic-monoclinic transforma-tions, and both have similar transformation strains at the single-crystal level, it is the difference in the crystallographic texture between the two polycrystalline SMAs in bulk sheet, rod, and wire forms which gives rise to a larger shape-memory effect in Ti-Ni.
More recently, Gall and Sehitoglu (1999) have studied the stress-strain behav-ior of polycrystalline Ti-Ni under tension versus compression. They used a micro-mechanical model which incorporates single-crystal constitutive equations and exper-imentally measured polycrystalline texture into a "self-consistent" model for poly-crystals (Patoor et al., 1996) to argue that the tension/compression asymmetry in Ti-Ni shape-memory alloys was related to the initial crystallographic texture of their specimens2
An important feature of the superelastic response of Ti-Ni wires observed by Shaw
2
We do not completely understand the model and computational procedure used by Gall and Sehitoglu (1999) because sufficient details are not provided by the authors. It appears that these authors consider a model in which the transformation rates are determinable only if the model contains an invertible "interaction energy matrix" (their equation 11). They attribute the magnitude of the tension-compression asymmetry in the superelasticity behavior of their Ti-Ni material to the magnitudes of the terms of the interaction moduli. In contrast, we show in this work that the major features of the tension-compression asymmetry in textured drawn bars of Ti-Ni are captured even if the interaction matrix is set to zero.
and Kyriakides (1997) was that the transformation from austenite-to-martensite did not occur homogeneously in their specimens. Further investigations by Shaw and Kyriakides
[2]
on Ti-Ni sheets also showed that the phase transformation occurredby the nucleation and propagation of fronts, and that because of the exothermic
and endothermic nature of the austenite-to-martensite and martensite-to-austenite transformations, respectively, there were substantial measurable temperature changes in the gage section of their sheet tensile specimens. These temperature changes also result in an "apparent hardening" of the nominal superelastic stress-strain curves, as
observed by Entemeyer et al. (2000).
With this brief introduction, the purpose of this thesis is to formulate and nu-merically implement a crystal-mechanics-based constitutive model for shape-memory materials, and to verify whether the model is able to capture the major features of the experimentally-measured effects of crystallographic texture on superelasticity of polycrystalline Ti-Ni alloy, and also to numerically capture the inhomogeneous de-formation associated with the nucleation and propagation of transde-formation fronts, and also the apparent hardening of the nominal stress-strain curves observed in the experiments as the loading rate is increased.
The plan of this thesis is as follows: In Section 2.1, we formulate a rate-independent single-crystal constitutive model, where the inelastic deformations occur
by phase transformations. We have implemented our constitutive model in the
finite-element program ABAQUS/Explicit (1999,2001); algorithmic details of the time-integration procedure used to implement the model in the finite-element code are given in Appendix A. This computational capability allows us to perform two types of finite-element calculations: (i) where a finite-element represents a single grain and the constitutive response is given through a single-crystal constitutive model, and (ii) where a finite-element quadrature point represents a material point in a polycrystalline sample and the constitutive response is given through a Taylor-type polycrystal model.
In Section 2.2 the results from experimental measurements of crystallographic texture of a Ti-Ni rod-alloy are described. Material parameters appearing in the
constitutive model for this alloy have been evaluated. The procedure to determine these parameters from differential scanning calorimetric (DSC) measurements, and a room temperature isothermal superelasticity experiment in tension are also outlined in Section 1-3. We show that our model is able to reproduce the stress-strain curve of the initially-textured Ti-Ni alloy in simple tension. Next, with the model so calibrated, we show that the predictions for the stress-strain curves from the model are in good agreement with superelasticity experiments on the same pre-textured material in simple compression, thin-walled tubular torsion, combined tension-torsion, and path change tension-torsion.
To determine the degree to which the initial texture controls the macroscopic asymmetry in the superelastic response in tension and compression, we have also compared the predicted stress-strain responses in simple tension and simple compres-sion if the initial texture is taken to be random. Our calculations show that in this case the response in compression is very similar to that in tension. Accordingly, we conclude that crystallographic texture is the prime cause for the observed tension-compression asymmetry in shape-memory materials.
In Section 2.2.1, we evaluate the applicability of a Taylor-type model for inelastic deformations by phase transformation. Some previous work done by Bhattacharya and Kohn (1996,1997) shows that the Taylor model provides a good approximation in estimating the transformation induced strain. Our calculations also show that such a Taylor-type model is also able to predict reasonably well the macroscopic stress-strain curves.
In Section 2.2.2 we examine the applicability of our model to another Ti-Ni al-loy for which Shaw and Kyriakides (1995) have conducted careful experiments at a variety of different temperatures. Unfortunately, these authors do not report on the initial crystallographic texture of their material. However, since they conducted their experiments on drawn Ti-Ni wires, we assume that their material has a texture sim-ilar to our drawn rods. We estimate the constitutive parameters for their material from their DSC results, and their stress-strain results from a pseudoleastic tension test at representative temperature. We show that the predictions for the stress-strain
response from our constitutive model are in good agreement with the results from their superelastic experiments at a few temperatures, 0 > Oaf.
Shaw and Kyriakides (1995) also report on displacement controlled experiments at temperatures in the range 0ms < 0 < Oaf. In these experiments the martensite that forms during forward deformation does not completely transform back to austenite upon reversing the deformation and decreasing the stress to zero. Although Shaw and Kyriakides (1995) did not subsequently increase the temperature at zero stress to 0 > 0as to show the shape-memory effect, we have numerically simulated such an experiment, and show that our model is able to also capture the shape-memory effect
by transformation.
In Section 2.3 we investigate the superelastic response of initially-textured Ti-Ni sheet. Here we show the constitutive model, when suitably numerically implemented and calibrated, is shown to accurately predict the anisotropic superelastic response of tension specimens which were cut along different directions to the rolling direction of the sheet. Also, the strain-temperature cycling experiments under different constant axial stresses are predicted with reasonable accuracy. The effects of self-heating and cooling due to the exothermic and endothermic nature of the austenite-to-martensite and martensite-to-austenite transformations were investigated by performing supere-lastic tension experiments at strain rates which are high enough to result in non-isothermal testing conditions. The thermo-mechanically coupled theory is able to capture the resulting inhomogeneous deformation associated with the nucleation and propagation of transformation fronts, and also the "apparent hardening" of the nom-inal stress-strain curves observed in the experiments.
In Section 2 we have successfully applied our crystal-mechanics-based theory to model the superelastic behavior of Ti-Ni rods and sheets under various multi-axial and thermo-mechanical loading conditions. However, as expected, the three-dimensional crystal-mechanics-based theory for polycrystalline materials is computationally inten-sive, and at present not ideally suited for application in routine engineering design.
Guided by the success of the crystal-mechanics theory, we formulate a simpler "isotropic" theory in Chapter 3, in which the major difference is that the evolution
equation for FP is now given by
FPFP-' = NP, (1.1) where denotes a single transformation rate, and NP a suitable symmetric trans-formation tensor which determines the direction of transtrans-formation and its magni-tude. Unlike the crystal-mechanics theory in which the transformation tensors are determined by crystallographically based dyads S', the transformation tensor in the isotropic theory is based on considerations of the stress state during transformation. Although a crystal-mechanics theory is more accurate, an isotropic theory based on such a flow rule, when suitably numerically implemented and calibrated, and its range of applicability verified, should be more immediately useful for the design of compo-nents and systems made from shape-memory materials.
The plan of Chapter 3 paper is as follows. We develop the isotropic model in Section 3.1; we have implemented the model in the finite element programs ABAQUS/Explicit and ABAQUS/Standard (2001). Algorithmic details of the time-integration procedure and Jacobian matrices for the numerical implementation are given in Appendix E and F, respectively. In Section 3.2.1 and 3.2.2 we evaluate the applicability of this isotropic model to reproduce the experimentally-measured superelastic response of the polycrystalline Ti-Ni sheets and rods, which experimen-tal results are reported in Chapter 2. The two manifestations of superelasticity -stress-strain response at a fixed temperature and strain-temperature response at a fixed stress - are explored. In Section 3.3 we use our computational capability to show that it may be used to analyze the response of a technologically important structure - a bio-medical stent.
(a)
(b)
Figure 1-1: (a) Shape-memory alloy-based actuation device (Baron et al., 1994). (b) Scanning Electron Microscope (SEM) image of a Scimedt" artery stent (Serruys,
z d: C,, CO) Cf) TIME [s] Input (a) FIXED 0 .d FT A-M M-A
If
STRAIN Output FIXED a A-MM-TEMPERATURE [K] Output z CO) TIME [s] Input (b)Figure 1-2: Schematic diagram of the (a) superelastic, and (b) strain-temperature cycling response. A-M denotes the austenite-to-martensite transformation whereas M-A denotes the martensite-to-austenite transformation.
W
CL
w
10001 1 1 1 1 1 900 800 700 600 500 400 300 200 100 0.02 0.03 0.04 0.05 STRAIN
Figure 1-3: Experimental stress-strain curves for Ti-Ni rod at 6 = 298 K in simple
tension and simple compression. For compression the absolute values of stress and strain are plotted.
0. o Cl) Cl) - TENSION - - COMPRESSION --- -C 0.01 0.06 0.07
550 500 0 EXPERIMENT: ROLLING 450 - A EXPERIMENT: TRANSVERSE 400 -cz 350 - -g) 300 -w U 250 -200 --150 -100 -50 O A 0 0 0.01 0.02 0.03 0.04 0.05 0.06 STRAIN
Figure 1-4: Experimental stress-strain curves for Ti-Ni sheet at 0 = 300 K in simple
tension along the rolling and transverse direction
600 500 400 [ 300 1 100 0 0 0.01 0.02 0.03 0.04 0.05 0.06 0.07 0.08 0.09 STRAIN
Figure 1-5: Experimental stress-strain curves for a Ti-Ni sheet at 0 = 300 K in simple
tension at strain rates of 0.00003/sec, 0.00084/sec, and 0.002/sec. CL) w Cl) o EXPERIMENT: 0.00003 /s A EXPERIMENT: 0.00084 /s o EXPERIM ENT : 0.002 /s 1 1 1 1 -3 0 0 3 0 00 0 3 0 0 I I I o I-I 13 3013 200
Chapter 2
Crystal-mechanics-based
constitutive model
2.1
Single-crystal constitutive equations
In this section we summarize the three-dimensional crystal-mechanics based constitu-tive model of Thamburaja and Anand (2001,2002), which has recently been reformu-lated by Anand and Gurtin (2002) to account for thermal influences within a rigorous thermodynamic framework.1
The overall inelastic deformation of a crystal is always inhomogeneous at length scales associated with the fine-scale microstructures accompanying the austenite-martensite phase transformations. Thus, for the continuum level of interest here, the inelastic deformation should be defined as an average over a volume element that must contain enough transformed regions to result in an acceptably smooth process. The such smallest volume element above which the inelastic response may be consid-ered smooth, is labelled a representative-volume element (RVE). In our constitutive model we choose a single-crystal as a representative volume element. The model does not explicitly account for the fine-scale microstructures, but only for the volume fractions of various types of fine structure. Thus the spatially continuous fields that
'This model is not intended to describe a material initially in the martensitic state and inelastic deformation caused by reorientation and de-twinning of the martensitic variants.
define the theory are to be considered as averages meant to apply at length scales which are large compared to those associated with the fine structure.
Using the standard notation of modern continuum mechanics,2 we recall that the deformation gradient F maps referential segments dX to segments dx = FdX
in the deformed configuration. We base the theory on the following multiplicative decomposition of the deformation gradient:3 F = FeFP. Here (i) FP(X) represents the local deformation of referential segments dX to segments dl = FP(X)dX in the relaxed lattice configuration due to the generation, growth and annihilation of austenitic/martensitic fine structure in a microscopic neighborhood of X. (ii) FI(X) represents the mapping of segments dl in the relaxed lattice configuration into seg-ments dx = F (X)dl in the deformed configuration due the "elastic mechanisms" of
stretching and rotation of the lattice.
In the equilibrium theory of austenite-martensite phase transitions the strain energy minimizers (in the sense of minimizing sequences) generally appear in the form of fine structure, involving abrupt transitions between austenite and twinned martensite in which the transitions are jumps in the deformation gradient of the form So = bo 0 mo, with bo a vector whose magnitude represents the transition
strain, and mo a unit vector normal to the habit plane (the plane of the transition).
A result of the equilibrium theory is a catalog of such rank-one tensors for various
shape-memory alloys (cf. James and Hane (2000) and the references therein). Here we take, as a basic ingredient of the theory, a system of N such transformation ten-sors S' = b Om', i = 1,2, ... , N, where b are vectors whose magnitudes represent the transformation strains, and mi are unit vectors representing the corresponding
2Notation: V and Div denote the gradient and divergence with respect to the material point
X in the reference configuration; grad and div denote these operators with respect to the point x = y(X, t) in the deformed configuration, where y(X, t) is the motion; a superposed dot denotes
the material time-derivative. We write sym A, skw A, respectively, for the symmetric, and skew parts of a tensor A. Also, the inner product of tensors A and B is denoted by A . B, and the magnitude of A by JAl = VA -A. Here repeated indices do not imply a summation over all the possible values the indices can take. For summation the E sign is used.
3
This decomposition is identical in form to the classical decomposition used to formulate dislo-cation based finite single-crystal plasticity. In this work we use the superscript p for two reasons: (i) to stress similarities between the present theory and single-crystal plasticity; and (ii) as shorthand for "phase transformation".
habit-plane normals; these constant vectors are not necessarily orthogonal. We de-note by $'(X, t), 0 < ' < 1, the local volume fraction of martensite at X associated with the ith system at time t. The presumption that the phase transformations take place through nucleation and growth of plate-like volume elements is based on the hypothesis that the evolution of FP is governed by the transformation rates d via the relation FP = LPFP, LP = E § . For system i, transformation
from
austenite to martensite, abbreviated a -+ m, occurs when d' > 0; a transformation from marten-site to austenite, abbreviated m -+ a, occurs when d < 0. We write = for the (local) total volume fraction of transformed regions, and assume, as is natural, that 0 < (t) K 1.The underlying constitutive equations relate the following basic variables :4
free energy density per unit reference volume,
F, det F > 0, deformation gradient,
9, 6 > 0, absolute temperature,
T, T = TT, Cauchy stress,
FP, transformation deformation gradient,
(b', mb), transformation systems,
0 < C < 1, martensite volume fraction for the ith system,
0 < 1, total martensite volume fraction,
Fe = FFP~1, det F' >
0, elastic deformation gradient,
Ce = FeTFe, elastic right Cauchy-Green tensor, Ee = (1/2) (Ce - 1), elastic strain,
Te = (det F)Fe-TFe~T, elastic stress. The constitutive equations are:
4Using the notation of modern continuum mechanics, we write F'-1 = (Fe)-l, FP-T
= (FP) T,
1. Free energy: The free energy is taken in the separable form5
O(Ee )7) = Oe (Ee, O,) + 4 (6) +4,tr(O,), with (2.1)
,e((Ee, 0, ) = (1/2)Ee - C( )[Ee] - (0 - 90)A(() C( )[Ee], (2.2) 0'9(0) = c(O - Oo) - c In (O/6o), (2.3)
,tr (6 ) = (AT/OT) (0 - OT) . (2.4)
Here C( ) is the elasticity tensor and A() is the thermal expansion tensor at the reference temperature 60. The constant c is the specific heat per unit
vol-ume of the reference configuration. The parameter OT is the phase equilibrium temperature, AT is the latent heat per unit reference volume of the a + m
transformation at temperature OT.6
2. Stress:
The elastic stress is given by
T e Ee =C()[El - A( )(O - Oo)]. (2.5)
We define the resolved force on the ith system by
= b. (Ce Te)mi. (2.6)
Note that since the magnitude of b' represents a transformation strain, T' has units of energy per unit reference volume, and it is for this reason we call it a resolved force rather than a resolved stress. Further, the derivative
b = (AT/OT)(0 - OT), (2.7)
represents an energetic back force,7 and the driving force for phase
transforma-tion on the ith system is given by
fi = (i - b). (2.8)
'A term of the form (1/2)>gi' ,3 where the scalar constants g'J = g3' characterize ener-getic interactions between the transformation systems, may be included in the free energy ptr, but
we shall neglect such a contribution in our application of the theory to Ti-Ni.
6Here we are guided by the one-dimensional development of Abeyaratne and Knowles (1993). An
obvious generalization of ?p' would be to replace it by
Z'(r/ar)
(0 - Oir) (%.From the second law of thermodynamics, the dissipation accompanying the phase transformation is given by
(2.9)
Zfili
> 0.From the inequality (2.9), we obtain for the individual transformation systems that
fi i > 0. (2.10)
3. Transformation conditions:
In the rate-independent theory developed here, transformation is assumed to be possible if the driving force fi reaches a critical value. From the inequality (2.10) the transformation conditions are
fi f,
for > 0,fi
=-f, for <0.(2.11)
(2.12)
Here
f,
> 0 is the constant transformation resistance for the ith system. In therate-independent limit the bounds8 on the driving force for phase transformation are
-f <
ft
<
fcz.
(2.13)4. Flow rule:
FP={
with martensitic volume fractions consistent with 0
<
< 1 and 0 <<
1.Moreover,
(i) if -fe < fi < fc,
(ii) if fi =
fj,
0 <then ' = 0;
i <1 and 0 < 1, then
) ; 0 and (fi -
fi)
< 0;8
This is analogous to the yield function in crystal-plasticity.
(2.14)
0<$ <1 and 0< < 1, then <- 0 and (f±i + fj) ) 0; (iv) if fi =
fR
(v) if fi =f and ( = 1, or if fi =fi
and =1, then d=0. and ( = 0, then ( 0;The consistency conditions (2.14) and (2.15) serve to determine the transfor-mation rates (.
5. Entropy; energy balance; heat flux:
The entropy 17 is given by
17 - O - c ln (O/6o) + Ee - C( )[A( )]- (AT/T) . (2.16) The balance of energy may be written as
9?) = -Divq + Zfi
+r,
(2.17)where r is the heat supply per unit volume of the reference configuration, and the referential heat flux q is taken to be governed by Fourier's law
q = -K( )VO, (2.18)
where K(s) is the thermal conductivity tensor at 00. Using (2.16) and (2.18), the energy balance (2.17) becomes
c = Div {K( )V6} + (AT/OT) 0 + E fi'i - 9Ee - C( )[A( )] + r,
To complete the theory for a particular material the constitutive parame-ter/functions that need be specified are
C( ), A( ),7 b', mi, OT, AT,
f,,
c , K((Finally, the standard partial differential equation for the stress referred to the deformed configuration is
div T + J-f = 0, (2.20)
(2.15)
(2.19)
where div represents the divergence operator in the deformed configuration, J = det F, and f is the body force per unit volume in the reference configuration (the body force f is assumed to include inertial forces). The differential equation for the temperature referred to the deformed configuration is
J-1 c = div
{
J-FK( )FTgrad 0} + J-(AT/OT) 0
a
+ J' fi- J'OE -C( )[A( )] + J'r. (2.21) The numerical simulations are carried out using the finite-element computer pro-gram ABAQUS/Explicit (1999,2001), for which we have written a user material sub-routine to implement our constitutive model. Algorithmic details of the numerical implementation are given in Appendix A.
2.2
Evaluation of the constitutive model for a
polycrystalline Ti-Ni alloy : Rod-texture
Suitably thermo-mechanically processed and heat-treated Ti-Ni at 55.96 wt.% Ti drawn rods of 12.70mm diameter, intended for superelastic applications, were ob-tained from a commercial source. Experimental measurements of crystallographic texture of the as-received Ti-Ni were carried out by X-ray irradiation using a Rigaku RU 200 diffractometer. Pole figures were obtained by using the Schultz reflection method with copper-K radiation. To process the experimental data, the PoPLa soft-ware package (Kallend et al., 1989) was employed. Each measured pole figure was corrected for background and defocusing, and also extrapolated for the outer 150. The {111} , {100}, and {110} pole figures for the as-received Ti-Ni looking into the rod-axis (X3) are shown in Figure 2-1. This figure also shows our numerical approx-imation of this measured texture using 729 and 343 unweighted grain orientations. The texture representation using 729 grain orientations is slightly better that that using 343 grain orientations. In most of the calculations reported below we shall use the 729 grain orientation representation of the initial texture. However, we note that the computed stress-strain curves using the set of 343 grain orientations are very close to those using the 729 grain orientations, and the smaller number of orientations may be used for reasons of computational efficiency.
By using differential scanning calorimetric (DSC) techniques, we have determined
the transformation temperatures for our Ti-Ni bar-stock, Figure 2-2. They are:
Oms = 251.3 K, Omf = 213.0 K, Oas = 260.3 K, Oaf = 268.5 K. (2.22) The volume fraction and temperature dependence of the anisotropic elastic con-stants of Ti-Ni are not well-documented in the literature. Here, for simplicity, the values of the elastic constants are taken to follow the rule of mixtures
C( , 0) = (1 - )Ca(o) + Cm(9).
The elastic constants for the cubic austenite phase in Ti-Ni at room temperature are taken as (Brill et al., 1991) :
C1 =130 GPa, C"2 = 98 GPa, C44= 34 GPa.
We have been unable to find experimentally-measured values of the anisotropic elastic moduli of single-crystal monoclinic martensite of Ti-Ni. Typically, the Young's Mod-ulus of austenite is about two to three times that of martensite, while the Poisson's ratios for the material in the two different phases are approximately equal to each other. Guided by this information, we assume that anisotropic elastic constants of the monoclinic martensite may be approximately treated as those of a cubic material, and that the corresponding values of the stiffnesses, Cj, are one half as large as those for the austenite:
Cm = 65 GPa, Cm = 49 GPa, C = 17 GPa.
We realize that this description for the composite elastic constants is rather simplified and approximate. However, since the main purpose of this paper is to model the inelastic response characteristics of shape-memory materials, we shall not further pursue the matter of a more refined description of the elastic moduli of a two-phase austenite-martensite mixture.
For cubic materials, the thermal expansion tensor is isotropic, A a = aal, with aa
denoting the coefficient of thermal expansion for the austenite phase. The thermal expansion tensor for the martensite phase is also assumed to be isotropic i.e. Am = am 1, with am denoting the coefficient of thermal expansion for the martensite phase.
Here, the composite thermal expansion tensor is taken to follow the rule of mix-tures
A = al = (1 - )A a +Am,
with aa and am for Ti-Ni in the austenitic and martensitic conditions taken as (Boyd and Lagoudas, 1996):
aa = 11 x 10- 6/K, am = 6.6 x 10- 6/K.
The crystallographic theory of martensitic transformation (CTM) shows that phase transformation in Ti-Ni can occur on 192 possible transformation systems
Table 1. Transformation Systems i m m m2 bZ bZ b,3 1 -0.8888 -0.4045 0.2153 0.0568 -0.0638 0.0991 2 -0.8888 0.4045 0.2153 0.0568 0.0638 0.0991 3 -0.8888 0.2153 -0.4045 0.0568 0.0991 -0.0638 4 -0.8888 0.2153 0.4045 0.0568 0.0991 0.0638 5 -0.8888 -0.2153 0.4045 0.0568 -0.0991 0.0638 6 -0.8888 -0.2153 -0.4045 0.0568 -0.0991 -0.0638 7 -0.8888 0.4045 -0.2153 0.0568 0.0638 -0.0991 8 -0.8888 -0.4045 -0.2153 0.0568 -0.0638 -0.0991 9 0.4045 -0.8888 0.2153 0.0638 0.0568 0.0991 10 -0.4045 -0.8888 0.2153 -0.0638 0.0568 0.0991 11 0.2153 -0.8888 -0.4045 0.0991 0.0568 -0.0638 12 0.2153 -0.8888 0.4045 0.0991 0.0568 0.0638 13 -0.2153 -0.8888 0.4045 -0.0991 0.0568 0.0638 14 -0.2153 -0.8888 -0.4045 -0.0991 0.0568 -0.0638 15 0.4045 -0.8888 -0.2153 0.0638 0.0568 -0.0991 16 -0.4045 -0.8888 -0.2153 -0.0638 0.0568 -0.0991 17 0.2153 0.4045 -0.8888 0.0991 0.0638 0.0568 18 0.2153 -0.4045 -0.8888 0.0991 -0.0638 0.0568 19 0.4045 0.2153 -0.8888 0.0638 0.0991 0.0568 20 -0.4045 0.2153 -0.8888 -0.0638 0.0991 0.0568 21 0.4045 -0.2153 -0.8888 0.0638 -0.0991 0.0568 22 -0.4045 -0.2153 -0.8888 -0.0638 -0.0991 0.0568 23 -0.2153 0.4045 -0.8888 -0.0991 0.0638 0.0568 24 -0.2153 -0.4045 -0.8888 -0.0991 -0.0638 0.0568
(Hane and Shield, 1999). The CTM theory is discussed and summarized in Appendix B and C.
However, it is not clear whether all the 192 possible systems are actually operative during thermo-mechanical loading. Here, we shall only consider the 24 transformation systems which are unambiguously observed in experiments and used by a variety of recent researchers (e.g. Matsumoto et al., 1987; Lu and Weng, 1998; Gall and Sehitoglu, 1999). The components of the 24 transformation systems (mi, b') with respect to an orthonormal basis associated with the parent cubic austenite crystal lattice are given in Table 1.